
Ystadegau achosion tân ac achub: Ebrill 2025 i Fawrth 2026
Data ar danau, lleoliad, achosion, cymhelliad, anafiadau, galwadau ffug a Digwyddiadau Gwasanaeth Arbennig a fynychwyd ay gyfer Ebrill 2025 i Fawrth 2026. Saesneg yn unig.
Ar y dudalen hon
Introduction
Analysis of all incidents attended by the 3 Fire and Rescue Authorities (FRAs) in Wales, including:
- fires
- false alarms
- Special Service Incidents (SSIs)
The most recent data relates to the financial year ending March 2026 (denoted as FYE 2026) and is provisional as indicated in the charts with a [p]. The Welsh Government compiles these statistics from reports submitted by Fire and Rescue Services (FRSs) to the Fire and Rescue Data Platform (FaRDaP) held by the Ministry for Housing, Communities and Local Government. Data for financial years between FYE 2010 and FYE 2025 was previously submitted by the FRSs to the Incident Recording System.
Incidents in this bulletin are those attended in Wales and may include a small number of incidents attended by English FRSs.
A glossary of terms used within this bulletin can be found later in this report.
Further data are available on StatsWales: fire and rescue incidents.
We are transforming the processes we use to produce fire and rescue statistics to ensure statistical quality while reducing the resources required to carry them out. This is in line with Welsh Government Statistical services’ approach to keeping our statistics sustainable as outlined in our consultation on proposed changes to statistical outputs.
As part of this transformation, several analyses previously included in this bulletin are not included in this year’s publication while the processes used to produce them are being transformed. These include:
- analysis of smoke alarm presence and operation
- cause and source of fires
- attendance response times by fire and rescue services
We will publish data tables for these topics on StatsWales later this year.
Data relating to incidents attended by fire and rescue services for England, Scotland and Great Britain alongside Wales can be found in the fire statistics data tables published by the Ministry for Housing, Communities and Local Government.
Main points
In FYE 2026:
- FRSs attended over 37,000 incidents in Wales, 3% fewer than in FYE 2025
- 11,373 fires were attended, an increase of 12% compared with the previous year; although this is the highest figure since FYE 2019, over the last decade numbers of fires have been relatively stable, staying around 10,000 to 13,000
- the number of fire false alarms fell for the second year in a row (to 14,656); prior to this it had been increasing year-on-year since FYE 2021
- there was no percentage change in the numbers of SSIs compared with the previous year; numbers of SSIs have fluctuated throughout the time series
- numbers of primary fires increased by 7%, compared with FYE 2025; there was a 16% increase in the number of secondary fires
- there were 15 fatal casualties from fires; this is 1 fewer than in FYE 2025
- there were 464 non-fatal casualties, an increase of 19% compared with FYE 2025; this increase was largely driven by those receiving precautionary checks or first aid
All fire and rescue incidents attended
This section includes data and analysis of:
- fires
- fire false alarms
- SSIs
Fire false alarms are events in which the FRS was called to a reported fire which turned out not to exist.
SSIs are non-fire incidents attended by FRSs and include, for example:
- road traffic accidents
- flooding incidents
- medical incidents
Further detail is available in the glossary. SSIs may or may not involve:
- fatalities
- casualties
- rescues
In this analysis SSI figures include SSI false alarms.
The number of incidents attended by FRSs in FYE 2026 (37,012 incidents) fell by 3% compared with FYE 2025, to the lowest number since FYE 2022.
Figure 1: all attendances by FRSs, FYE 2017 to FYE 2026[p]
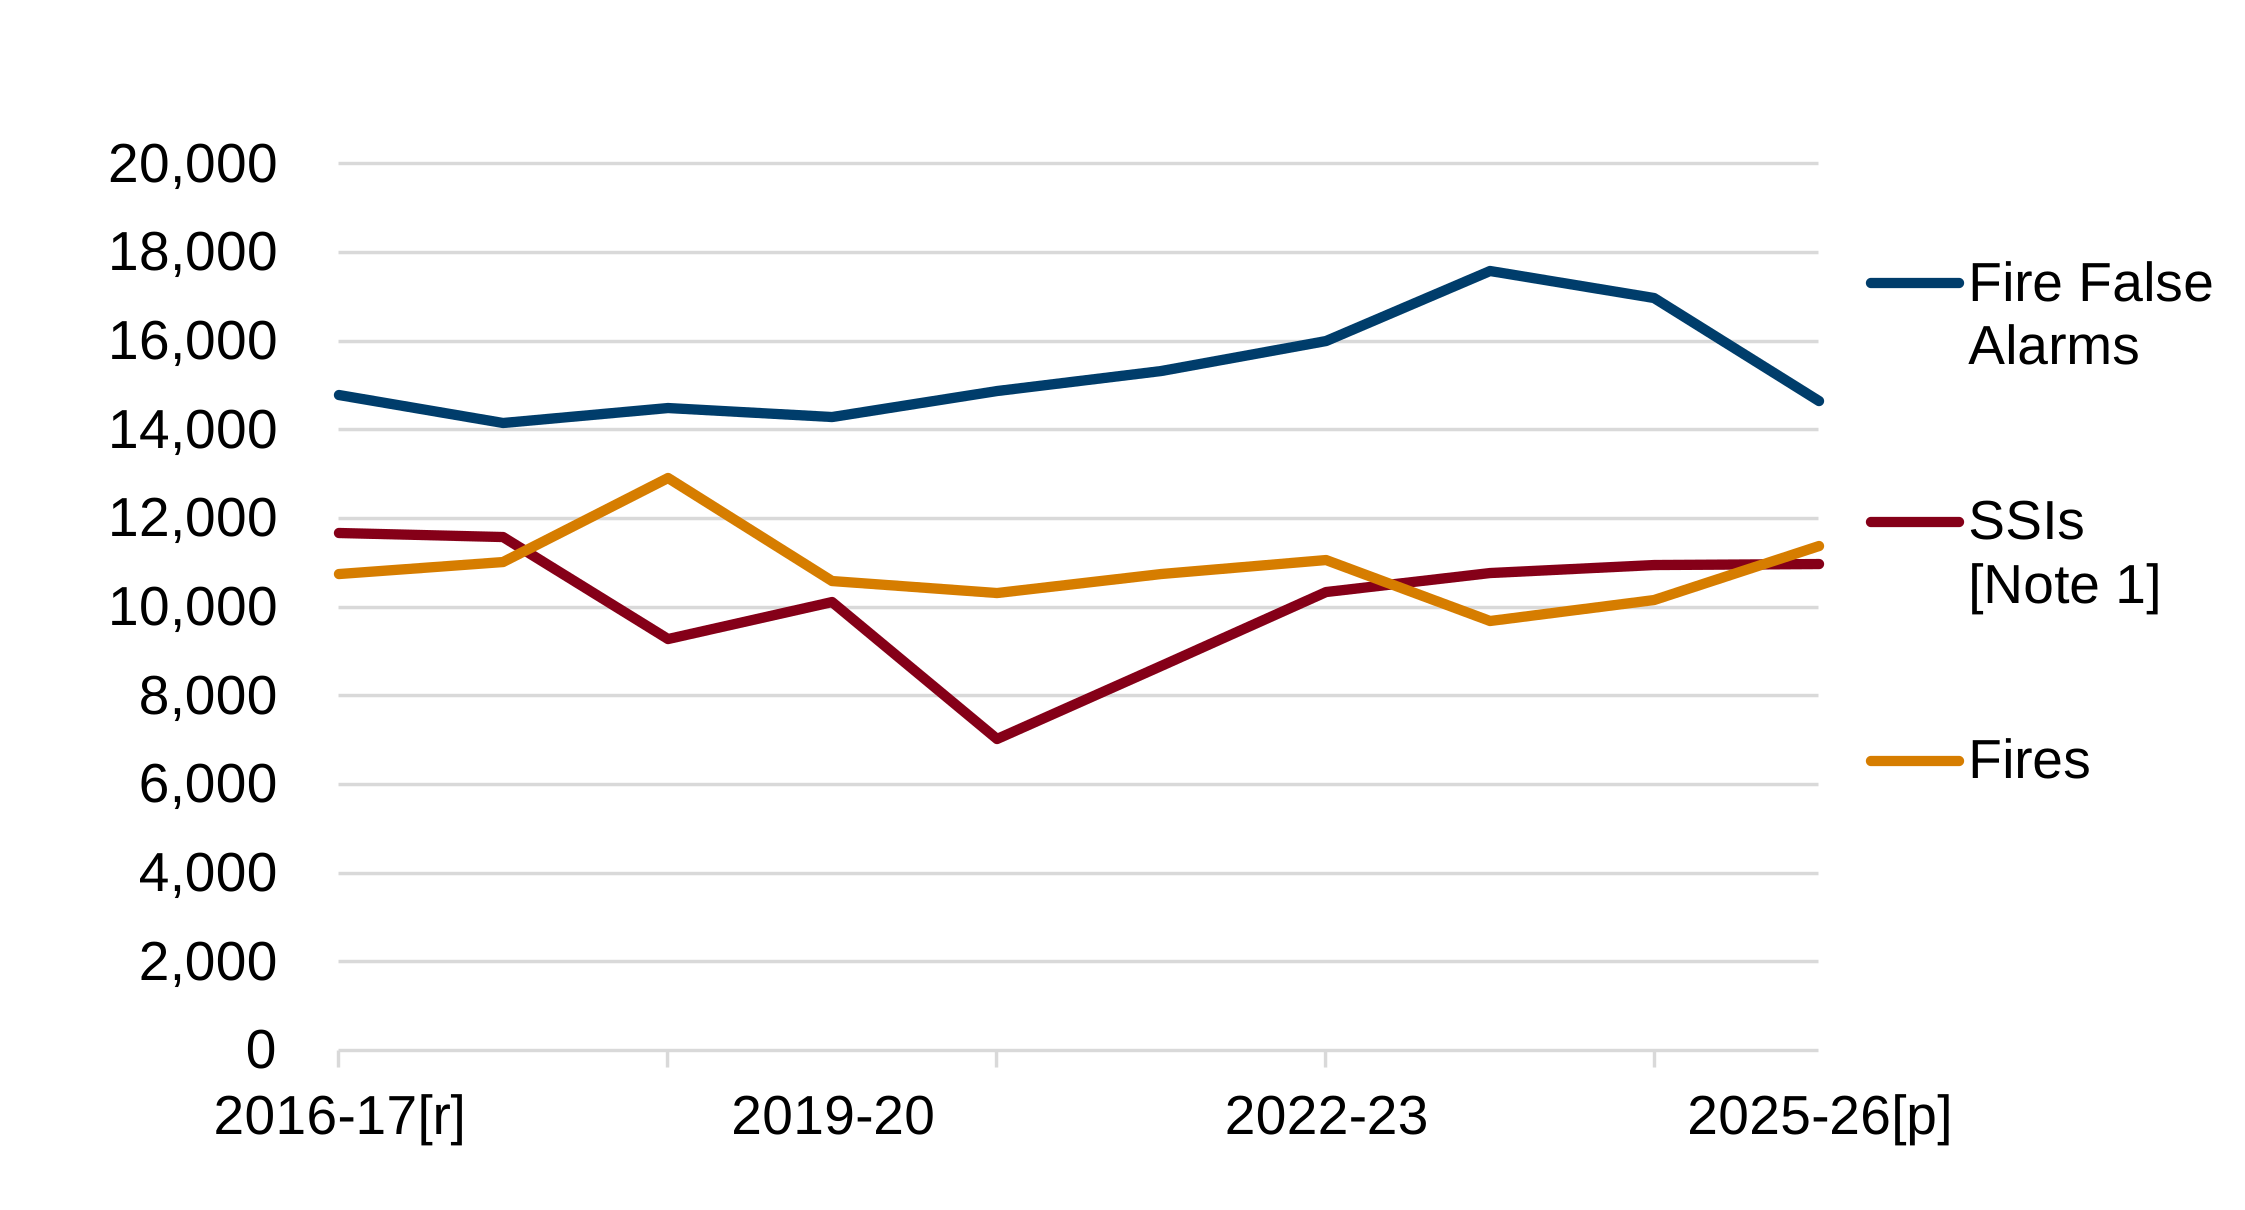
Description of figure 1: line chart showing a time series from FYE 2017 to FYE 2026 for attendances to fires, fire false alarms and SSIs. Fire false alarms have consistently been the most attended incident type throughout the time series shown. The time series in the chart shows numbers of fire false alarms were rising until FYE 2024 but have fallen in the last 2 years. Numbers of fires and SSIs have been similar since FYE 2023, before this time numbers of SSIs were more volatile. The number of fires attended increased by 12% in FYE 2026 compared with the previous year and follows a 5% increase in the year before that.
SSI attendances saw no percentage change in FYE 2026 compared with FYE 2025.
Source: FaRDaP
[Note 1] including SSI false alarms.
[p] provisional data
Of all attendances:
- 11,373 (31%) were at fires
- 14,656 were fire false alarm incidents (40%)
- 10,983 were SSIs including SSI false alarms (30%)
Figure 2: attendances at fire and rescue incidents FYE 2026, by FRA[p]
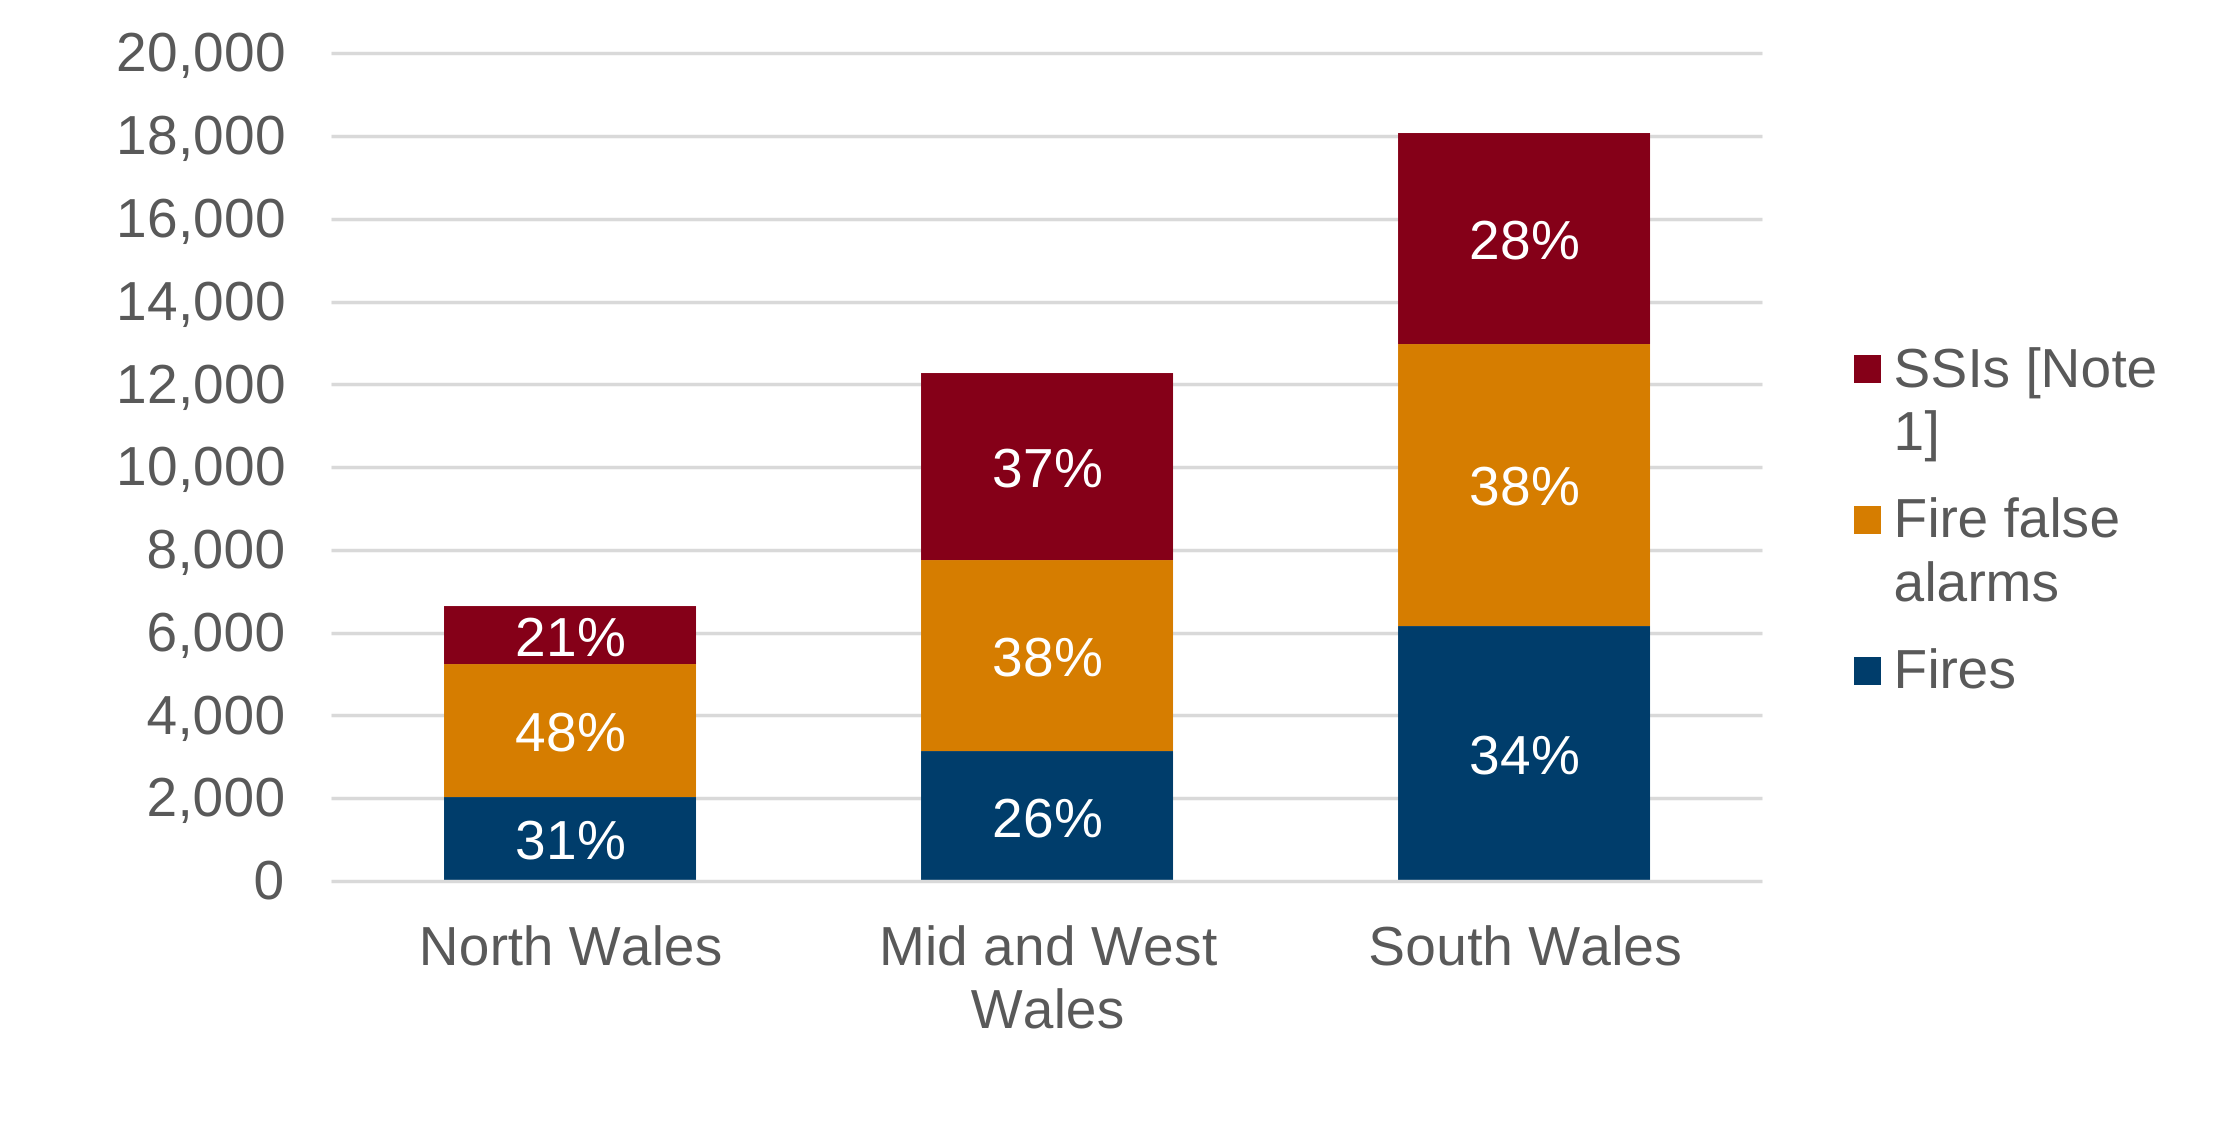
Description of figure 2: a stacked bar chart showing the proportion and number of fires, fire false alarms and SSIs attended in FYE 2026 in each FRA. In all 3 FRAs the largest category of incident type were fire false alarms (around two fifths of attendances in mid and west Wales and swouth Wales and almost half of all attendances in north Wales). In north Wales and south Wales, fires make up the second largest category but in mid and west Wales SSIs are the second largest category.
Source: FaRDaP
[Note 1] SSI data include numbers of SSI false alarms.
[p] provisional data.
Fires attended
Fires are classed as primary, secondary or chimney fires.
Primary fires include:
- all fires in non-derelict buildings and vehicles or in outdoor structures
- any fire involving casualties or rescues
- fires attended by 5 or more appliances
Secondary fires are mainly outdoor fires including grassland and refuse fires unless they involve casualties or rescues or are attended by 5 or more appliances. They include fires in:
- single derelict buildings
- derelict road vehicles
- derelict outdoor structures
Chimney fires are reportable fires in occupied buildings where the fire was confined within the chimney structure and did not involve casualties or rescues or are attended by 5 or more appliances.
Figure 3: fires by fire type, FYE 2017 to FYE 2026[p]
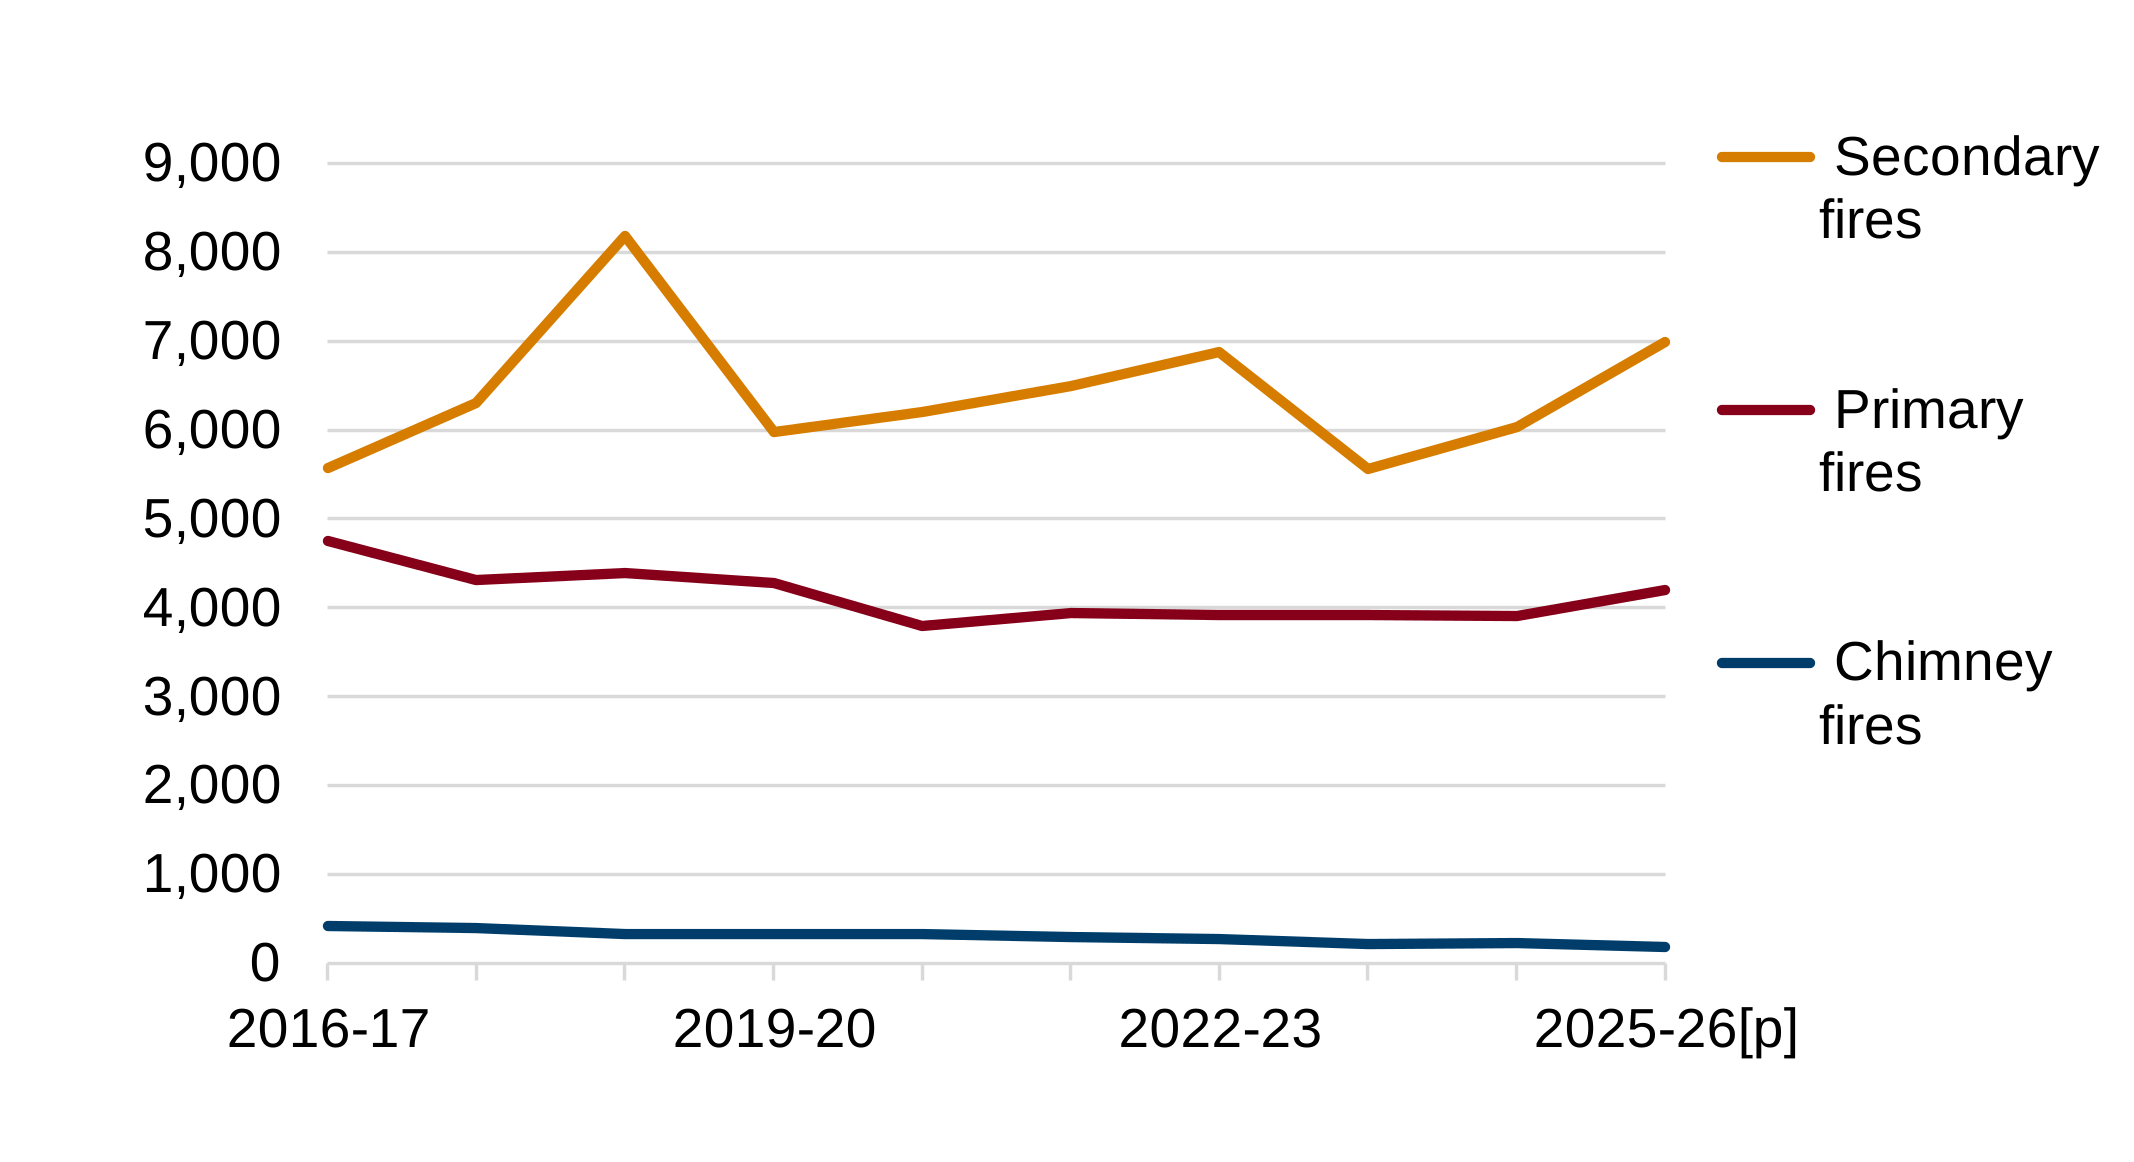
Description of figure 3: a line chart showing the number of primary, secondary and chimney fires since FYE 2017. Most fires are classed as secondary fires and numbers have fluctuated over the years and in FYE 2026 numbers of secondary fires increased to the highest number since FYE 2019. Numbers of primary fires have seen a general downward trend, falling below 4,000 in FYE 2021 and remaining so in spite of some year-on-year increases. Numbers of chimney fires have also fallen by more than 50% in the last decade.
In FYE 2026 there was a 7% increase in the number of primary fires in Wales, compared with FYE 2025. The number of secondary fires increased by 16% whilst the number of chimney fires fell by 17% compared with the previous year.
Source: FaRDaP
[p] provisional data
Figure 4: fires by fire type and FRA, FYE 2026[p]
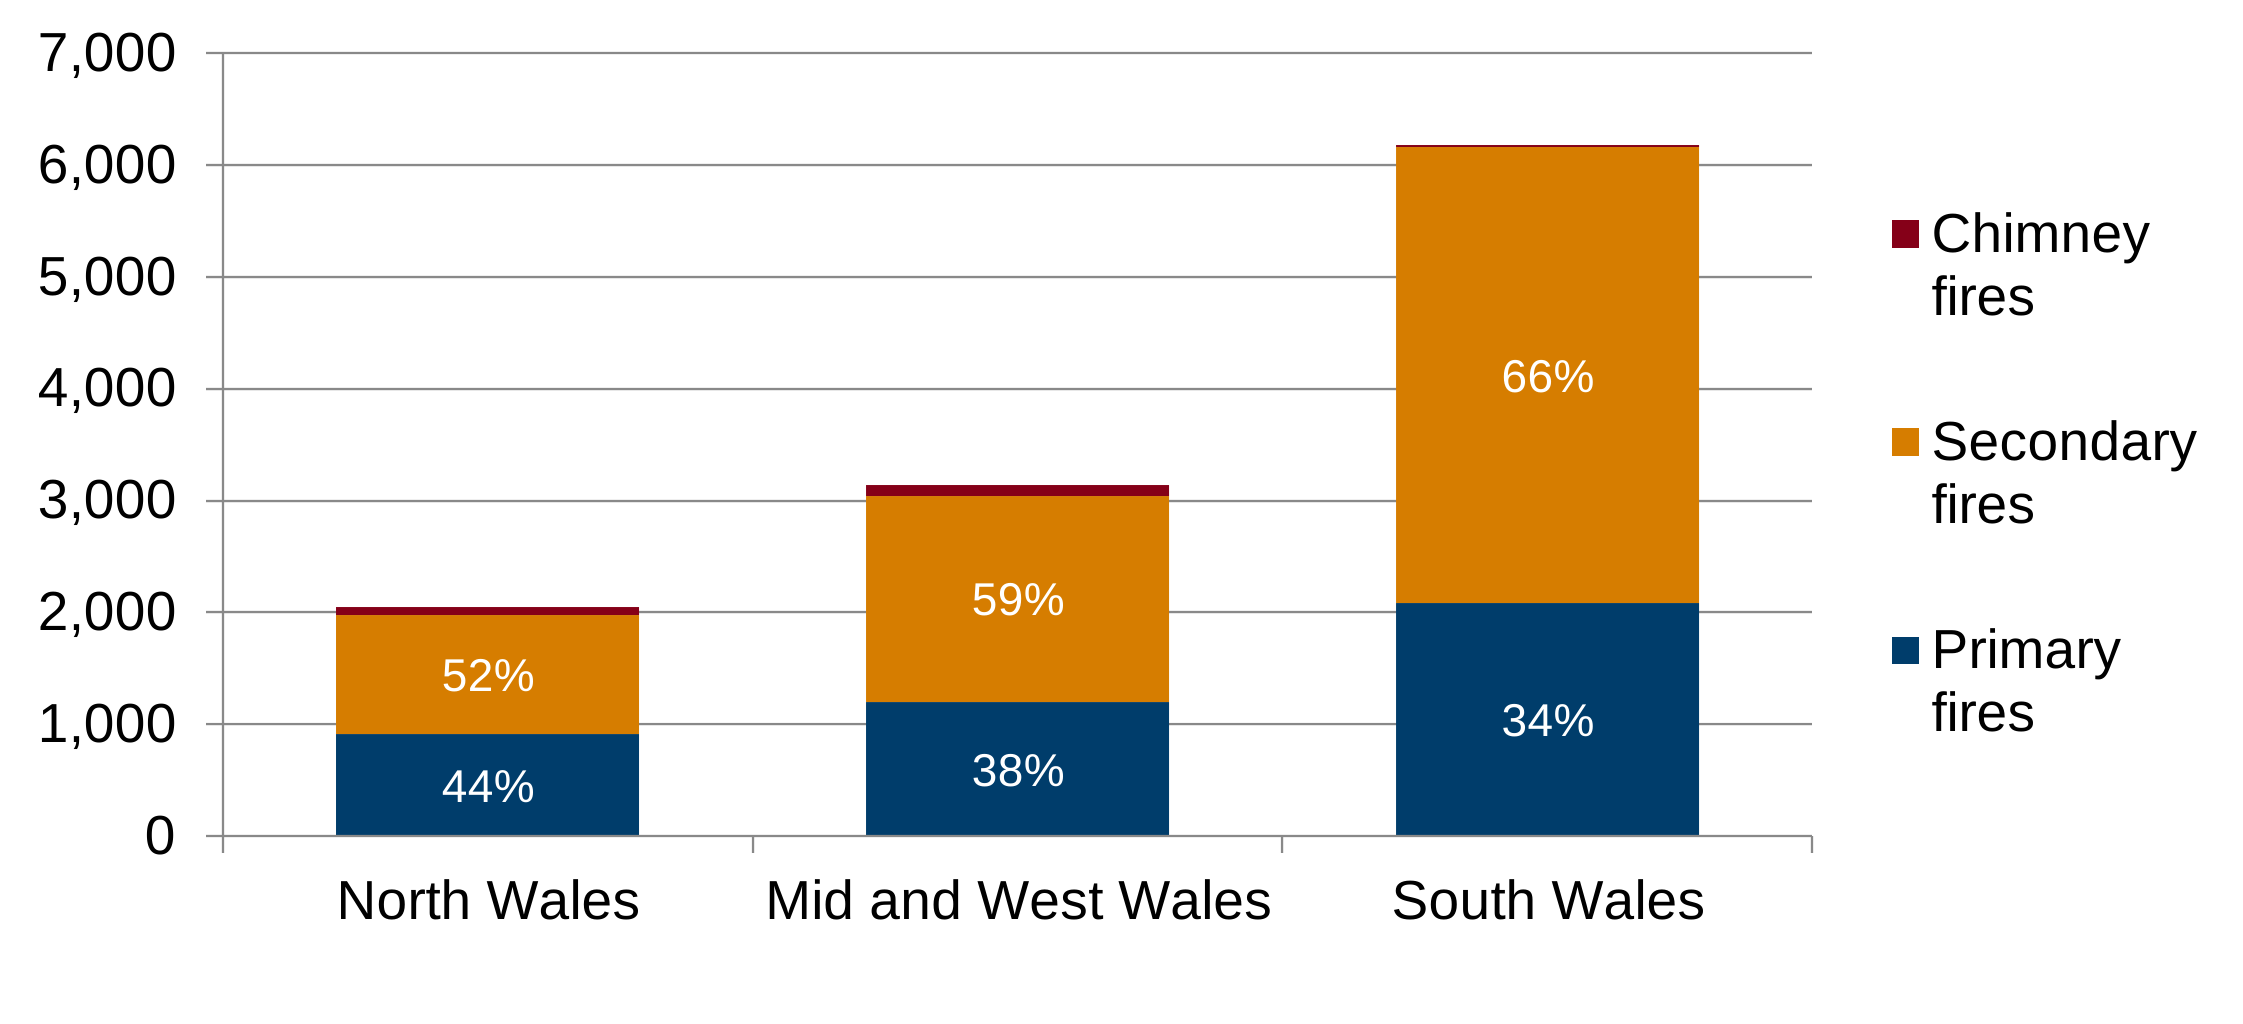
Description of figure 4: a stacked bar chart showing attendance in each FRA at chimney fires, secondary fires and primary fires in FYE 2026. The chart shows in north Wales more than half of fires were secondary. In mid and west Wales there were more secondary fires (almost three-fifths of fires attended) and in south Wales around two-thirds were secondary fires. In all FRAs chimney fires made up the smallest proportion, 3% (in north Wales and mid and west Wales) and 1% (in south Wales).
Source: FaRDaP
[p] provisional data
Primary fires
In FYE 2026 there was a 7% increase in the number of primary fires compared with the previous year, to 4,197. This is the highest figure since FYE 2020 when there were 4,279 primary fires. Numbers of primary fires increased in all Welsh FRAs; in south Wales by 11%, in mid and west Wales by 5% and in north Wales by 2%.
Since FYE 2017 the number of primary fires has fallen by 16% in north Wales whilst numbers fell by 15% in mid and west Wales and by 8% in south Wales.
Figure 5: number of primary fires by FRA, FYE 2017 to FYE 2026[p]
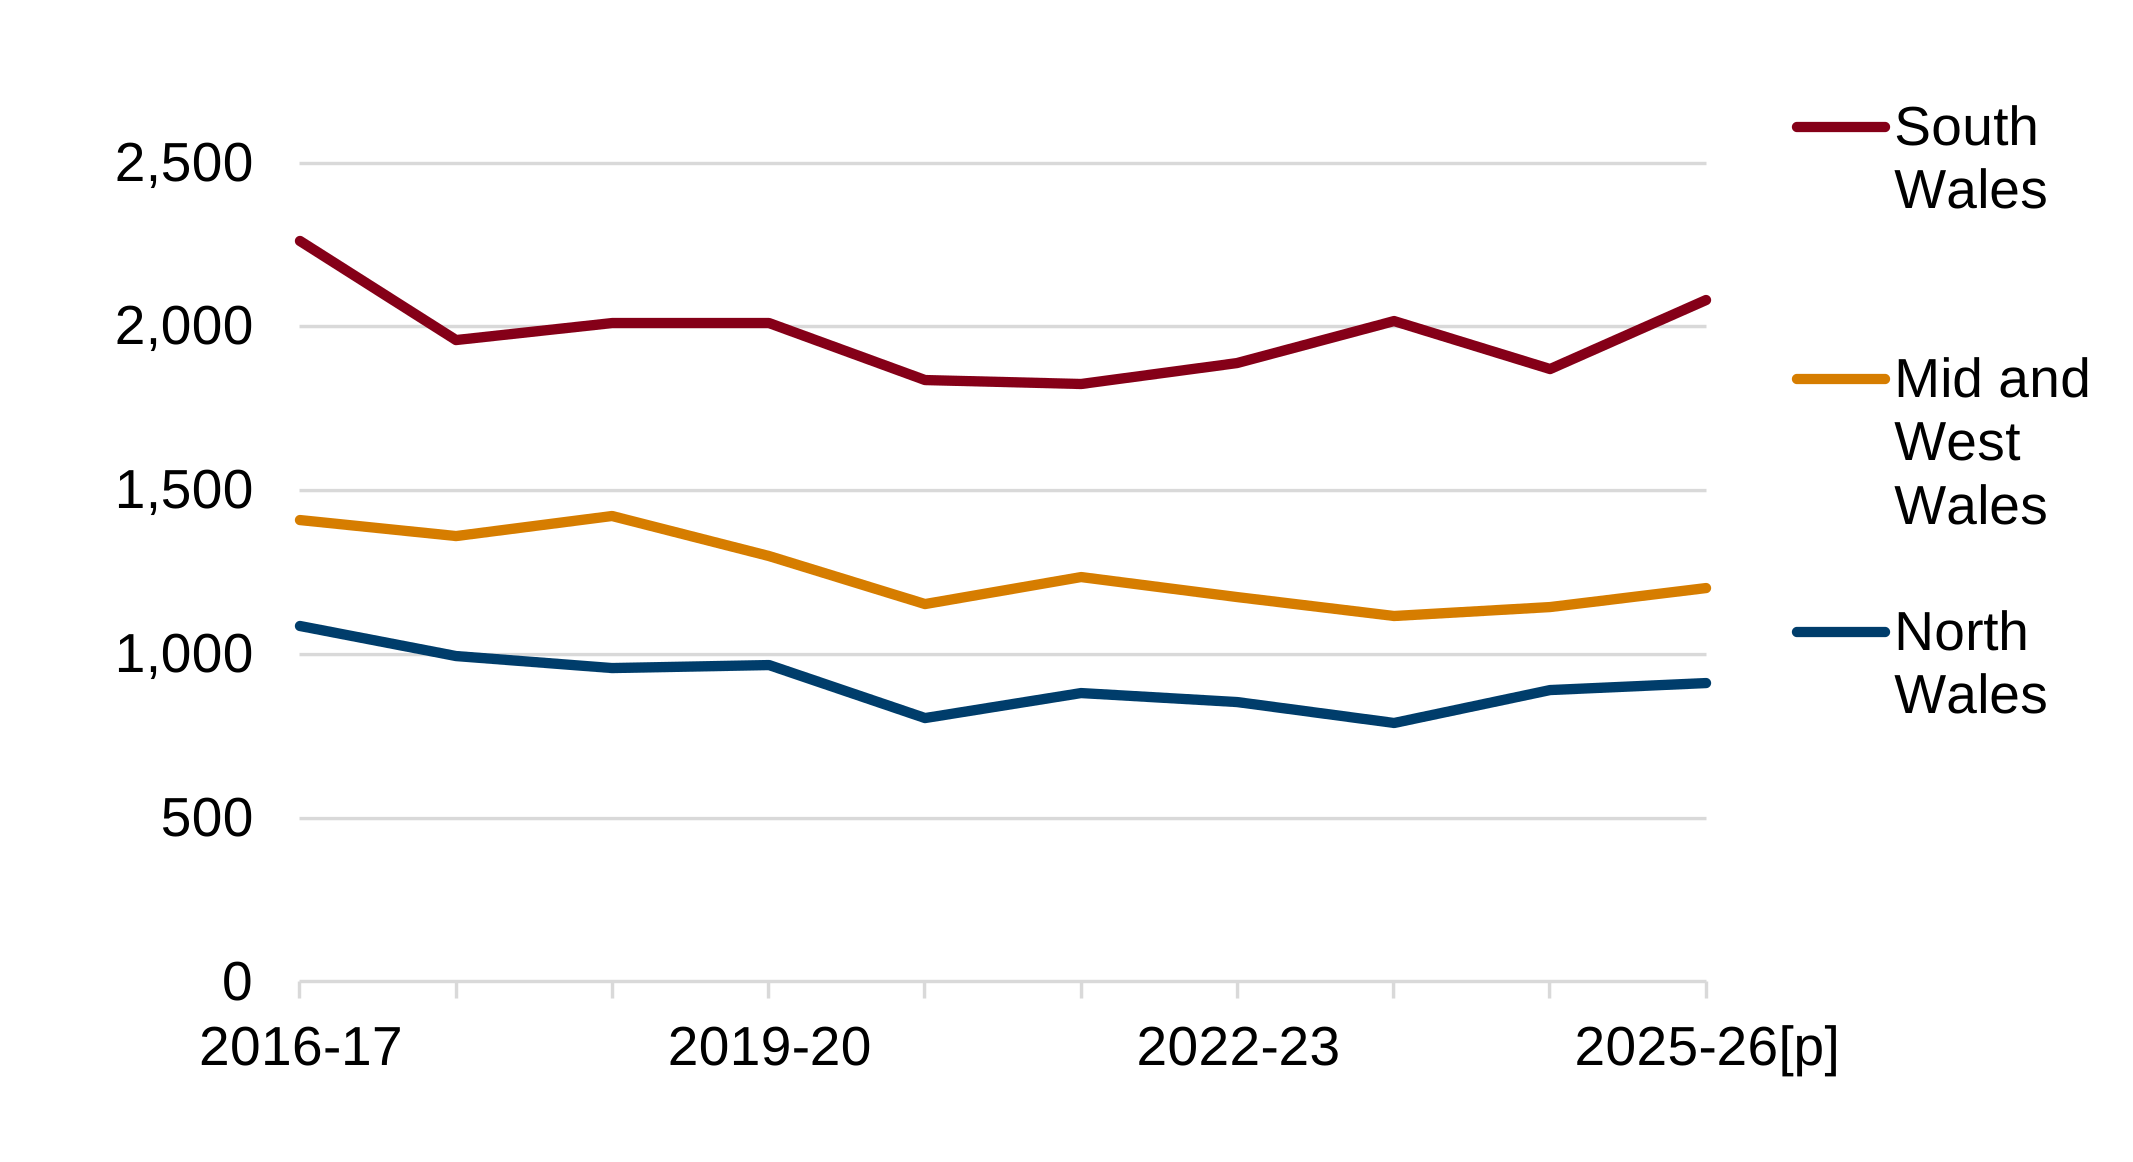
Description of figure 5: a line chart showing the number of primary fires by FRA since FYE 2017. South Wales FRA has consistently had the most primary fire attendances whilst north Wales FRA has had the fewest. All 3 FRAs saw increases in primary fires in FYE 2026 compared with FYE 2025, of 2% in north Wales, 5% in mid and west Wales and 11% in south Wales.
Source: FaRDaP
[p] provisional data
Figure 6: number of primary fires by location, FYE 2017 to FYE 2026[p]
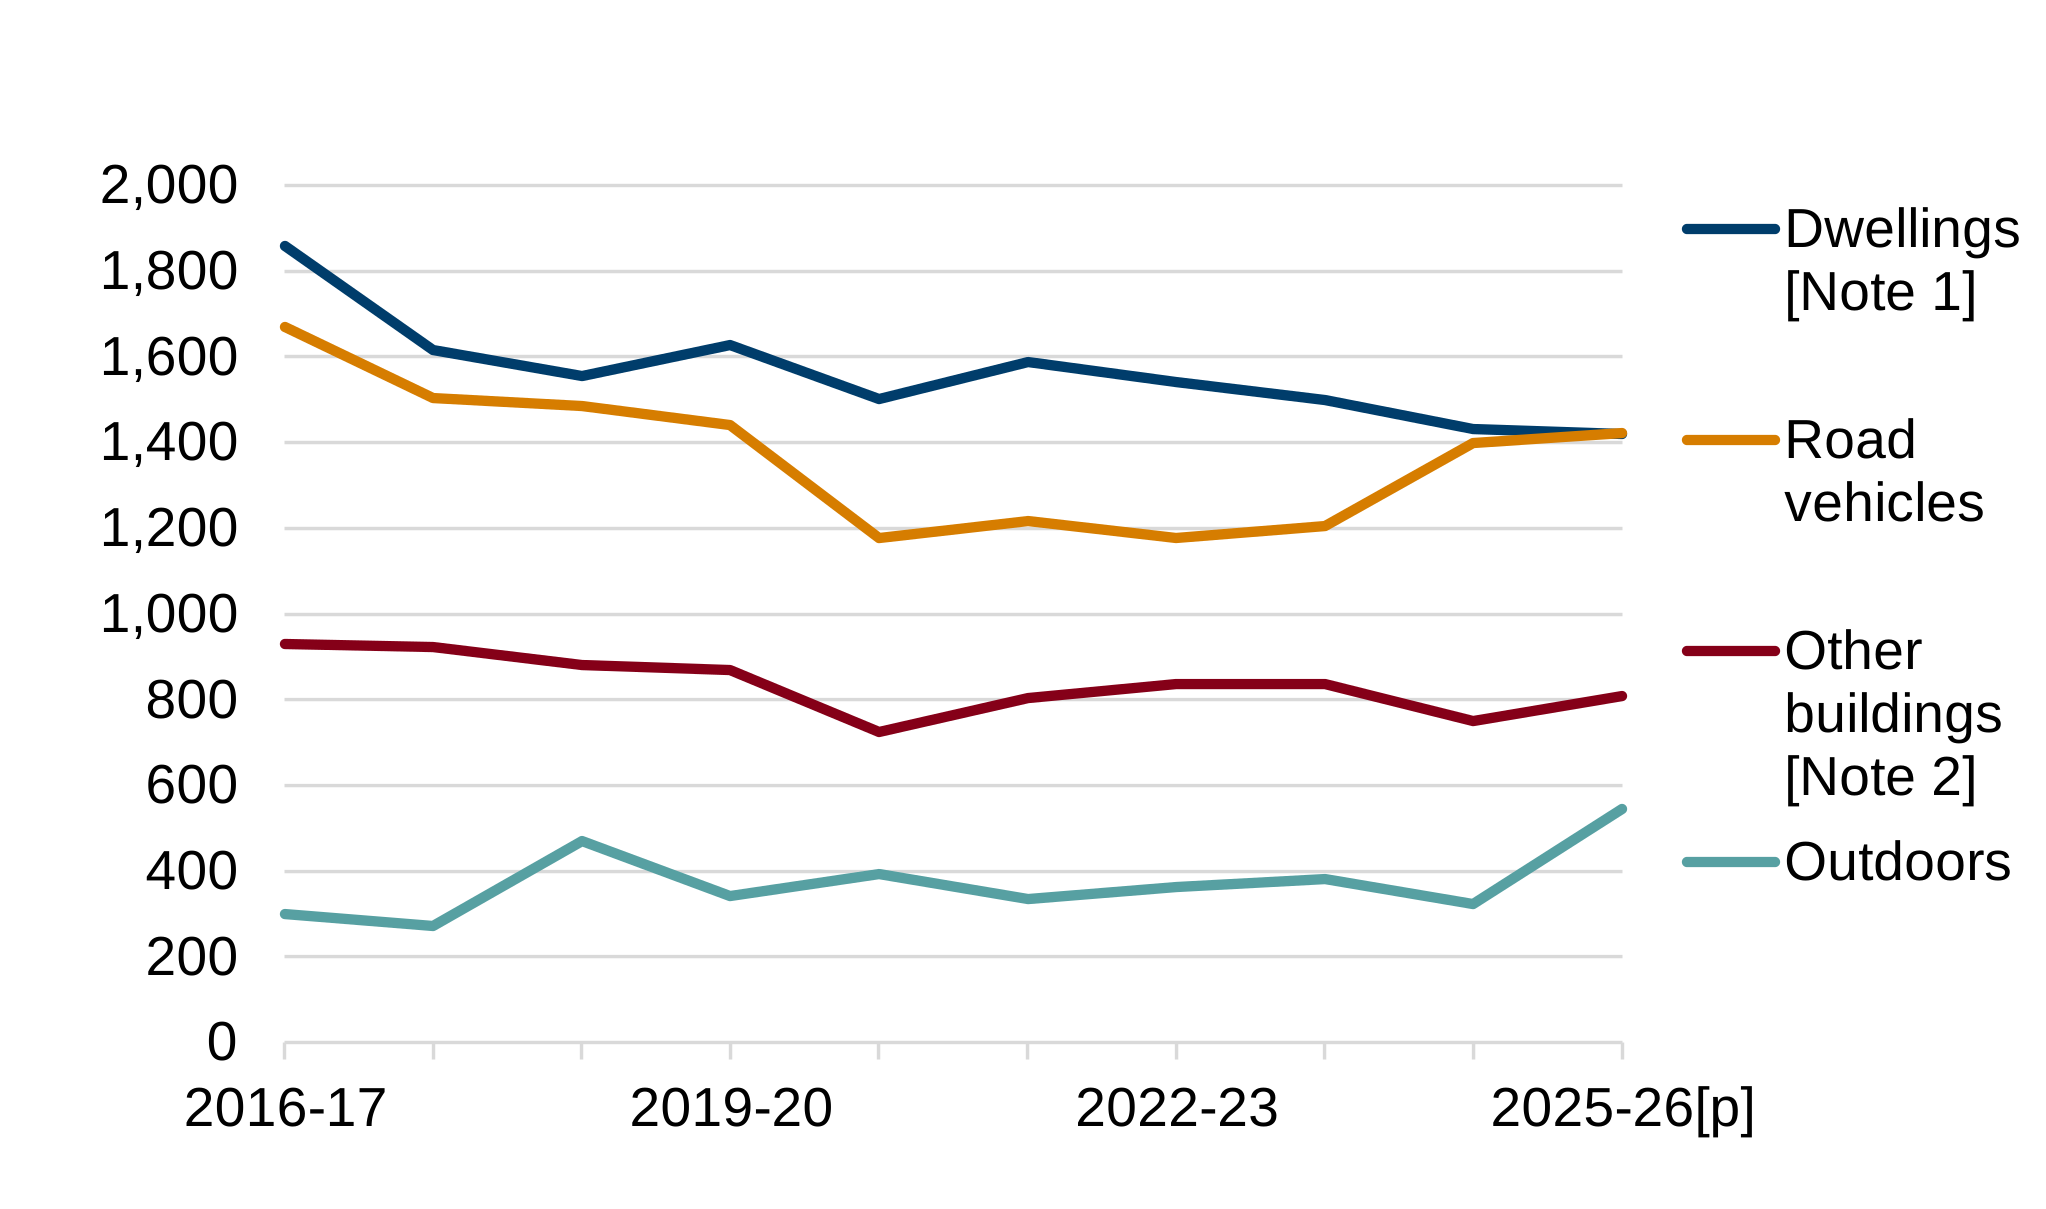
Description of figure 6: a line chart showing the numbers of fires in dwellings, other buildings, road vehicles and other outdoor locations each year from FYE 2017 to FYE 2026. There is a general downward trend for dwelling fires over the period, falling by 24% since FYE 2017. The number of primary fires in road vehicles had seen a notable downward trend until FYE 2021 but numbers rose again starting in FYE 2025. There has been a downward trend in the number of fires in other (non-dwelling) buildings, falling by 13% over the decade. Primary outdoor fires are less common, typically numbering fewer than 400 annually. However, in FYE 2026 there was a rise of 69% (to 546 primary outdoor fires) compared with FYE 2025.
Source: FaRDaP
[Note 1] dwellings include caravans, houseboats and other non-building structures used solely as a permanent dwelling.
[Note 2] Includes other residential and non-residential buildings.
[p] provisional data
In FYE 2026:
- 34% of all primary fires were in dwellings
- 34% were in road vehicles
- 19% were in other buildings
- 13% were outdoor fires
The number of fires in dwellings fell by 1% compared with the previous year, the fourth consecutive annual decrease and the lowest number in the recorded time series. Primary outdoors fires increased from 323 in FYE 2025 to 546 in FYE 2026, a 69% increase. The number of fires in other buildings rose by 8% and the number of fires in road vehicle fires increased by 2% to the highest number since FYE 2020.
Secondary fires
Secondary fires are the most common category of fire attended in Welsh FRAs, accounting for 61% of those attended in FYE 2026. In FYE 2026 numbers of secondary fires rose by 16% compared with FYE 2025, to 6,985 (the highest number of secondary fires since FYE 2019). All 3 FRAs saw increases compared with the previous year; in north Wales numbers rose by 30%, in mid and west Wales by 8% and in south Wales by 16%.
Figure 7: number of secondary fires by FRA, FYE 2017 to FYE 2026[p]
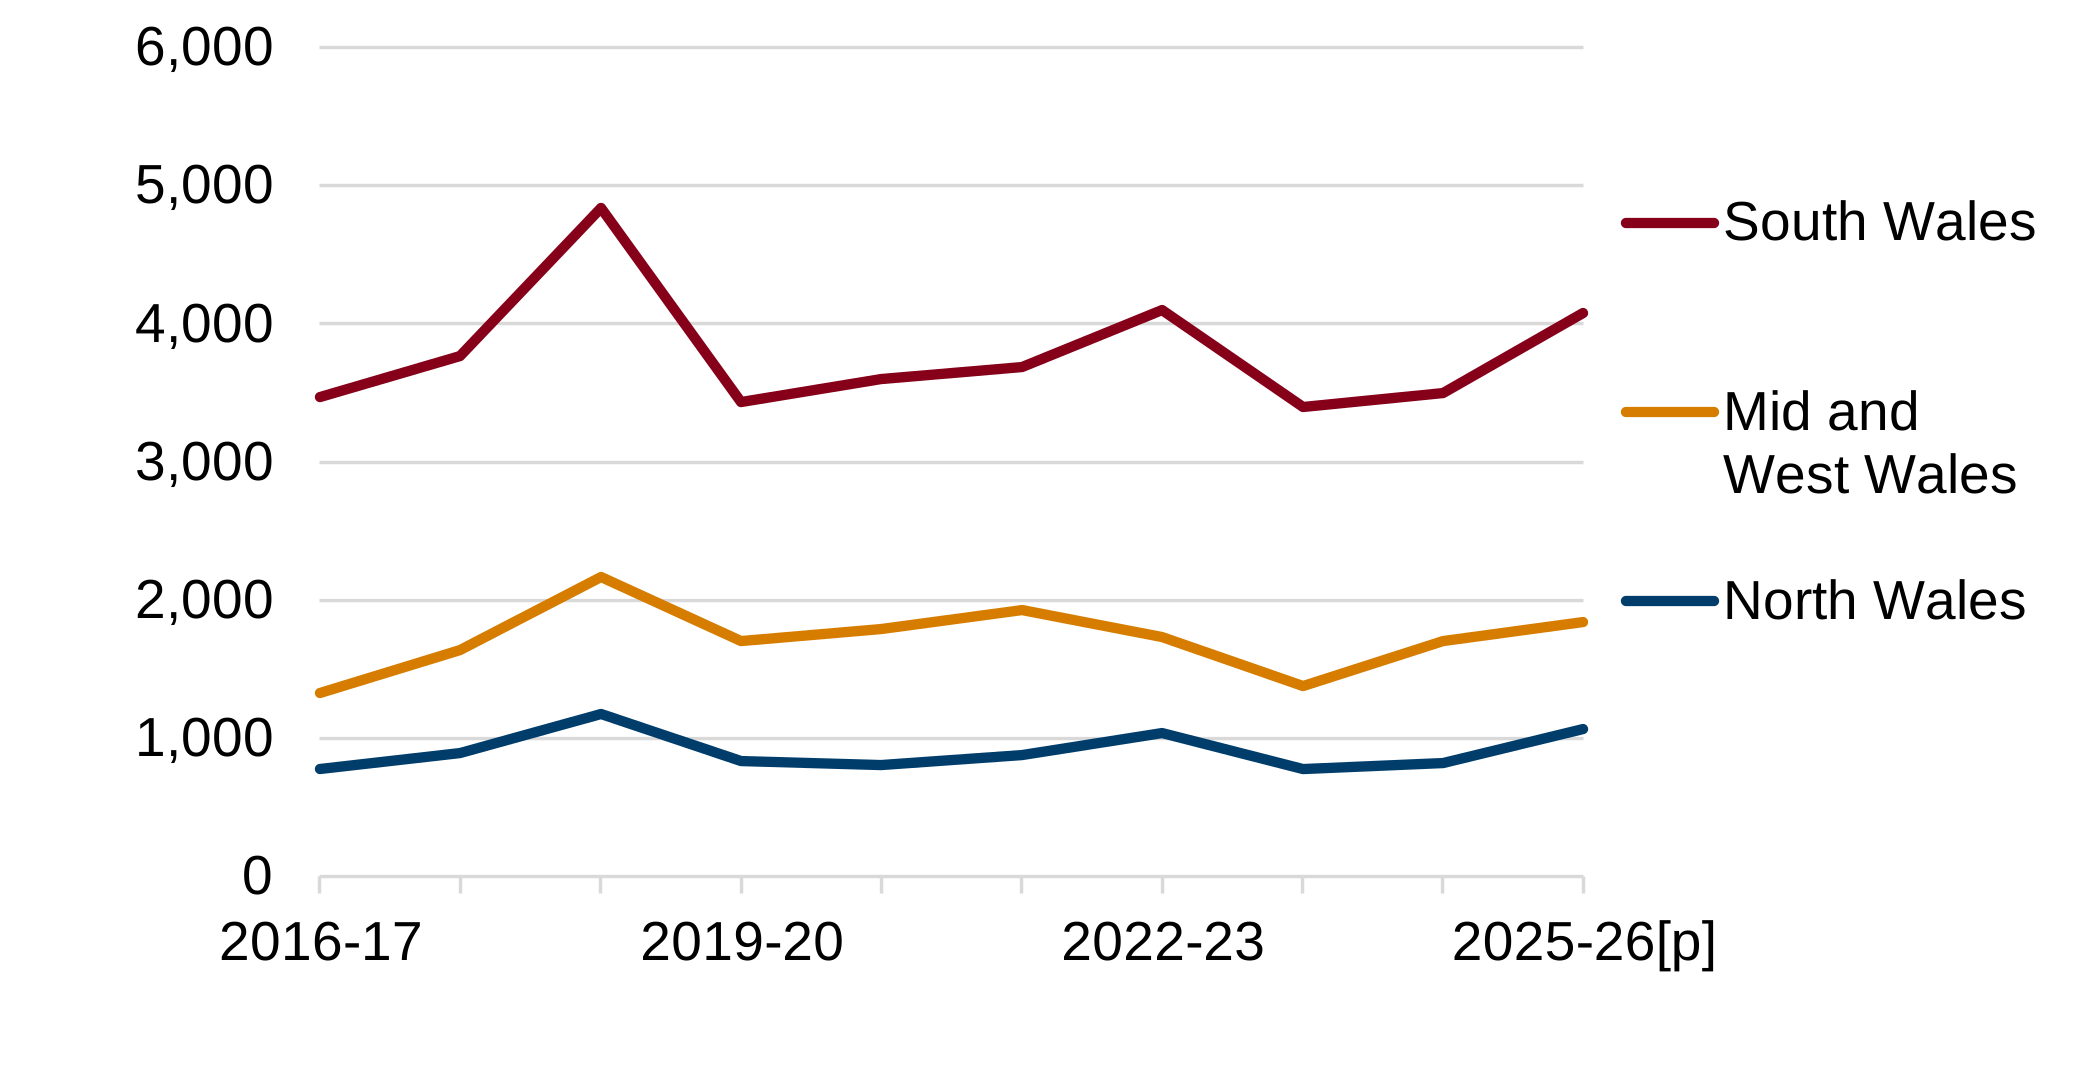
Description of figure 7: a line chart showing the number of secondary fires for each FRA in Wales from FYE 2017. Numbers of secondary fires in all 3 Welsh FRAs saw an increase compared with FYE 2025; by 8% in mid and west Wales, 16% in south Wales and by 30% in north Wales.
Source: FaRDaP
[p] provisional data
In FYE 2026, 57% of secondary fires (3,997 fires) were classed as refuse fires. The number of these fires rose by 1% between FYE 2025 and FYE 2026.
In FYE 2026, 35% of (2,468) secondary fires occurred on grassland, woodland, and/or cropland, an increase of 49% in the number of such fires compared with FYE 2025. This is the highest number of secondary grassland, woodland and crop fires since FYE 2019.
Chimney fires
During FYE 2026, there were 191 chimney fires in Wales, a decrease of 17% compared with FYE 2025. Almost all of these fires (97%) occurred in dwellings.
All 3 FRAs saw decreases in chimney fires compared with the previous year, of 2% in mid and west Wales, 24% in north Wales whilst south Wales saw a decrease of 39%.
Fires by motive
In FYE 2026, there were 4,929 accidental fires (including accidental chimney fires) an increase of 15% compared with the previous year. Accidental fires accounted for 43% of all fires, 71% of all primary fires and 25% of secondary fires in FYE 2026.
There were 6,444 deliberate fires in FYE 2026, a rise of 10% compared with FYE 2025; 81% of deliberate fires in FYE 2026 were secondary fires.
Figure 8: number of fires by type and motive, FYE 2017 to FYE 2026[p]
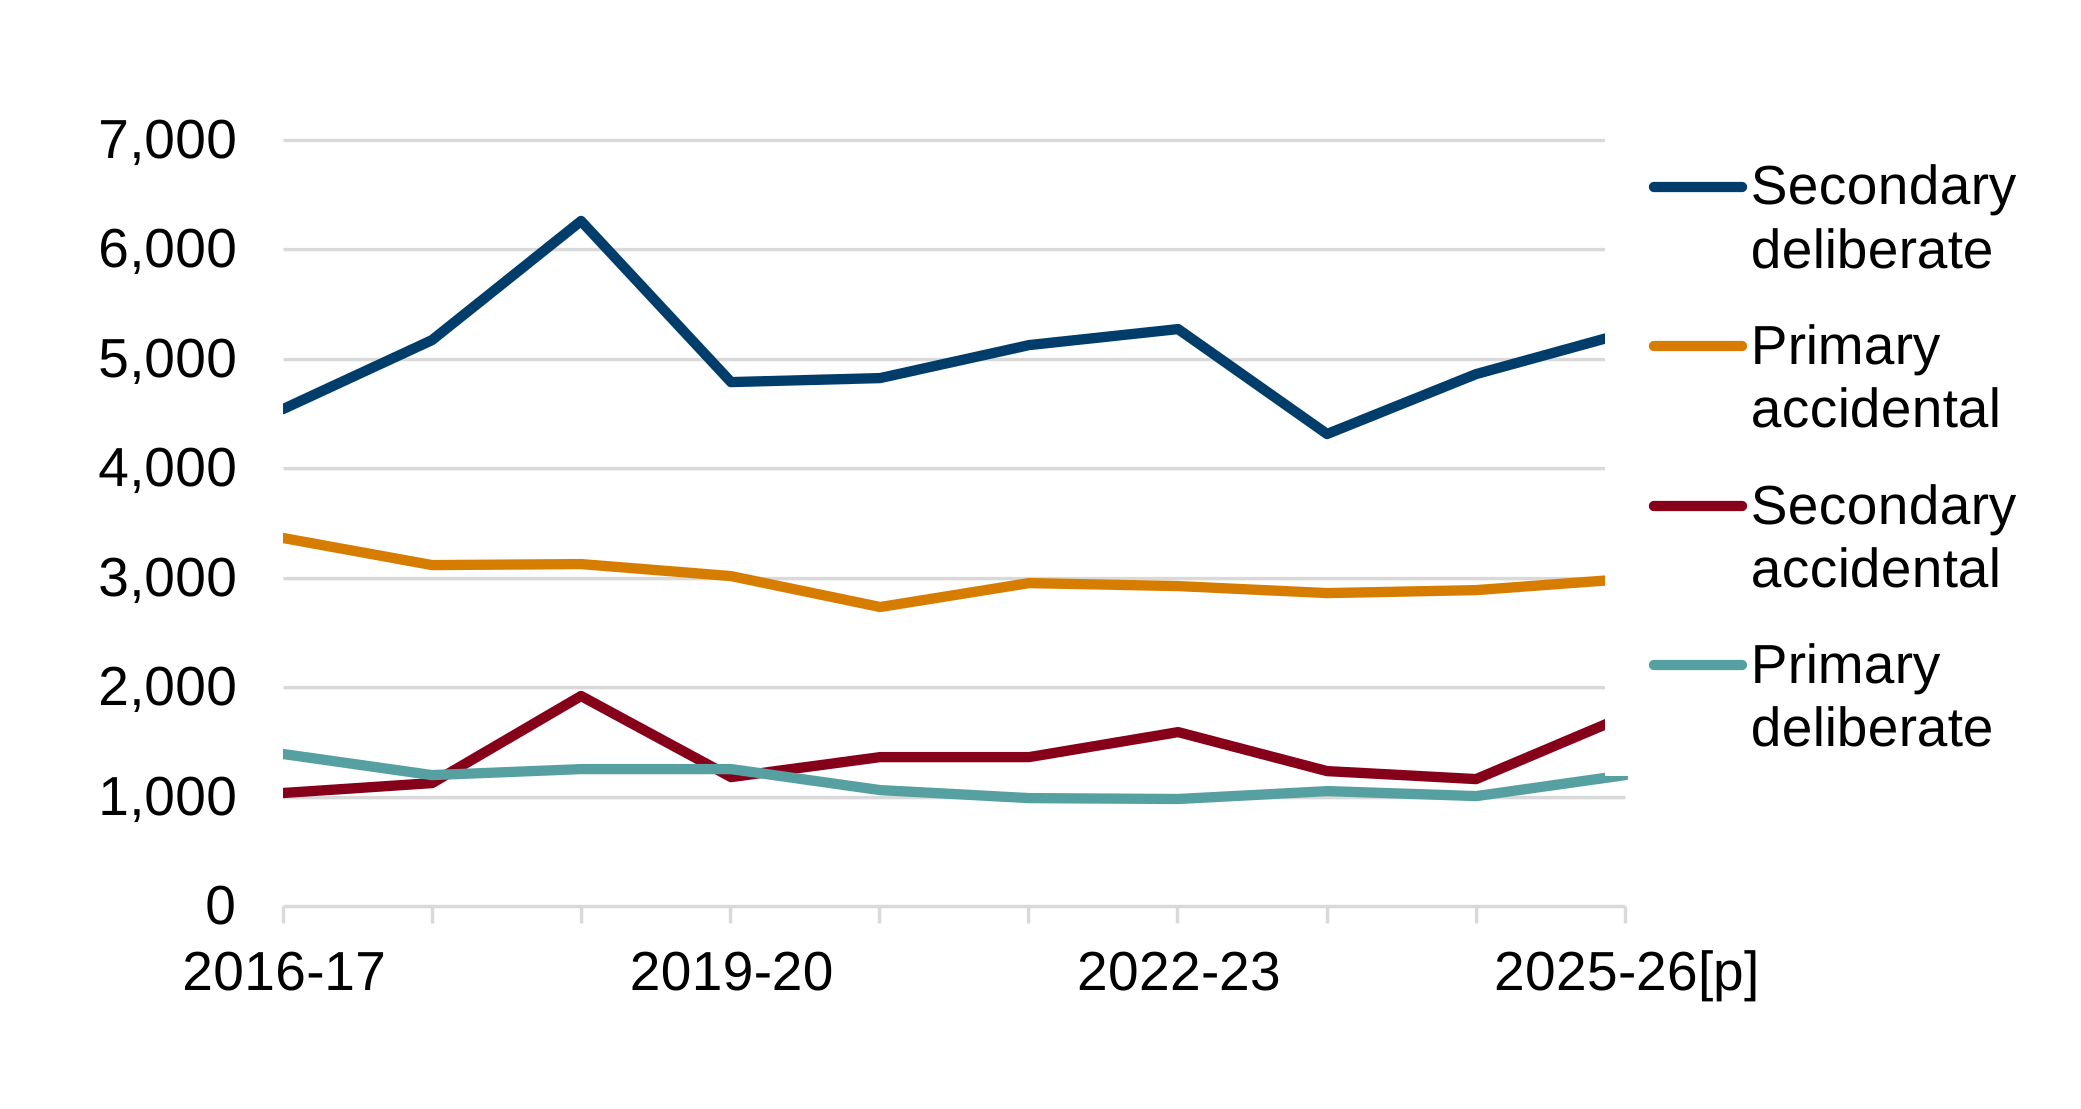
Description of figure 8: a line chart showing numbers of primary and secondary fires by motive (accidental or deliberate) in a time series from FYE 2017. The chart shows that numbers of both deliberate secondary and accidental secondary fires are the most prone to fluctuation. Numbers of primary fires are more stable.
Source: FaRDaP
[p] provisional data
In FYE 2026 the number of accidental primary fires increased by 4% whilst the number of accidental secondary fires increased by 49% (compared with FYE 2025).
Numbers of primary deliberate fires rose by 19%, whilst secondary deliberate fires increased 8%.
Fire-related fatalities and casualties
Fatal fire casualties
A fatal casualty is defined as a person whose death is the direct or indirect result of injuries caused by a fire incident, even if the death occurred weeks or months later. Non fire related fatalities are excluded from these figures.
There were 15 fatal casualties during FYE 2026, 1 fewer than in the previous year. Numbers of fire fatalities are small and prone to fluctuation and over the past decade have numbered between 15 and 21.
Figure 9: number of fatal casualties from fires by motive, FYE 2017 to FYE 2026[p]
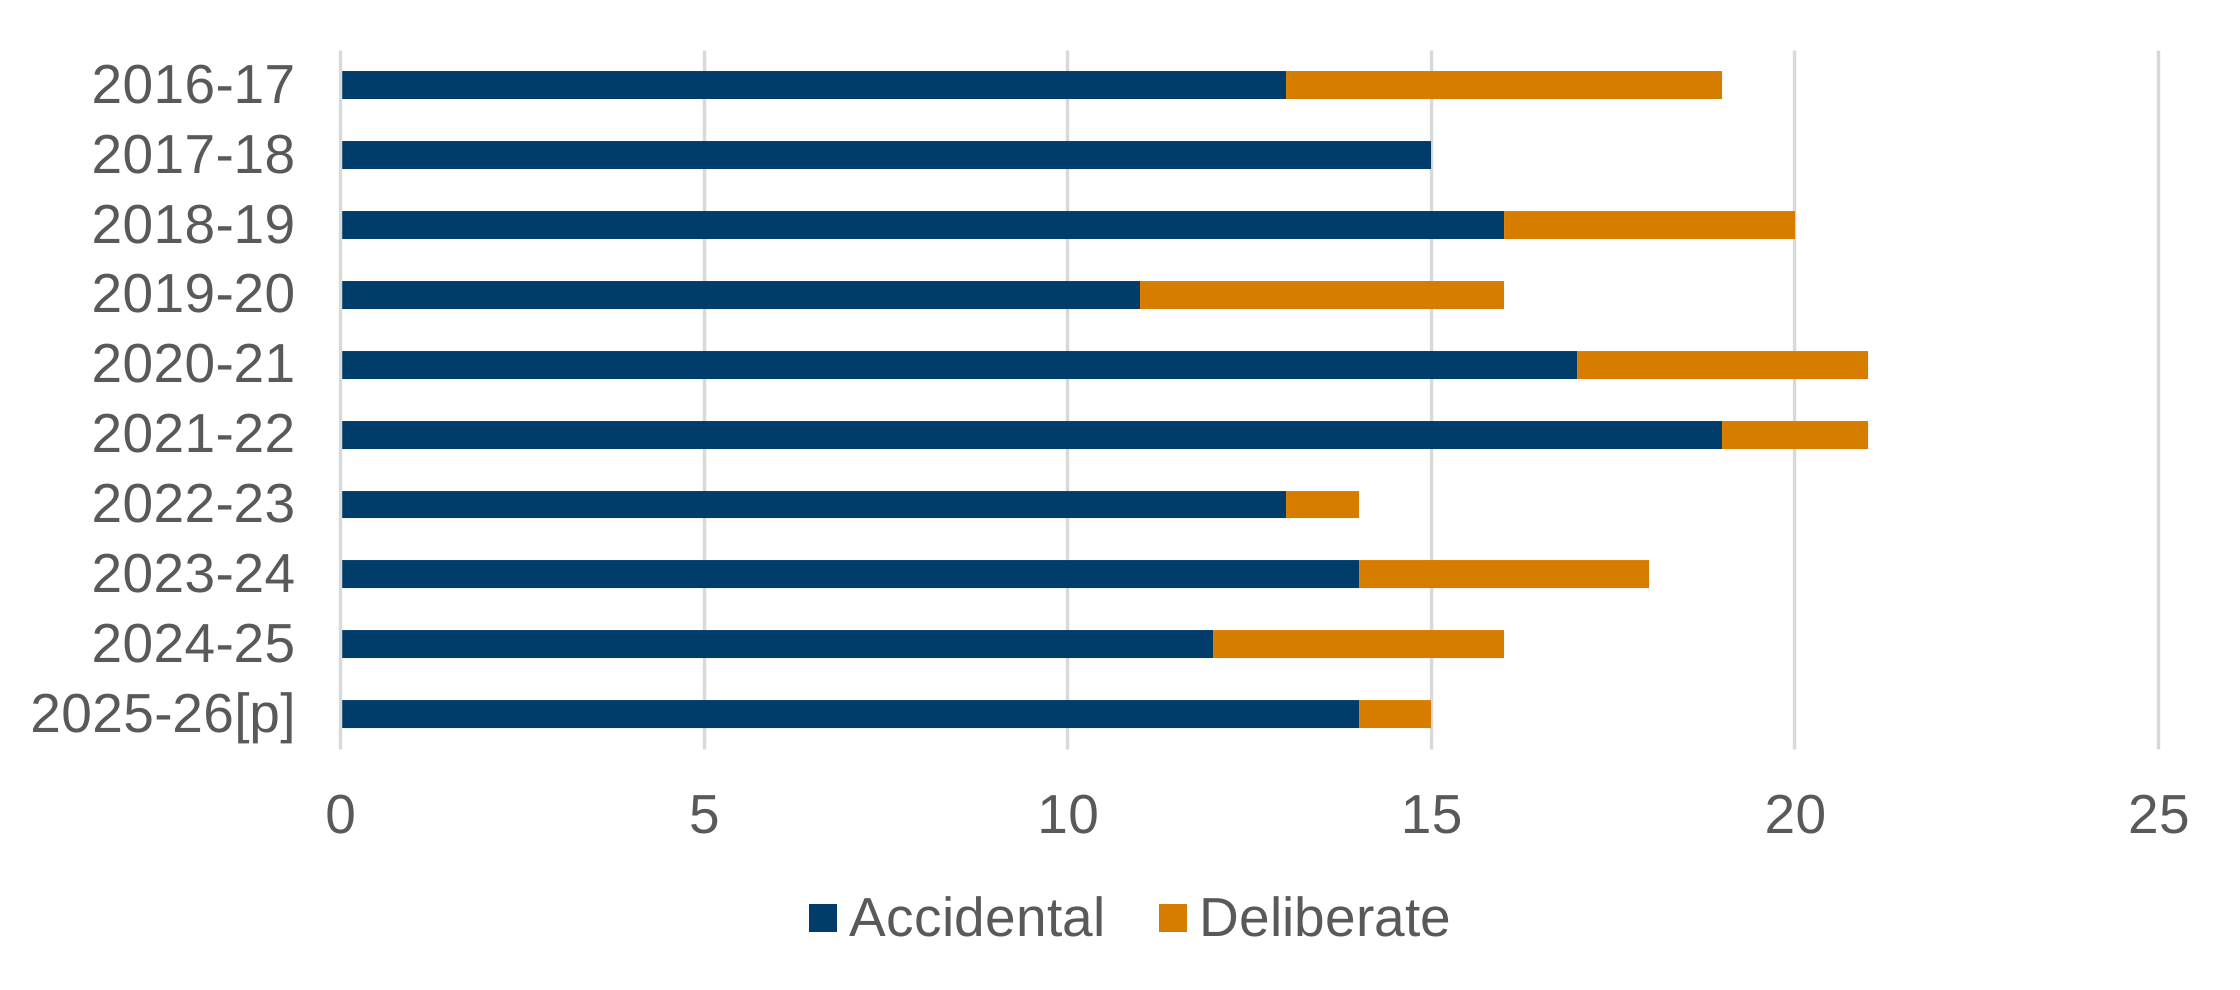
Description of figure 9: a bar chart showing numbers of fatal casualties from fires attended in Welsh FRAs by motive (accidental or deliberate) from FYE 2017 to FYE 2026. The chart shows the majority of fatal casualties occur in accidental fires.
Source: FaRDaP
[p] provisional data
Since FYE 2017, 79% of fatal casualties have occurred in dwelling fires, equating to a total of 138 out of 175 fatal casualties. In FYE 2026, 87% of fatal casualties were the result of dwelling fires.
Non-fatal fire casualties
From April 2009 non-fatal casualties are recorded as being in one of 4 classes of severity as follows:
- victim went to hospital, injuries appear to be serious
- victim went to hospital, injuries appear to be slight
- first aid given at scene
- precautionary check recommended (this is when an individual is sent to hospital or advised to see a doctor as a precaution, having no obvious injury or distress)
In FYE 2026 there were 464 non-fatal casualties, a rise of 19% compared with FYE 2025 and is the highest number since FYE 2022. The overall trend over the last ten years has been downward, although the numbers have fluctuated.
Those receiving first aid or sent for precautionary checks rose by 31% and numbers of those sent to hospital with serious injuries rose by 11%; numbers of those sent to hospital with slight injuries saw no percentage change. In FYE 2026, 64% of non-fatal casualties received first aid or were advised to have a precautionary check-up. A further 27% of non-fatal casualties were taken to hospital with slight injuries and the remaining 9% were taken to hospital with severe injuries.
Figure 10: number of non-fatal casualties from fires by severity of injury, FYE 2017 to FYE 2026[p]
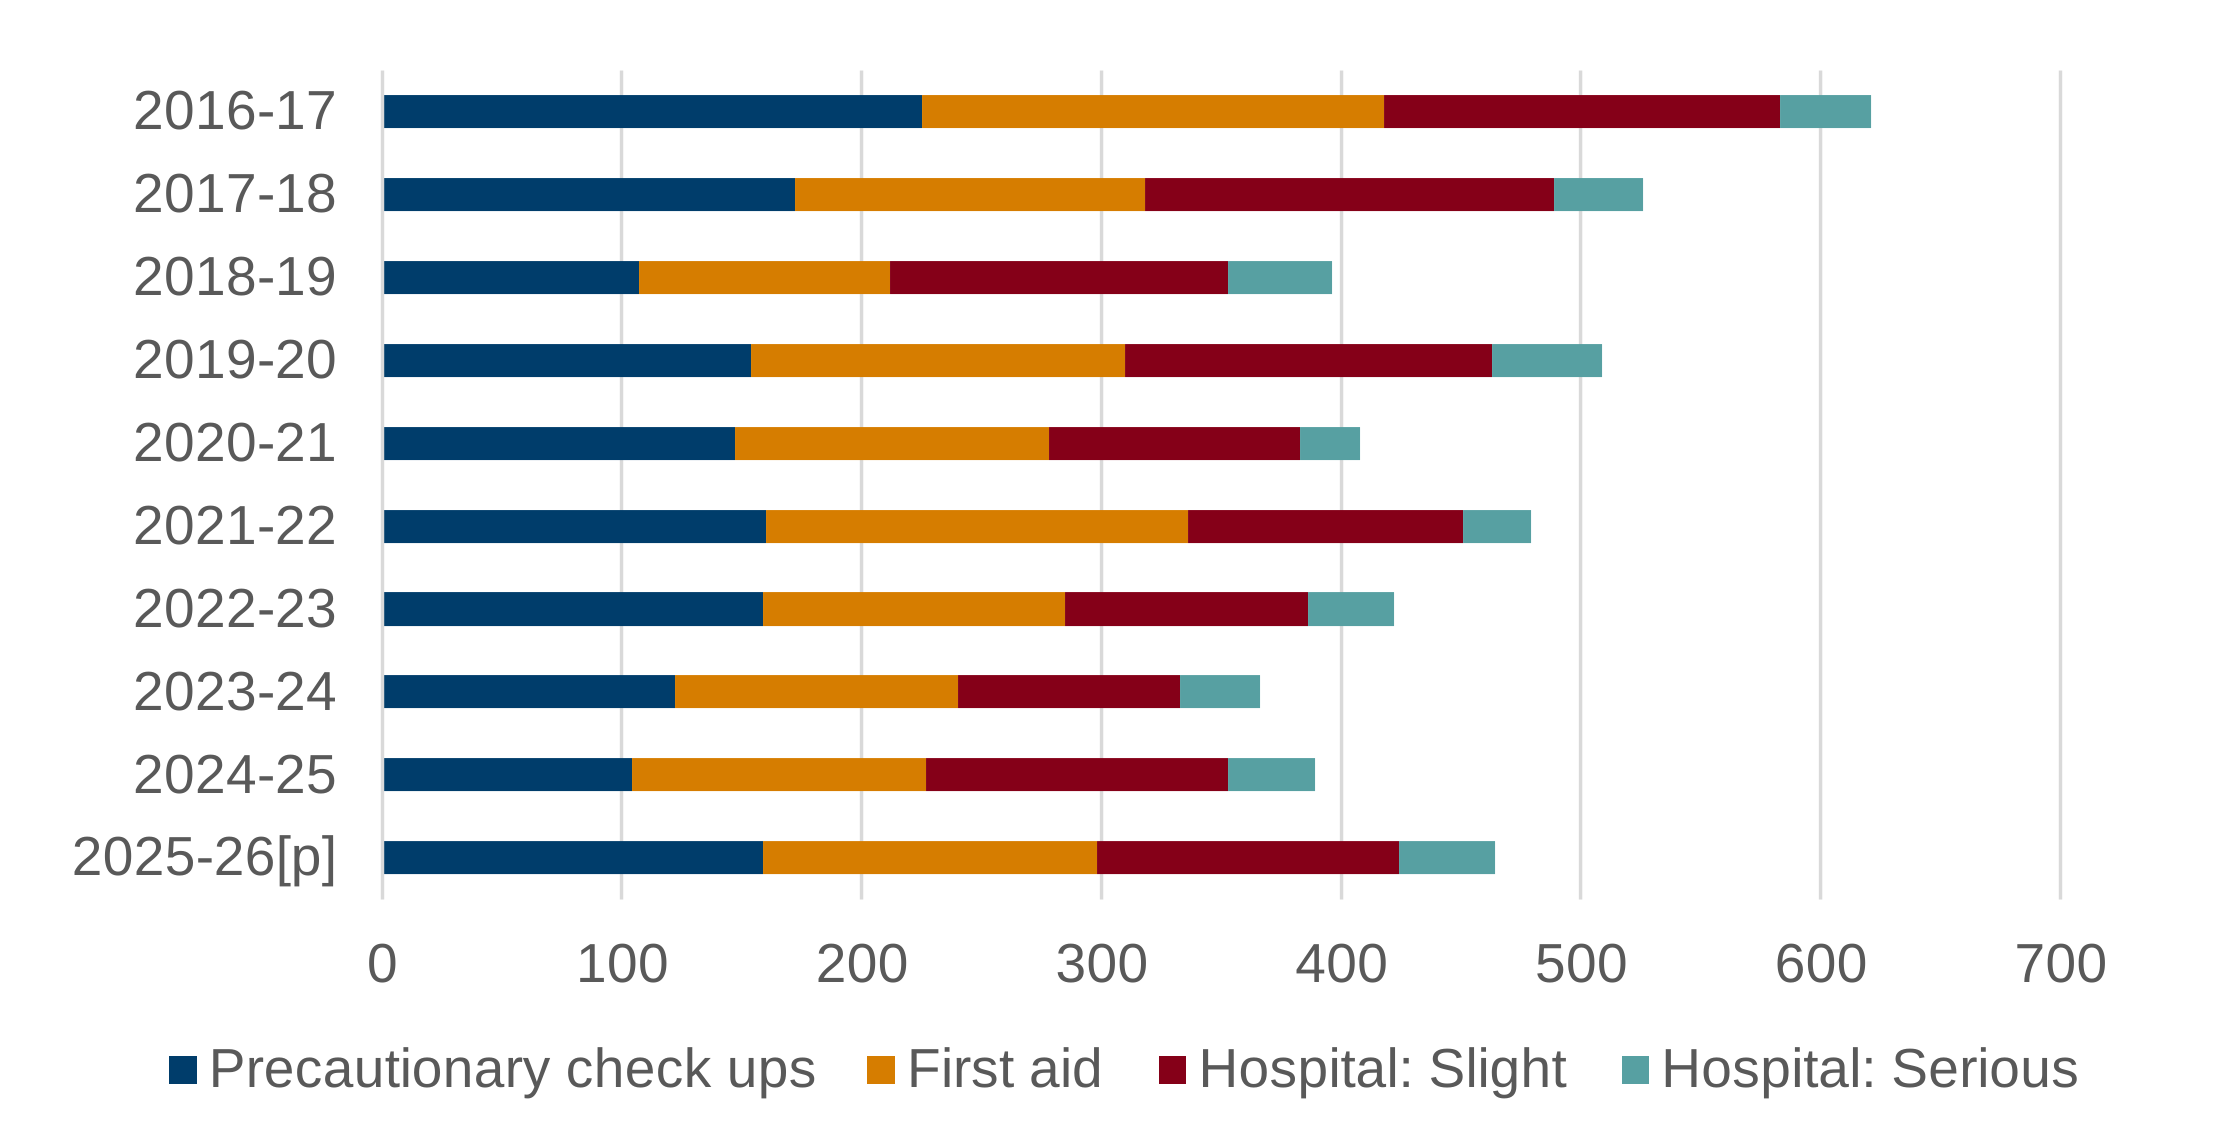
Description of figure 10: a bar chart showing the number of non-fatal casualties from fires by severity of injury. Data relates to FYE 2017 to FYE 2026. The chart shows a general downward trend, although there have been increases for the past 2 financial years.
Source: FaRDaP
[p] provisional data
Fire false alarms
A fire false alarm is defined as an event in which the FRS was called to a reported fire which turned out not to exist.
Fire false alarm categories
Fire false alarms fall into 3 categories, these are:
- malicious, where the call is deliberately for a non-existent fire-related event
- good intent, in which the call was made in good faith in the belief that there was a fire to attend
- due to apparatus, in which the call was initiated by the operation of fire alarm and fire-fighting equipment
In FYE 2026 there were 14,656 fire false alarms in Wales, down from 16,966 in FYE 2025, a decrease of 14%. This is the second consecutive annual fall and the lowest number since FYE 2020.
Only numbers of good intent fire false alarms rose in FYE 2026 compared with FYE 2025 (up 10%). False alarms due to apparatus fell by 28% whilst numbers of malicious fire false alarms decreased by 27%.
Figure 11: number of fire false alarms by reason, FYE 2017 to FYE 2026[p]
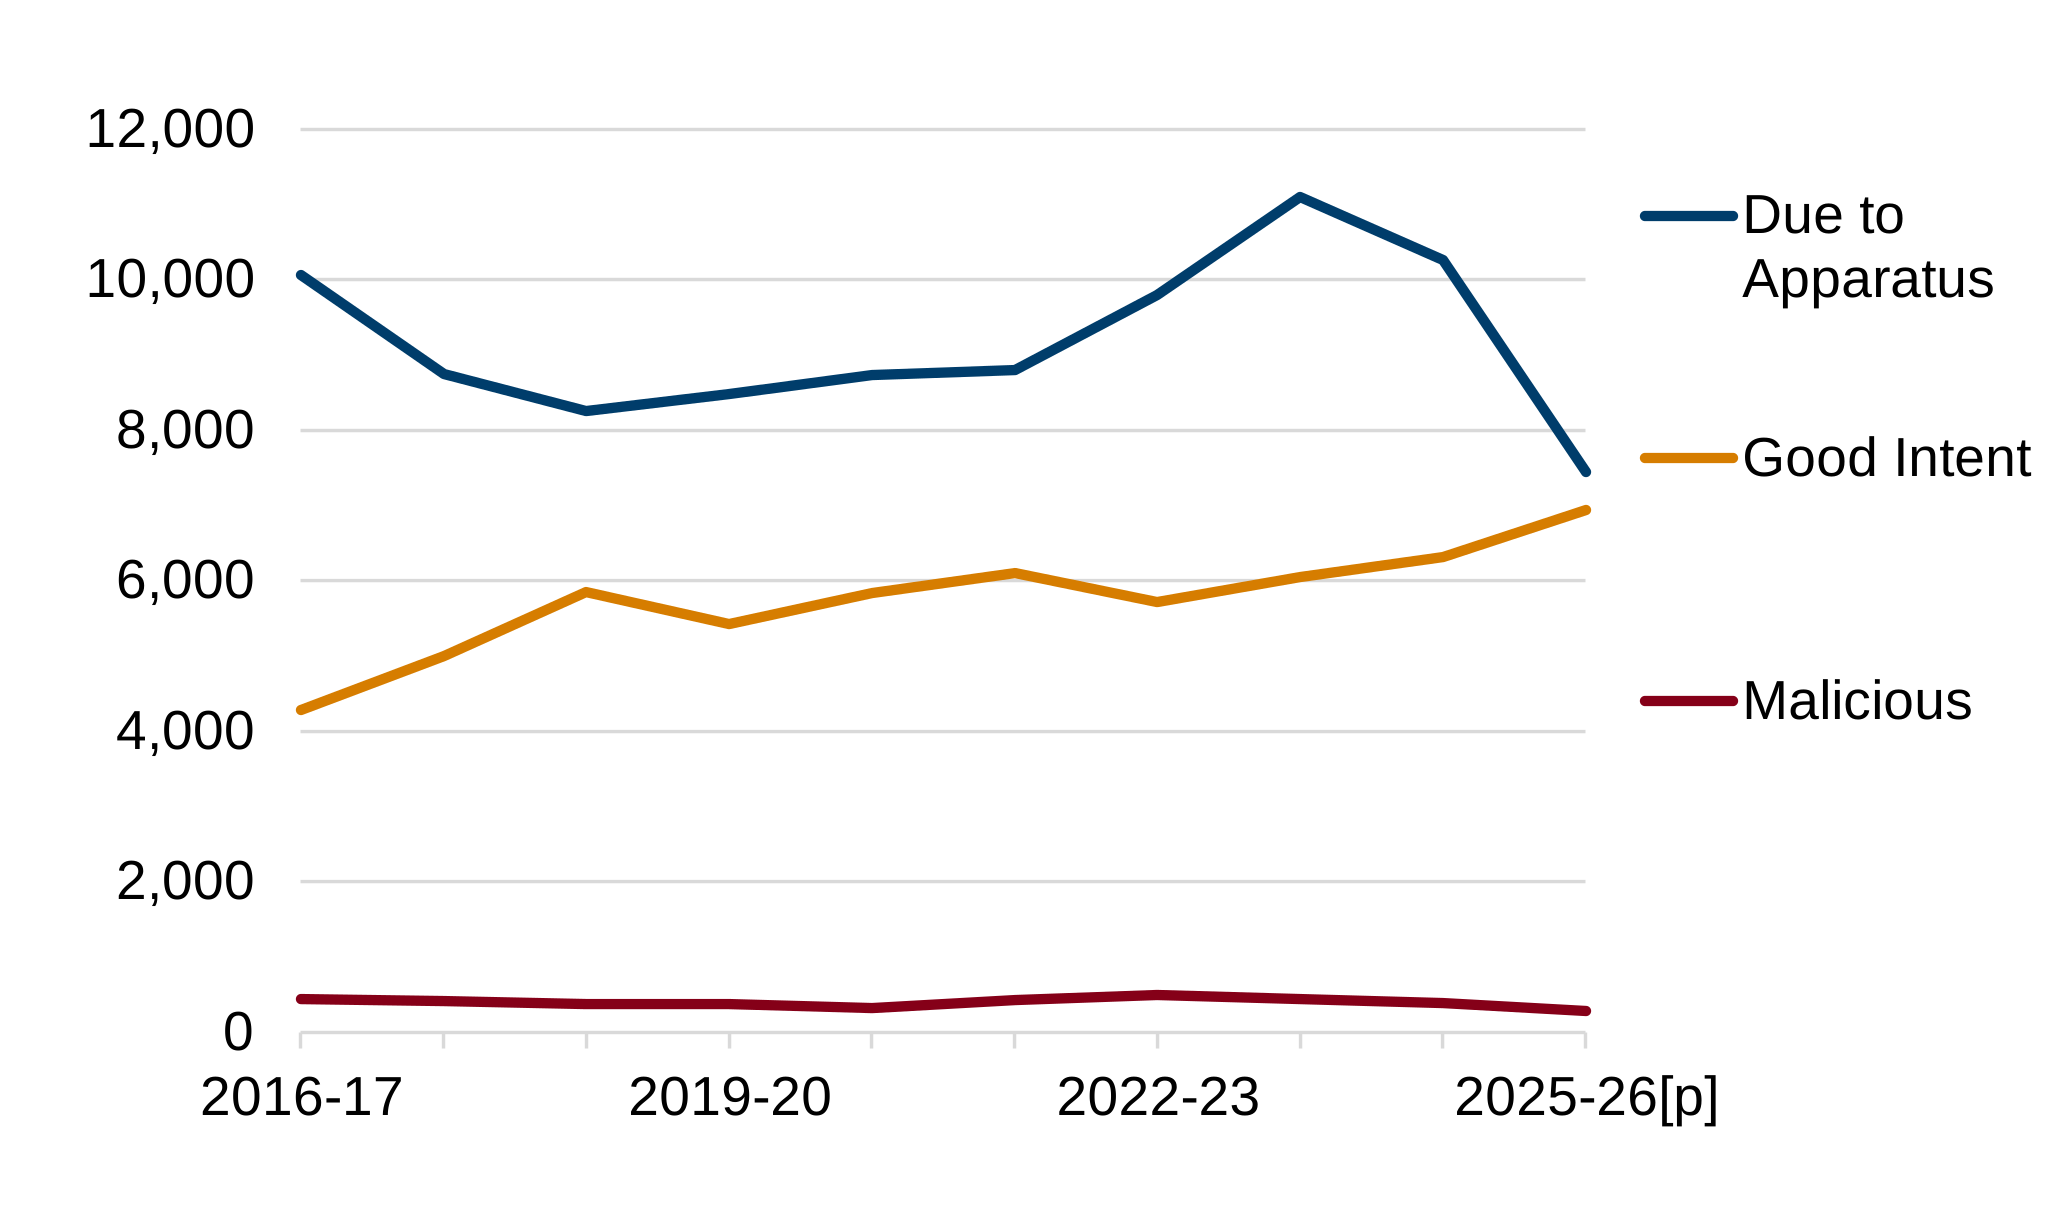
Description of figure 11: a line chart showing numbers of false alarms, by type (malicious, due to apparatus or due to good intent). The chart shows most fire false alarms are due to apparatus, although in FYE 2026 false alarms due to good intent were similar in volume. The number of good intent fire false alarms has seen a general upward trend and the FYE 2026 number (6,935) is the highest in the recorded time series. Numbers of malicious fire false alarms have seen downward trend over the recorded time series and the FYE 2026 figure (283) is the lowest in the time series.
Source: FaRDaP
[p] provisional data
[r] revised data
Special Service Incidents (SSIs)
In FYE 2026, there were 10,983 SSIs attended in Welsh FRAs (including SSI false alarms), 30% of all incidents attended. These incidents include road traffic collisions, flooding incidents, medical incidents and so on. Unlike other incident types, overall numbers of SSIs haven’t seen a consistent downward trend and are prone to fluctuation.
Figure 12: number of SSIs attended by FRA, FYE 2017 to FYE 2026[p][Note 1]
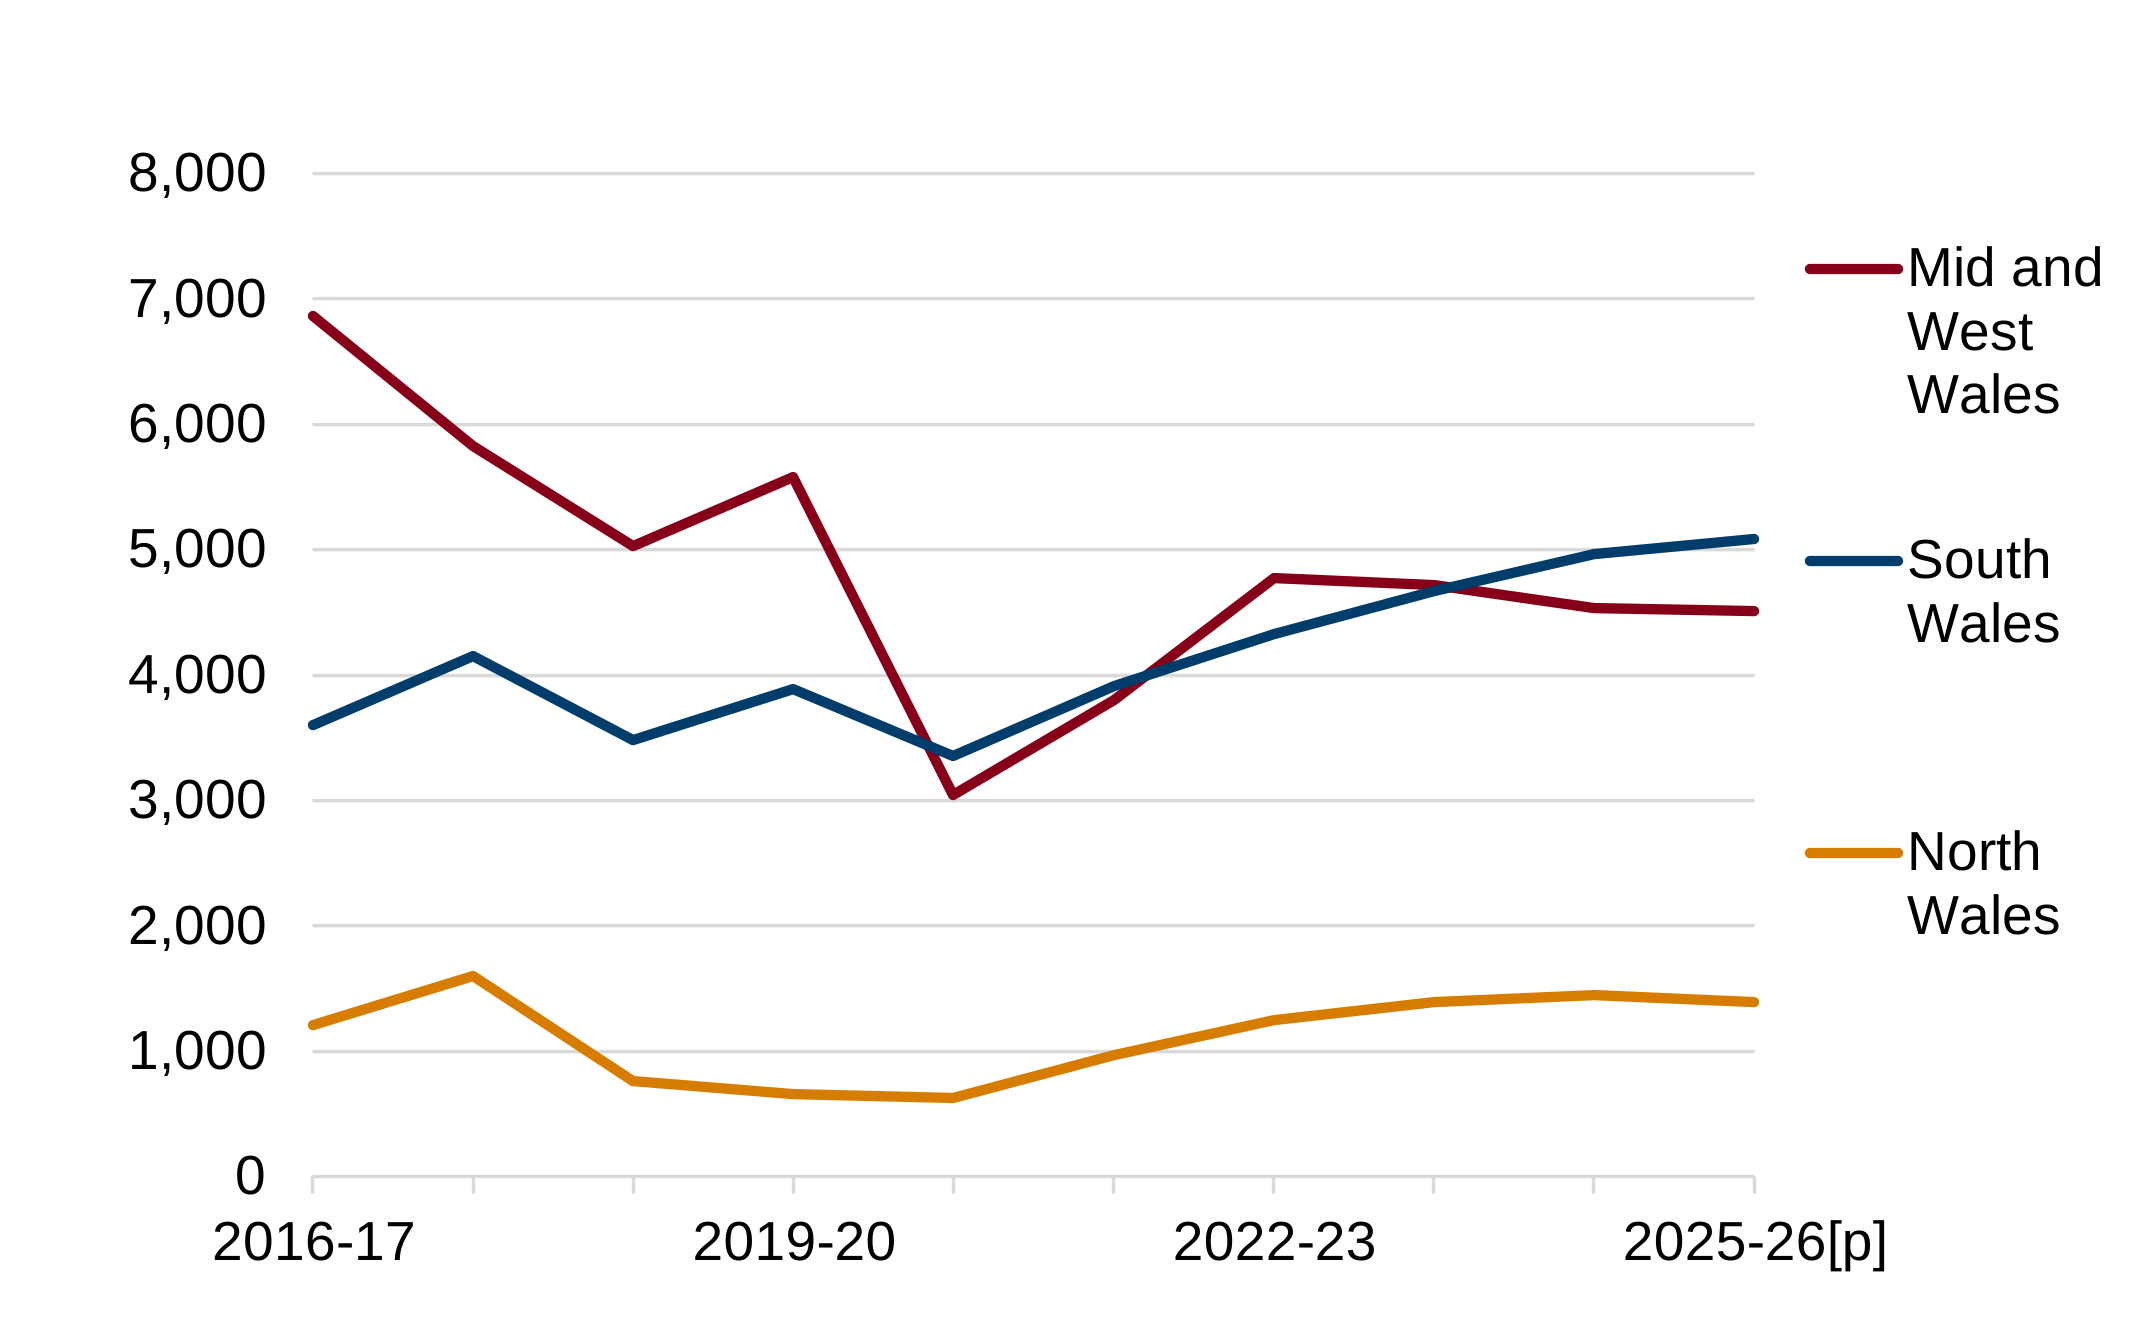
Description of figure 12: a line chart showing numbers of SSIs (including SSI false alarms), by FRA from FYE 2017. The chart shows throughout the time series that the fewest SSIs are attended in north Wales and since FYE 2021 mid and west Wales and south Wales have had similar numbers of SSI attendances. Numbers of SSIs fell sharply at the height of the coronavirus (COVID-19) pandemic in FYE 2021, particularly in mid and west Wales but have since risen to pre-pandemic levels.
Source: FaRDaP
[Note 1] Includes SSI false alarms.
[p] provisional data
Overall attendance at SSIs saw no percentage change in FYE 2026 compared with FYE 2025; attendances at SSIs fell by 4% in north Wales and rose by 2% in south Wales; in mid and west Wales there was no percentage change in numbers of SSIs.
Glossary
Accidental fires
Includes those where the fire was ignited by accident or the cause was not known or unspecified.
Buildings
Defined as all buildings including those under construction, but excluding derelict buildings, or those under demolition. Prior to 1994 ‘buildings’ were referred to as ‘occupied buildings’.
Cause of fire
The defect, act or omission leading to ignition of the fire.
Chimney fires
Reportable fires in occupied buildings where the fire was confined within the chimney structure and did not involve casualties or rescues or are attended by 5 or more appliances.
Deliberate fires
Include those where deliberate ignition is merely suspected.
Dwellings
Defined as buildings occupied by households, excluding hotels, hostels and residential institutions. From 1988, mobile homes have been specifically included in the dwelling count. In 2000, the definition of a dwelling was widened to include any non-permanent structures used solely as a dwelling, such as houseboats. All analyses from 1994 to 1998 relating to dwellings were retrospectively revised to include the new categories of dwellings.
False alarms
Events in which the Fire and Rescue Authority was called to a reported fire which turned out not to exist. False alarms are categorised as follows.
Malicious false alarms
Calls made with the intention of getting the fire and rescue service to attend a non-existent fire-related event, including deliberate and suspected malicious intentions.
Good intent false alarms
Calls made in good faith in the belief that the fire and rescue service really would attend a fire.
False alarms due to apparatus
Calls initiated by fire alarm and fire-fighting equipment operating (including accidental initiation of alarm apparatus by persons).
Fatal casualty (fire related)
A person whose death is attributed to a fire even if the death occurred weeks or months later. There are also occasional cases where it becomes apparent subsequently that fire was not the cause of death. The figures for fatalities are thus subject to revision.
Fire Data Reports (FDR1 and FDR3)
The method of data collection via paper forms prior to the Incident Recording System (introduced in April 2009). FDR1 was used to record primary fires, FDR3 for secondary fires, chimney fires and false alarms.
Fire and Rescue Servies (FRSs)
The operational organisations that delivers services. They employ firefighters, operate fire stations and appliances, respond to emergencies, carry out fire prevention work, and enforce fire safety legislation.
Fire and Rescue Authorities (FRAs)
The statutory bodies which oversee the policy and service delivery of a fire and rescue service. The 3 authorities in Wales are:
- North Wales
- Mid and west Wales
- South Wales
Heat or smoke damage only incidents
Reportable fires where there is no flame damage. The damage reported may be due to any combination of heat, smoke and other which will include any water damage.
Incident Recording System (IRS)
The electronic based system for recording fires, false alarms and Special Service Incidents. IRS replaced the FDR1 and FDR3 paper forms in April 2009.
Late fire call
A fire known to be extinguished when the call was made (or to which no call was made, for example, a fire which comes to the attention of the FRS) and which the FRS attended.
Location
The type of premises, property or countryside in which the fire started. This is not necessarily the type of premises in which most casualties or damage occurred as a result of the fire.
Non-fatal casualties
Recorded as being in one of four classes of severity as follows:
- victim went to hospital, injuries appear to be serious
- victim went to hospital, injuries appear to be slight
- first aid given at scene
- precautionary check recommended – this is when an individual is sent to hospital or advised to see a doctor as a precaution, having no obvious injury or distress
Non-fatal casualties marked as 'not fire-related' have not been excluded due to widespread inappropriate use of this field.
Primary fires
Includes all reportable fires in non-derelict buildings, vehicles and outdoor structures or any fire involving casualties, rescues, or fires attended by 5 or more appliances.
Reportable fire
An event of uncontrolled burning involving flames, heat or smoke and which the fire and rescue authority attended.
Secondary fires
The majority of outdoor fires including grassland and refuse fires unless they involve casualties or rescues, property loss or 5 or more appliances attend. They include fires in single derelict buildings. They are reported in less detail than other fires and consequently less information concerning them is available.
Source of ignition
The source of the flame, spark or heat that started the fire.
Special Service Incidents (SSIs)
Non-fire incidents which require the attendance of an appliance or officer and include:
- local emergencies, for example:
- road traffic incidents
- rescue of persons
- 'making safe'
- major disasters
- domestic incidents, for example water leaks, persons locked in or out
- prior arrangements to attend incidents, which may include some provision of advice and inspections
Where more than one activity is carried out, the incident is recorded under the most resource intensive part or what was the most appropriate. For example, a railway incident with persons trapped is likely to be recorded under ‘railway accident’ even though the FRS may be involved in ‘first aid’, ‘other rescue’ and possibly ‘making safe’.
Quality and methodology information
General information relating to data quality for fire and rescue incidents, operational fire data and FRA performance data can be found in the Quality report.
Background
The analysis in this bulletin relates to fire and rescue service incidents between April 2025 and end March 2026 whilst making comparisons with April 2024 to March 2025 and earlier years.
On 10 November 2004 the Fire and Rescue Services Act 2004, which devolved fire and rescue services to the National Assembly for Wales (now the responsibility of the Welsh Government), was brought into effect. In Wales, these services are provided by 3 FRAs. The 3 FRAs cover varied geographical areas with a wide variety of risks including:
- fires in homes
- outdoor fires
- fires in business premises
- road traffic collisions
- rail or air crashes
- chemical spills
- building collapses
- trapped people or animals
North Wales Fire and Rescue Authority provides cover for a population of almost 700,000 across a geographical area of 2,400 square miles. It employs over 900 operational and non-operational support staff from its headquarters and its 44 fire stations.
Mid and West Wales Fire and Rescue Authority covers over half the area of Wales and a population of over 900,000. There are 58 fire stations and almost 1,400 employees.
South Wales Fire and Rescue Authority serves a population of almost 1.6 million people covering 1,085 square miles. It employs more than 1,700 staff including over 1,400 fire-fighters who operate from 47 fire stations throughout south Wales.
Fire safety initiatives
The FRSs in Wales have a number of ongoing fire safety campaigns and community fire safety work (such as home safety checks and school visits) as detailed on their respective webpages:
- North Wales Fire and Rescue Service
- Mid and West Wales Fire and Rescue Service
- South Wales Fire and Rescue Service
These may be a contributory factor in the overall falling numbers of fires although no all-Wales evidence is currently available.
Over the years there have been a number of national programmes for dealing with deliberate fires. The Wales Arson Reduction Strategy (WARS) (North Wales Fire and Rescue Service) first reported in 2007, with a review in 2009, and updated strategies for 2012 to 2015 and most recently 2019. A delivery plan from WARS III resulted in a multi-agency taskforce ‘Operation Dawns Glaw’ being established in 2015 and aiming to reduce the number of deliberate grassland fires.
In April 2015 North Wales FRA introduced a new strategy which meant they didn’t automatically attend Automatic Fire Alarm Systems (AFA) in non-domestic properties. This led to a 78% drop in false alarms due to apparatus in ‘other buildings’ (non-dwellings) being attended in North Wales FRA in FYE 2016 (when compared to the previous year). Following this, numbers have fluctuated.
In November 2011, a new EU directive required cigarettes to meet a reduced ignition propensity (RIP) requirement, they are now manufactured to be self-extinguishable, reducing the chance that they should set fire to combustible materials. However, we are not able to determine how many of the fires ignited by “smokers’ materials” are related to cigarettes.
Response times
Response time data only reflect part of the process of fighting a fire, not the outcome of doing so, and so may not be a reliable measure of the performance of an FRA or the effectiveness of a firefighting response.
GB comparisons
Data for England (published by the Home Office from April 2016 until March 2025 and the Ministry for Housing, Communities and Local Government from April 2025)
- Detailed analysis of fires attended by fire and rescue services in England (Ministry for Housing, Communities and Local Government)
- Fire and rescue incident statistics (Ministry for Housing, Communities and Local Government)
Data for Scotland (published by Scottish Fire and Rescue Service since 2015)
- Fire and Rescue Incident Statistics 2024-25 (Scottish Fire and Rescue Service)
- Pre FYE 2015 data (Scottish Government)
Data for Northern Ireland
Limited Northern Ireland data are available in an annual report from Northern Ireland Fire and Rescue Service.
Official statistics status
All official statistics should show the standards of the Code of Practice for Statistic (UK Statistics Authority).
These are accredited official statistics. They were independently reviewed by the Office for Statistics Regulation (OSR) in June 2012. They comply with the standards of trustworthiness, quality and value in the Code of Practice for Statistics.
It is Welsh Government’s responsibility to maintain compliance with the standards expected of accreditation. If we become concerned about whether these statistics are still meeting the appropriate standards, we will discuss any concerns with OSR promptly. Accreditation can be cancelled or suspended at any point when the highest standards are not maintained, and reinstated when standards are restored.
Accredited official statistics are called National Statistics in the Statistics and Registration Service Act 2007.
Statement of compliance with the Code of Practice for Statistics
Our statistical practice is regulated by the Office for Statistics Regulation (OSR). OSR sets the standards of trustworthiness, quality and value in the Code of Practice for Statistics that all producers of official statistics should adhere to.
All of our statistics are produced and published in accordance with a number of statements and protocols to enhance trustworthiness, quality and value. These are set out in the Welsh Government’s Statement of Compliance.
These accredited official statistics (OSR) demonstrate the standards expected around trustworthiness, quality and public value in the following ways.
Trustworthiness
These statistics are compiled from administrative data systems in use in the Fire and Rescue Services in Wales.
These statistics are pre-announced on the Statistics and Research area of the Welsh Government website.
Access to the data during processing is restricted to those involved in the production of the statistics, quality assurance and for operational purposes. Pre-release access is restricted to eligible recipients in line with the Code of Practice (UK Statistics Authority).
Quality
Statistics published by Welsh Government adhere to the Statistical Quality Management Strategy which supplements the Quality pillar of the Code of Practice for Statistics and the European Statistical System principles of quality for statistical outputs.
Data collection and revisions
Since April 2009 incident data (relating to fires, false alarms and Special Service Incidents) have been submitted by the FRAs via the IRS. On 5 January 2016 responsibility for fire and rescue policy in England transferred from the Department for Communities and Local Government (CLG) to the Home Office, this resulted in IRS also being held by the Home Office (although there has been no change to the data collected). IRS records data submitted by FRAs in England, Scotland and Wales but does not currently collect data from FRAs in Northern Ireland. On the 1st April 2025 all fire-related Ministerial responsibilities moved from the Home Office to the Ministry of Housing, Communities and Local Government.
The incident data are extracted from IRS annually (usually around July/August) and marked provisional at first publication. All bulletins and StatsWales tables excluding the 6 month data published in February/March are based on this dataset. Due to the nature of the live system, whilst accurate at the time of extraction, totals may change and therefore be revised due to updated information.
Value
The Welsh Government uses the information in this bulletin to monitor the trends in fires occurring in Wales and provides information on FRAs’ performance and activities to citizens and communities in Wales. This helps to monitor the effectiveness of current policy, and for future policy development. The data are also used as evidence for national fire safety initiatives and campaigns. The data are used by the fire and rescue services for comparisons and benchmarking. The data aids the allocation of resources and the provision of community safety projects.
We regularly review our data collections and outputs to ensure that they are relevant, collect reliable data and meet user needs. We also consult our users on a number of fire data collections issues. This is part of an ongoing exercise covering all fire and rescue statistics in order to better understand user requirements and priorities for the future. As part of this, Welsh Government policy colleagues, fire and rescue services and others have provided information on how they use fire statistics.
You are welcome to contact us directly with any comments about how we meet these standards. Alternatively, you can contact OSR by emailing regulation@statistics.gov.uk or via the OSR website.
Well-being of Future Generations Act (WFG)
The Well-being of Future Generations Act 2015 is about improving the social, economic, environmental and cultural wellbeing of Wales. The Act puts in place seven wellbeing goals for Wales. These are for a more equal, prosperous, resilient, healthier and globally responsible Wales, with cohesive communities and a vibrant culture and thriving Welsh language. Under section (10)(1) of the Act, the Welsh Ministers must (a) publish indicators (“national indicators”) that must be applied for the purpose of measuring progress towards the achievement of the wellbeing goals, and (b) lay a copy of the national indicators before Senedd Cymru. Under section 10(8) of the Well-being of Future Generations Act, where the Welsh Ministers revise the national indicators, they must as soon as reasonably practicable (a) publish the indicators as revised and (b) lay a copy of them before the Senedd. These national indicators were laid before the Senedd in 2021. The indicators laid on 14 December 2021 replace the set laid on 16 March 2016.
Information on the indicators, along with narratives for each of the wellbeing goals and associated technical information is available in the Wellbeing of Wales report.
Further information on the Well-being of Future Generations (Wales) Act 2015.
The statistics included in this release could also provide supporting narrative to the national indicators and be used by public services boards in relation to their local wellbeing assessments and local wellbeing plans.
Contact details
Social justice and community safety statistics
Email: stats.inclusion@gov.wales
Media: 0300 025 8099
SB: 31/2026
