Neidio i'r prif gynnwy

Mae'r papur hwn yn darparu senarios wedi'u modelu ar gyfer y ffliw a niwmonia, COVID-19 a feirws syncytiol anadlol (RSV) ar gyfer tymor y gaeaf sydd i ddod.

Cyhoeddwyd gyntaf: 22 Medi 2025
Diweddarwyd ddiwethaf: 22 Medi 2025

Part 1: summary

Summary

Winter respiratory viruses consistently increase pressure on NHS Wales, though their impact varies each year. Uncertainty remains due to factors such as concurrent viral peaks and the effectiveness of seasonal vaccines.

This paper presents modelled scenarios based on historical data to support winter 2025 to 2026 planning for NHS Wales. It estimates potential pressures on hospitals (in terms of admissions and bed occupancy) from seasonal respiratory viruses, with a focus on influenza, RSV, and COVID-19. Whilst COVID-19 is not strictly a winter virus, overlapping peaks with flu and RSV could compound demand on healthcare services.

The paper also examines wider impacts of winter pressures across NHS Wales beyond hospital admissions, including emergency department attendances, and primary care activity due to respiratory illnesses. It highlights trends in GP consultation rates for acute respiratory infections and provides estimates of vaccine uptake for flu, RSV, and COVID-19 among eligible groups.

As with all modelling, the scenarios in this paper are not a prediction of what will happen but estimates of what could happen. We could also see similar peaks occurring at a different time in the season. The modelling uses past data to estimate future projections. Any changes to the NHS system, particularly in the past 12 months, may not have been taken into account in the modelling.

An expected increase in health care demand over the winter period may lead to a number of risks. The five harms framework, can be used to assess where risks could arise from, outlined in Table A1 (Appendix). The five harms framework was originally developed to assess the potential impact of the COVID-19 pandemic and can be explored further in the Technical Advisory Group paper - Five harms arising from COVID-19: consideration of potential baseline measures

This paper estimates the impact of known viruses and other determinants of health likely to increase the demand for healthcare in Wales across the 2025 to 2026 winter period. It should be used as an indication of what we expect to see based on historical data, rather than what will happen. A similar modelling approach has been taken for the past 3 years (2022 to 2023, 2023 to 2024 and 2024 to 2025). This 2025 to 2026 winter modelling report has also included additional statistical and mathematical modelling techniques which are stated throughout the report (and explained in further detail in the Appendix). 

This summer has seen higher-than-usual temperatures with provisional data suggesting summer 2025 has been the warmest summer on record for the UK. The impact of this year’s dry hot summer and the future impact of hotter dryer summers and warmer wetter winters is difficult to quantify, and this has not been taken into consideration.

Part 2: definitions

Scenario names and definition, terminology, admissions or occupancy

Admissions and occupancy

Admissions and occupancy refer to daily new admissions to hospital and daily hospital bed occupancy respectively. For admissions, the relevant diagnosis code is filtered in any position (that is not limited to being the primary diagnosis) for the first episode of the spell only (that is the admitting episode). For more information, see NHS Wales data dictionary. Day cases are included in the admissions.

ICD-10 codes

More specific ICD-10 codes for influenza, RSV, and COVID-19 have been used for analysis in this year's 2025 to 2026 winter modelling report (compared to analysis in previous winter modelling reports). These pathogen-specific codes align more closely with the ICNET dataset (which uses multiplex testing for identify admissions due to specific pathogens), enabling more accurate tracking of actuals with the modelled scenarios (‘observed data’) through the winter.

Averages

Unless stated otherwise, averages refer to the mean.

Peaks

Peaks refer to the maximum values recorded during each winter. Peak dates correspond to the date on which the maximum value was observed. Peak dates might some multiple days in some cases.

Dates

Most analysis in this report focusses on the winter period (between 1 September and 31 March inclusive). Unless stated otherwise, analysis carried out is usually only over the winter period. However, there are parts of the report where the whole year is considered, such as the vaccine rollout as it is important to deduce vaccine uptake throughout the year.

Scenarios

In previous years, we referred to Most Likely Scenario (MLS) and Reasonable Worst Case (RWC), but it is more appropriate to use “low”, "moderate" and "severe" scenarios rather than make assumptions early on about how the respiratory flu season may progress.

Part 3: headline results

Acute respiratory infections

Influenza (flu) admissions and occupancy (International Classification of Diseases 10 (ICD-10) codes: J09-J11)

Winter 2024 to 2025: Wales experienced the highest total number of winter flu hospital admissions since the pandemic, though peak daily admissions (78) were lower than in 2022 to 2023 (109). Bed occupancy due to flu peaked at 487 beds, more than twice the peak of the winter before (2023 to 2024), but less than the 2022 to 2023 peak (602 beds).

2025 to 2026 modelling scenarios: a peak of 51 to 78 daily admissions is estimated in early January 2026 (low to high scenarios), and 109 admissions in late December 2025 under a severe scenario. A peak of 153 to 487 beds (on the 6 to 7 January 2026) is estimated in the low, moderate and high scenarios. A peak of 602 beds is estimated to occur in the last week of December in the severe scenario.

RSV (ICD-10 codes: J12.1, J20.5, J21.0, B97.4)

Paediatric admissions and occupancy (0 to 4 years)

Winter 2024 to 2025: age groups 1 to 6 months, 7 to 12 months and 1 to 4 years showed a decrease of 33%, 26% and 14% RSV admissions respectively compared to the 2023 to 2024 season. The greater reductions among the youngest age groups may reflect the temporary protection effects of the maternal vaccination. Bed occupancy peaked at 29 beds on 30 November 2024, lower than the peak of 2023 to 2024 winter (33 beds).

2025 to 2026 modelling scenarios: peaks of 16 to 18 daily admissions are estimated (18 to 19 November for the low season scenario, 8 to 11 December for the high season scenario). A peak demand of 43 to 45 beds is estimated to occur (8 to 12 December 2025) in high season scenarios and 39 to 42 beds (19 to 20 November 2025) for low season scenarios.

Admissions and occupancy in older adults (75+)

Winter 2024 to 2025: there were 224 RSV admissions in adults aged 75 years and above last winter (2024 to 2025), which was 64% higher than the previous winter (2023 to 2024) and 35% higher than the average of the past 3 years (2021 to 2022, 2022 to 2023, 2023 to 2024). When considering those eligible for the vaccine (75 to 79 year olds), there was a 19% increase in RSV admissions last year (2024 to 2025 winter) compared with the prior winter (2023 to 2024). However, there was a 10% decrease observed in this age group when comparing with the average number of RSV admissions over the past 3 years. This may be due to the vaccine or natural seasonal variation. We may not see the full effects of the vaccine until the coming winter (2025 to 2026). Bed occupancy for adults aged 75 and above peaked in the third week of January at 54 beds per day, almost 3 times higher than the previous winter (2023 to 2024).

2025 to 2026 modelling scenarios: For adults aged 75 to 79, the high season occupancy scenarios (based on the 2022 to 2023 winter) with Vaccine Uptake (VU) of 30% and 60%, indicate a projected peak of 10 to 13 beds between 30 December 2025 to 2nd January 2026, while low season occupancy scenarios (based on the 2023 to 2024 winter) with VU= 30% and VU= 60% estimate 2-3 beds (1 to 2 December 2025).

COVID-19 admissions and occupancy

Winter 2024 to 2025: there were 2,228 admissions, a decrease compared to 4,248 admissions in 2023 to 2024. There was a peak of 25 daily admissions in the first week of October. The peak and totals for daily bed occupancy due to COVID-19 has decreased each year since the height of the pandemic (in 2020 to 2021).

2025 to 2026 modelling scenarios: the low and moderate scenarios estimate peaks of 10 and 25 daily admissions respectively. The severe scenario estimates a double peak, of 40 admissions on 3rd October 2025 and 34 on 3rd January 2026.The severe occupancy scenario estimates a maximum of 542 beds required on 13 October. The moderate and low scenarios project peaks of 339 and 164 beds on 15 October and 20 October, respectively.

Combined modelling scenarios for winter 2025 to 2026

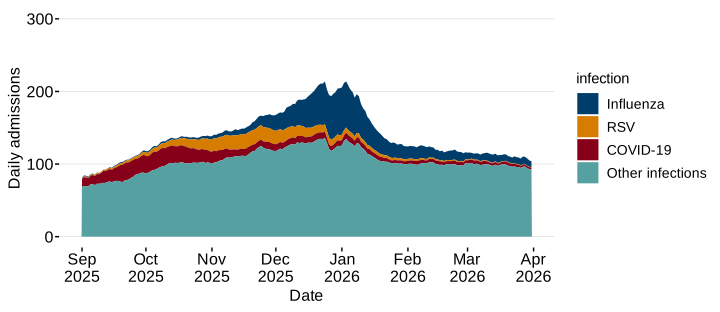
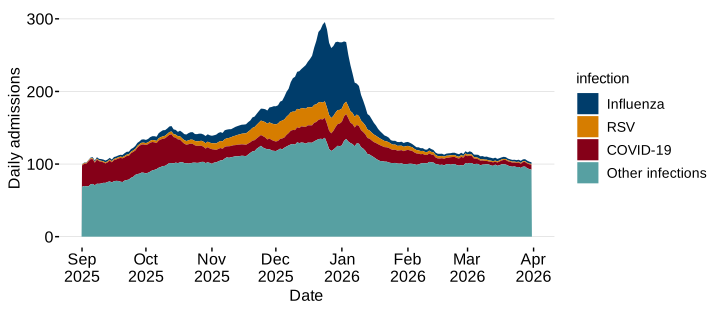
The severe combined admissions modelling scenario anticipates a peak of 296 admissions on 24 December 2025, whereas the moderate scenario estimates a maximum of 214 admissions on the same day.

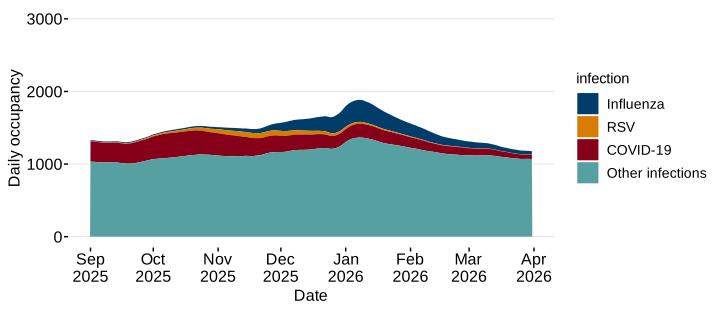
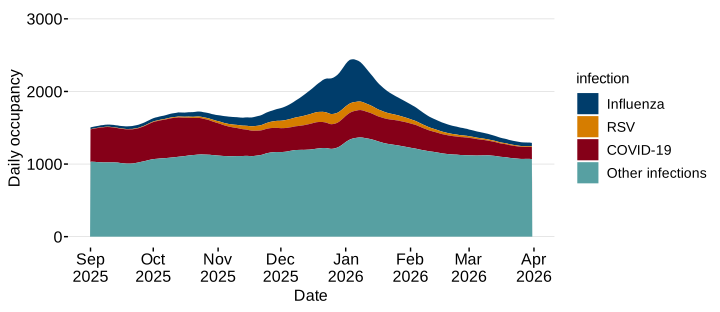
The severe combined occupancy scenario estimates a peak of 2,443 occupied beds on 5 January 2026, whereas the moderate scenario estimates a maximum of 1,885 beds occupied on 7 January 2026.

Emergency Department (ED) attendances

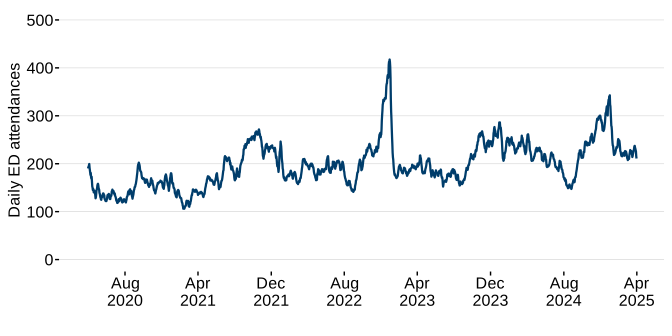
Last winter (2024 to 2025), there were 51,790 ED attendances due to respiratory problems - more than the previous two years. ED attendances due to respiratory problems peaked at 343 in the first week of January 2025.

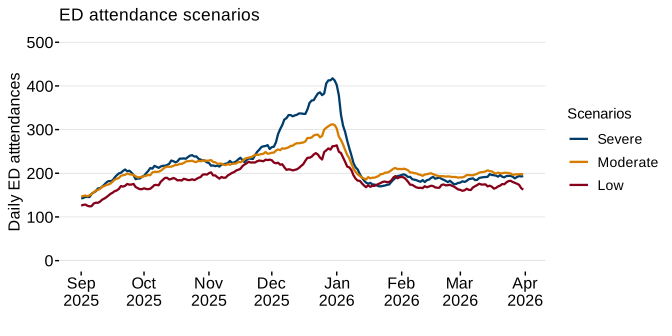
The low modelling scenario estimates a peak of 264 ED attendances on 1 January 2026, while moderate and severe modelling scenarios predict a peak of 312 and 417 ED attendances on 30th December 2025.

Capacity and resilience

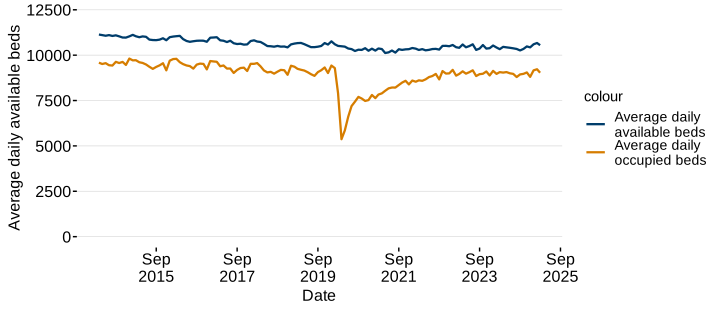
During the winter of 2024 to 2025, average daily bed numbers ranged from 10,260 to 10,670, with occupancy ranging between 84 to 87%. The percentage of beds occupied has remained relatively stable over the past two winters, consistently above 80% but never exceeding 90%.

Primary care

GP consultation rate

Last winter (2024 to 2025), adults and children had fewer GP consultations due to acute respiratory infections (ARI) compared to the 2023 to 2024 winter.

The daily average GP consultation rate during winter 2024 to 2025 for children (aged 14 or younger) was higher than that for adults (aged 15 and above), with 47 consultations per 100,000 population for children compared to 17 consultations per 100,000 for adults.

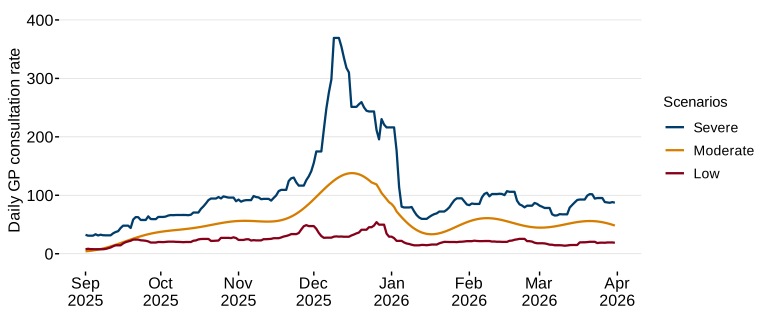
The severe, moderate, and low scenarios for GP consultation rates in children are estimated to reach maximum values of 369, 138, and 54 consultations per 100,000 population on 9 to 11 December, 17 December, and 26 December, respectively.

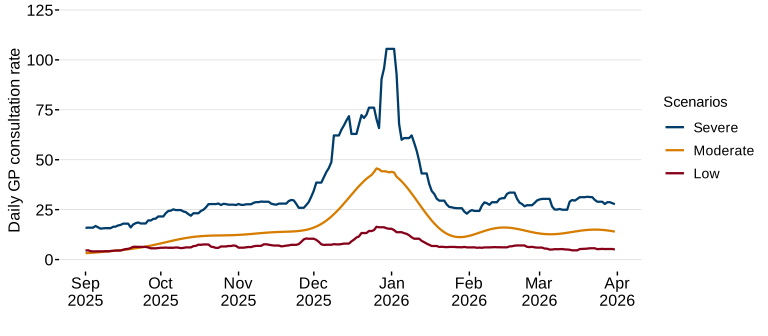
The projected peak of GP consultation rates for adults under the severe, moderate, and low scenarios are 106, 46, and 16 consultations per 100,000 population, occurring on 30 Dec to 2nd January and 27 December and 26 December, respectively.

Vaccinations

Flu

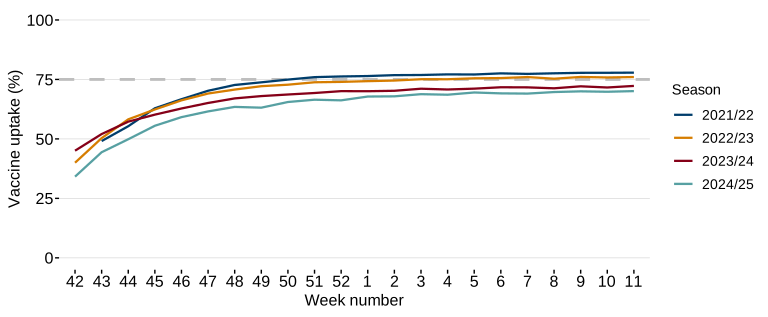
Flu vaccine uptake rates in adults aged 65 and above has decreased each year from 78% in 2021 to 2022 to 70% by the end of the 2024 to 2025.

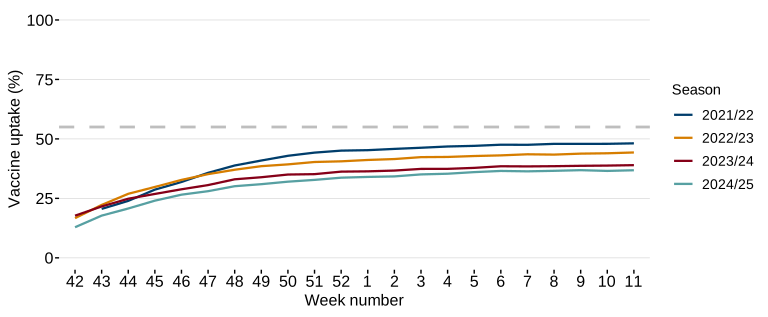
The vaccine uptake in those ‘at risk’ aged 6 months to 64 years has also decreased over the same period from around 48% at the end of the 2021 to 2022 season to 37% at the end of the 2024 to 2025 season.

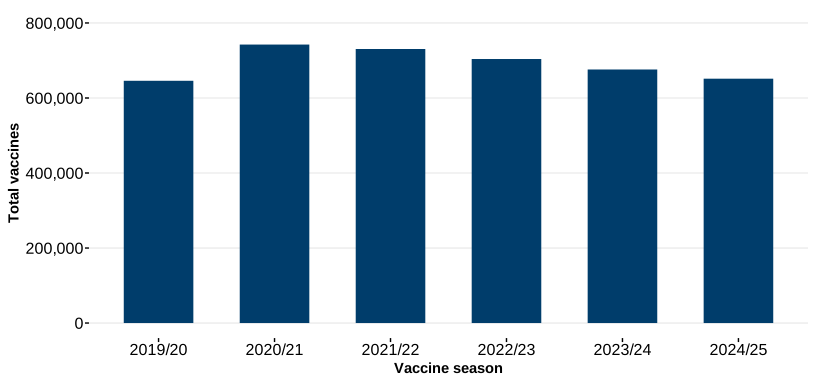
However, the total number of flu vaccines administered in the 2024 to 2025 winter (651,455) to all eligible groups is still higher than the number of flu vaccines administered the year before the pandemic (642,284 in 2019 to 2020).

RSV

As noted in Public Health Wales' RSV vaccination report and of 28 August 2025, the RSV vaccine uptake rate was 48% in pregnant women and 62.9% amongst adults aged 75 to 79.

In Wales, vaccine uptake rates in older adults may be similar to those in England but comparatively lower than in Scotland across both older adults and pregnant women.

COVID-19

The COVID-19 Vaccine uptake among individuals aged 75 and above, and the immunocompromised has declined each year since 2021 to 2022.

Part 4: background

Winter peaks

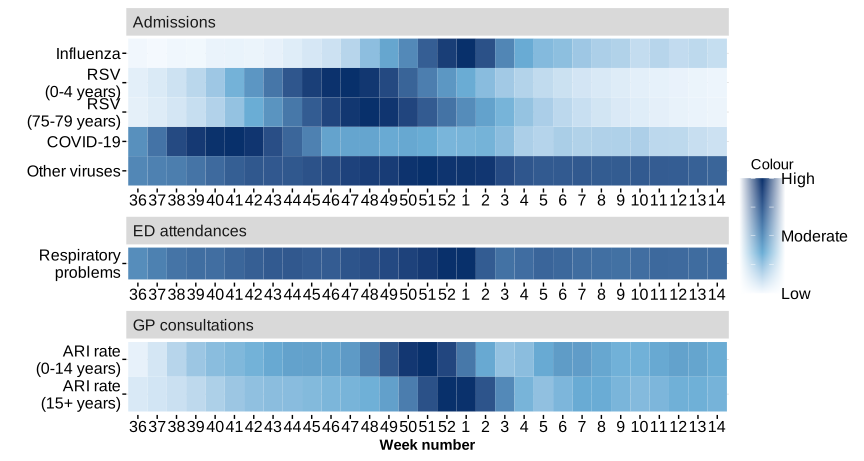
To convey winter pressures for different elements of the health care system (admissions, ED attendances and GP consultations), a heat map was created:

Figure 1: Most likely modelled scenario pressures due to admissions, ED attendances and GP consultations between week 36 and 14 of Winter 2025 to 2026 [Note 1].

Image

Description of figure 1: a heatmap comparing the likely winter pressure distribution across various infections and healthcare systems in Wales.

Sources: Digital Health and Care Wales (DHCW) and Public Health Wales 

[Note 1]: The average value for each week was calculated from daily data. ‘High’, where the darkest blue is observed, refers to the estimated 2025 to 2026 winter peak. All other colours are relative to the estimated peak.

According to moderate modelling scenarios: 

  • admissions are projected to peak in week 47 for RSV (ages 0 to 4), week 48 for RSV (ages 75 to 79), week 1 for influenza, and week 41 for COVID-19 during the winter of 2025 to 2026
  • ED attendances related to respiratory problems are anticipated to reach their highest levels between week 52 and week 1
  • GP consultation rates for acute respiratory infections are expected to peak during weeks 51 and 52 for children aged 0 to 14 years and those aged 15 years and older, respectively

Last year’s modelling compared with actuals

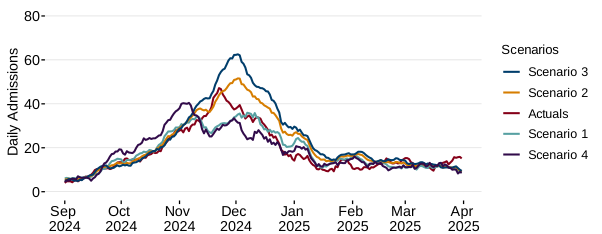
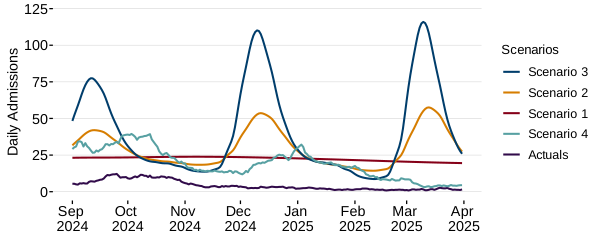
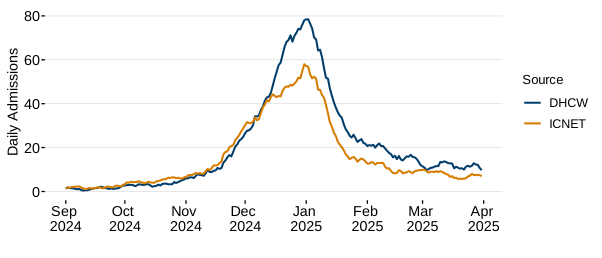
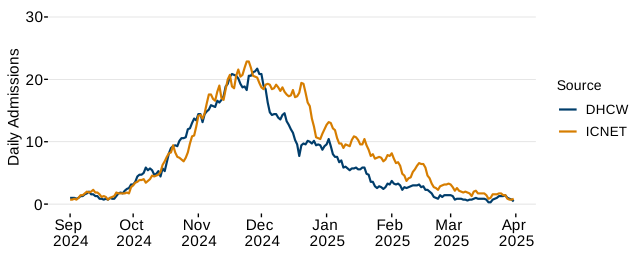
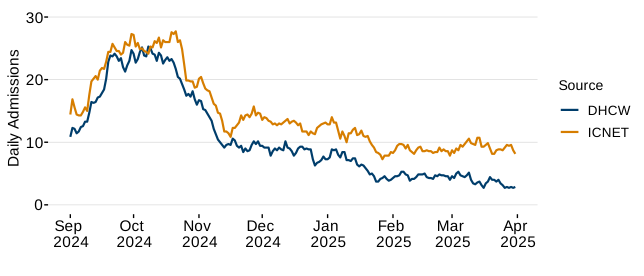
The hospital admissions modelling scenarios for flu, RSV (ages 0 to 4), and COVID-19 provided in the 2024 to 2025 winter modelling report have been compared with the actuals provided by Digital Health and Care Wales, (DHCW) up to the end of 31 March 2025. The actuals fell within the scenarios for flu and RSV (age 0 to 4 admissions, but the COVID-19 actuals fell below those estimated by the modelling. This indicates the effectiveness of the modelling scenarios for planning purposes, particularly for flu and paediatric RSV hospital admissions in the 2024 to 2025 winter. Additional modelling techniques have been employed for the winter 2025 to 2026 modelling with the aim of further improving the effectiveness of the modelling.

Please see the appendix for further detail on last year’s 2024 to 2025 winter modelling compared to the actual number of hospital admissions which occurred.

What decisions does this winter modelling report inform?

The respiratory winter modelling of hospital admissions presented in this report are compared to the actuals on a weekly basis throughout the winter period (between September and March inclusive). They are presented at system resilience and planning meetings to stakeholders including NHS Performance and Improvement colleagues, Public Health Wales (PHW), and decision-makers in the Welsh Government and local health boards. This is to provide awareness and early warning of increases in respiratory illnesses particularly where the admissions may differ from what is expected allowing for earlier and effective planning. At these meetings, as well as the winter modelling, additional modelling is also provided which projects forward two weeks (short-term projections) to give an idea of estimated admissions over the coming fortnight. These models are also compared to actuals on a weekly basis throughout winter and are published in our respiratory surveillance reports. Alongside this winter modelling report, we have included two technical reports to provide users with more detail on the methodology, assumptions and limitations; one for the short-term projections, and another for the RSV epidemiological compartmental model used as part of this winter modelling work.

Local health board users also make use of the report and the underlying data of which they have access to which goes down to health board level. This year, health board decision makers will be able to access an interactive dashboard to consider and compare their historic data and winter scenarios with other health boards and with the overall Wales-level data.

Short-term projections

Short-Term Projections (STPs) are used to estimate healthcare demand during winter and assist in the efficient allocation of resources. The STPs model looks into spatial and temporal patterns in admissions across seven local health boards in Wales and estimates admissions up to two weeks in advance. It applies a flexible statistical method that identifies trends without modelling the underlying causes directly. The model is updated weekly as new data becomes available, and projections are adjusted accordingly. A limitation of the STPs model is its inability to accurately estimate peak timing. Therefore, it is essential to interpret the model's results with appropriate caution.

Part 5: acute respiratory illnesses hospital admissions

Top line summary

Our 2025 to 2026 winter modelling scenarios now use more specific ICD-10 codes for influenza and RSV, which differs from last year’s approach. This change was implemented to ensure consistency between data provided by PHW and DHCW (Digital Health and Care Wales).

Winter 2024 to 2025 saw 4,349 influenza admissions, the highest since the pandemic.

Influenza admissions during the non-pandemic years peaked between 24 December and 1 February.

Influenza modelling scenarios have peak admissions ranging from 51 to 109 daily admissions for winter 2025 to 2026. The peak in the occupancy scenarios for patients admitted due to influenza ranges from 153 to 602.

There were fewer RSV paediatric (aged 0 to 4 years) admissions during the 2024 to 2025 winter than previous winters. RSV paediatric admissions during the non-pandemic years peaked between 11 November and 8 December.

Respiratory Syncytial Virus (RSV) scenarios for the winter 2025 to 2026 have peak paediatric admissions ranging from 16 to 18 daily admissions between 18 November and 11 December. The daily peak in the number of beds occupied by RSV patients ranges from around 39 to 45.

COVID-19 admissions scenarios suggest a peak of 10 to 40 admissions between 3 and 8 October while COVID-19 occupancy scenarios estimate peaks of 164 to 542 beds between 13 to 20 October.

Combined scenarios assess the collective impact of influenza, RSV and COVID-19 and other infections (pneumonia, acute bronchitis and bronchiolitis, measles, norovirus, whooping cough, streptococcus A, and Human Metapneumovirus (HMPV)).

The moderate combined scenario estimates a peak admission of 214 admissions on 24 December and peak occupancy of 1,885 beds on 7 January.

The severe combined scenario estimates a peak admission of 296 admissions on 24 December and peak occupancy of 2443 beds on 5 January.

Influenza admissions

To assess the impact of influenza (flu) on secondary care in Wales, daily hospital admissions related to influenza were deduced using International Classification of Diseases, Version 10 (ICD-10) codes: J09-J11. These codes do not include pneumonia (J12-J18) as was done in previous winter modelling reports, but will be added to the ‘other infections’ category (please see the combined scenarios). Subsequently, admissions data was smoothed by calculating the 7-day rolling averages. Following this, peaks and trends during each season were identified.

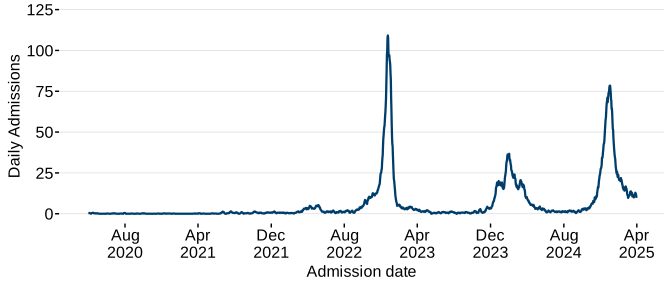
Figure 2: 7-day rolling average of daily influenza admissions, between April 2020 and March 2025 [Note 1].

Image
Influenza admissions 2020 to 2025

Description of Figure 2: A line chart showing the 7 day rolling average of recorded daily influenza admissions in Wales.

Source: Digital Health and Care Wales (DHCW)

[Note 1]: Data includes diagnosis codes J09 to J11 from ICD-10

During the winter of 2024 to 2025, defined as 1 September 2024 to 31 March 2025, a total of 4,349 influenza admissions were recorded – highest recorded since the pandemic (3,892 in 2022 to 2023 winter and 2,437 in 2023 to 2024 winter). 4% of these admissions were to the Intensive Care Unit (ICU). The average length of stay due to influenza was 8 days across all ages in the 2024 to 2025 winter. The daily admissions among all ages showed a peak of 78 in 2024 to 2025 in the first week of January, around twice the size of 2023 to 2024 winter peak. However, the peak was much smaller compared to 2022 to 2023 peak.

To model influenza admission scenarios for the winter of 2025 to 2026, different approaches were used based on historical data and statistical modelling techniques. The severe scenario uses admission data from the 2022 to 2023 winter, which saw a high number of admissions post-pandemic. The high scenario is based on data from winter 2024 to 2025. For other scenarios, statistical techniques were applied: the moderate scenario uses the Seasonal Autoregressive Integrated Moving Average (SARIMA) technique, and the low scenario uses the Exponential Smoothening (ETS) technique. Please see the appendix for further information on statistical modelling techniques used.

Table 1: Names of influenza admission and occupancy scenarios and the statistical models applied.

Scenario nameTechnique
SevereRepeat of 2022 to 2023 data
HighRepeat of 2024 to 2025 data
ModerateSARIMA
LowETS

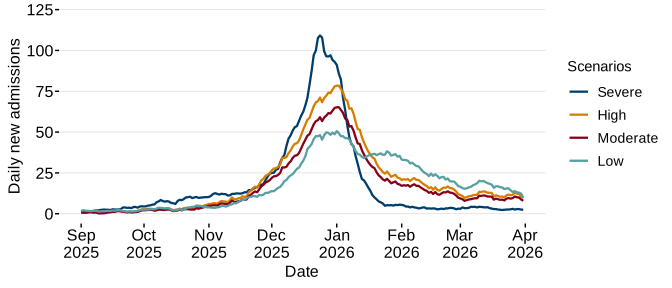
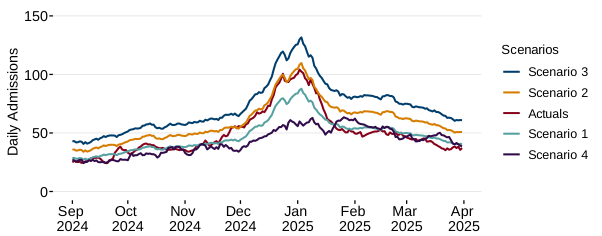
Figure 3: daily influenza admissions scenarios – winter 2025 to 2026. (Note 1]

Image
Influenza admissions scenarios

Description of figure 3: A line chart illustrating various projected scenarios (low, moderate, high, severe) for admissions due to influenza during the 2025 to 2026 winter season.

Source: SRE (Science Research Evidence) calculations.

[Note 1]: Note that the ‘High’ scenario depicts the 2024 to 2025 actuals.

The severe scenario estimates a peak of 109 admissions in the last week of December while the high, moderate and low scenarios estimate a peak of 78, 65 and 51 admissions respectively during the first week of January.

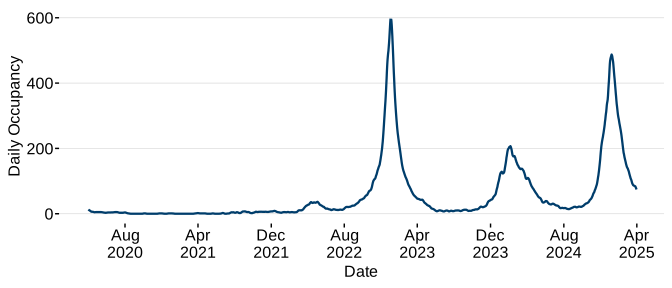
Figure 4: 7-day rolling average of daily influenza occupancy, between April 2020 and March 2025 [Note 1].

Image

Description of Figure 4: a line chart showing the 7-day moving average of hospital occupancy due to influenza in Wales.

Source: Digital Health and Care Wales (DHCW).

[Note 1]: Data includes diagnosis codes J09 to J11 from ICD-10.

Influenza occupancy peaked between 3 January and 5 February in the last three years (excluding the pandemic years). The highest peak in influenza occupancy was observed in the 2022 to 2023 winter where a maximum value of 602 beds per day was observed. During the winter of 2024 to 2025, the occupancy due to influenza peaked at 487 beds per day on 7 January 2025, smaller than the 2022 to 2023 peak but more than twice the peak height as the winter before (2023 to 2024).

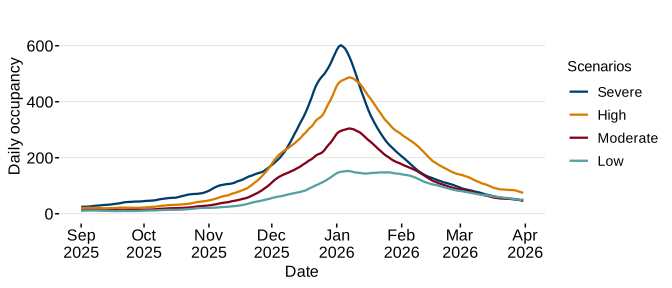
Figure 5: Daily influenza occupancy scenarios – winter 2025 to 2026. [Note 1]

Image

Description of figure 5: A line chart representing various projected scenarios (low, moderate, high, severe) for influenza-related hospital occupancy in Wales.

Source: SRE calculations.

[Note 1]: Note that the ‘High’ scenario depicts the 2024/25 actuals.

The techniques used to create admissions scenarios were also used to develop influenza occupancy scenarios. The severe occupancy scenario estimates a peak of 602 beds on 3rd January 2026 while the high, moderate and low scenarios estimate a peak of 487, 305 and 153 beds respectively during the 6 to 7 January 2026.

RSV paediatric admissions (ages 0 to 4)

GOV.UK notes that RSV is a common respiratory virus that usually causes mild, cold-like symptoms (it is in the same family as the human parainfluenza viruses and mumps and measles viruses). While most RSV infections usually cause mild illness, infants aged less than 6 months may develop conditions such as bronchiolitis and pneumonia, resulting in hospital admissions. By age 2 years, most children have had at least one RSV infection as noted by the Lancet's website. Therefore, admissions for the 0 to 4-year-old age group were analysed between April 2020 and March 2025. Compared to the previous winter modelling report, narrower ICD-10 codes were used to deduce RSV admissions that are specific to the pathogen (J12.1, J20.5, J21.0 and B97.4 instead of J20-J22 that covers all cases of bronchitis and bronchiolitis).

Starting in August 2024 for Scotland and September 2024 for England and Wales and as noted by GOV.UK, the UK became the first country to introduce RSV vaccines for pregnant women and adults aged 75 to 79. The NHS adult vaccine campaign includes a routine program where older adults are offered the RSV vaccination within 12 weeks of their 75th birthday and a one-off catch-up campaign for those aged 75 to 79. The maternal vaccination is expected to protect both expectant mothers and their babies from serious illness. Data for winter of 2024 to 2025 is now available to assess the outcomes following the first year of the RSV vaccination programme’s implementation.

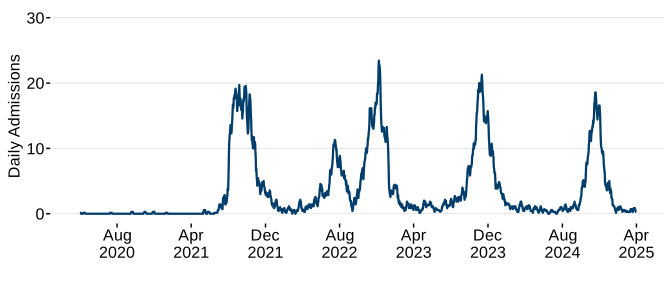
Figure 6: 7-day rolling average of daily paediatric RSV admissions (ages 0 to 4), between April 2020 and March 2025 [note 1].

Image

Description of figure 6: a line chart showing recorded daily Respiratory Syncytial Virus (RSV) admissions among children aged 0 to 4 in Wales.

Source: Digital Health and Care Wales (DHCW).

[Note 1]: Data includes diagnosis codes J12.1, J20.5, J21.0 and B97.4 from ICD-10.

During the 2024 to 2025 winter season, there were a total of 1,020 RSV paediatric (aged 0 to 4 years) admissions. This was a 26% decrease compared to the previous season and 23% decrease compared to the 3-year average. Age groups 1 to 6 months, 7 to 12 months and 1 to 4 years showed a decrease of 33%, 26% and 14% respectively compared to the 2023 to 2024 season. The greater reductions among the youngest age groups may reflect the temporary protection effects of the maternal vaccination which is likely to last ~ 6 months after birth. The admissions showed a peak of 19 daily admissions on 17 to 18 November 2024, a week later than the previous season. Over the last three winters, the RSV admissions peaked between 11 November and 8 December.

UKHSA (United Kingdom Health Security Agency) collates data on test-confirmed hospitalised RSV cases in England through the Severe Acute Respiratory Infection (SARI) Watch surveillance system which is a sentinel system that collects data from small network of acute NHS trusts reporting voluntarily. SARI data on GOV.UK suggests that hospital admission rate (excluding Intensive Care Unit (ICU) or High Dependency Unit (HDU)) among those aged under 5 years, peaked at 46.17 per 100,000 in week 48 2024. This is similar to the peak observed in 2023 to 2024 winter (including ICU or HDU) noted on GOV.UK where the hospitalisation rate peaked at 44.83 per 100,000 in week 48 2023, with the data noted on GOV.UK. Cumulative rates for both seasons are similar as well, although 2023 to 2024 is slightly lower than 2024 to 2025. This indicates that there are no significant reductions in winter 2024 to 2025 compared to the previous season among children under 5 years in England. Nevertheless, it remains possible that younger cohorts (1 to 6 months that derive benefits from maternal vaccination) could experience decreases. However, we do not have access to the granular data for these age groups for England to investigate further.

To generate admissions and occupancy scenarios, a modified version of Susceptible, Exposed, Infectious, Recovered, and Susceptible (SEIRS) compartment transmission model (SE2I2RS), incorporating two compartments for the pre-infectious and infectious states was created. (For more details, please refer to the ‘Effect of respiratory syncytial virus (RSV) vaccines on hospital admissions in Wales’ paper). The model was calibrated using admission data from the winters of 2022 to 2023 and 2023 to 2424. With these two winters serving as reference points, vaccine uptake rates among target groups—specifically pregnant women and adults aged 75 to 79 - were varied between 0% and 90% and a range of scenarios were created. For this winter modelling report, the modelling scenarios with Vaccine Uptake (VU) values of 30% and 60% were chosen and are presented below.

Table 2: Names of RSV admission and occupancy scenarios, including details of the SEIR model assumptions (vaccine uptake and reference winter). [Note 1].

Scenario nameReference SeasonVaccine uptake
High season, VU= 30%2022 to 2023 winter30%
High season, VU= 60%2022 to 2023 winter60%
Low season, VU= 30%2023 to 2024 winter30%
Low season, VU= 60%2023 to 2024 winter60%

[Note 1]: VU refers to vaccine uptake (%)

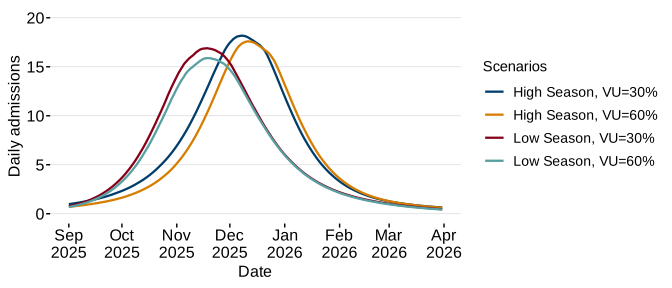
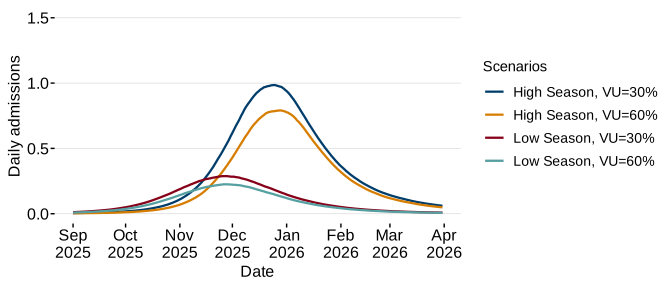
Figure 7: daily RSV paediatric admissions (ages 0 to 4 years) scenarios – winter 2025 to 2026.

Image

Description of figure 7: A line chart representing projected scenarios for RSV admissions among children aged 0 to 4 years in Wales, factoring in vaccination uptake rates of 30% and 60% for a high season and a low season.

Source: SRE calculations.

High season scenarios with VU= 30% and VU= 60% indicate a projected peak of 18 admissions between 8 and 11 December 2025, while low season scenarios with VU= 30% and VU= 60% forecast a peak of 16 to 17 admissions between 18 and 19 November. Please note that the effect of the vaccination is more apparent in younger age groups <1 years old where the model estimates reductions 9 to 31% in infants aged 1 to 6 months, and 3 to 12% reduction in 7 to 12 months with a vaccine uptake range between 0 to 90% (See the ‘Effect of respiratory syncytial virus (RSV) vaccines on hospital admissions in Wales’ paper). The model suggests that improving the vaccine uptake rate from 30% to 60% could reduce RSV admissions (in 0 to 4 year olds) over the 2025 to 2026 winter season from 1,345 to 1,252 admissions for the high scenario and from 1,299 to 1,222 admissions for the low scenario.

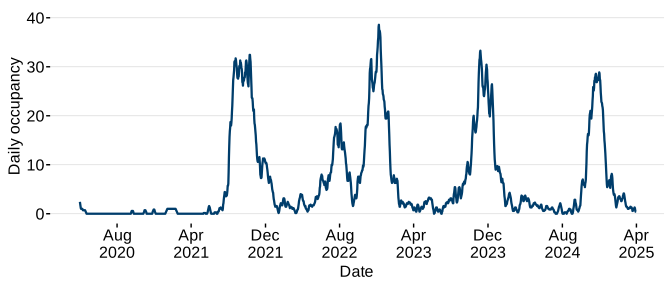
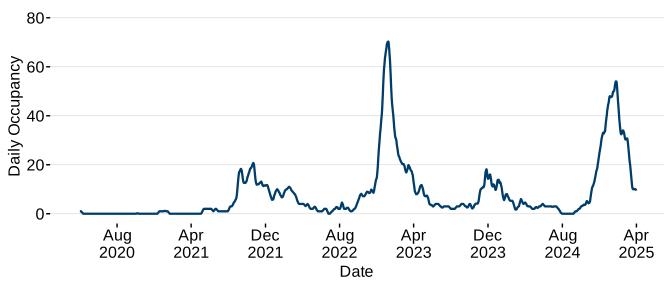
Figure 8: 7-day rolling average of daily paediatric RSV occupancy (ages 0 to 4), between April 2020 and March 2025 [note 1].

Image

Description of Figure 8: a line chart of RSV-related bed occupancy among children aged 0 to 4 years in Wales, broken down.

Source: Digital Health and Care Wales (DHCW).

[Note 1]: Data includes diagnosis codes J12.1, J20.5, J21.0 and B97.4 from ICD-10

Bed occupancy due to RSV in children aged 0 to 4 years peaked at 29 beds per day on November 30, 2024, lower than the previous year’s peak of 33 beds per day on 6 November 2023.

Length of stay for younger age groups remained unchanged in winter 2024 to 2025 compared to previous winters. Children aged 1 to 4 years with RSV stayed an average of 1.85 days during the 2024 to 2025 season, similar to the data from the past three years. Similarly, the length of stay among infants aged 1 to 6 months and 7 to 12 months was comparable to previous years.

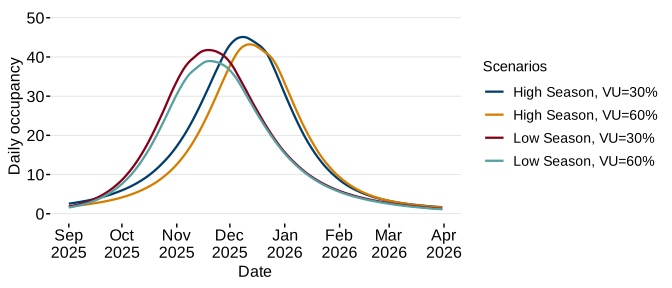
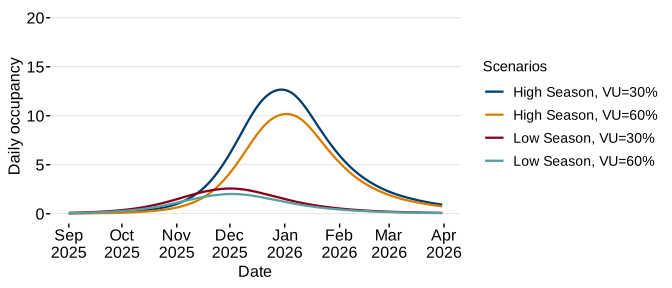
Figure 9: Daily RSV paediatric (ages 0 to 4) occupancy scenarios – winter 2025 to 2026

Image

Description of figure 9: A line chart representing projected scenarios for RSV bed occupancy among children aged 0 to 4 years in Wales, factoring in vaccination uptake rates of 30% and 60% for a high season and a low season.

Source: SRE calculations.

Using the length of stay data from the 2022 to 2023 and 2023 to 2024 winters, RSV occupancy scenarios were generated from the output of the SE2I2R model. In high season occupancy scenarios with vaccine uptake (VU) levels at 30% and 60%, projections indicate a peak demand of 43 to 45 beds between 8 and 12 December 2025. In low season occupancy scenarios with VU at 30% and 60%, the estimated peak in beds ranges from 39 to 42 beds during 19 to 20 November 2025.

RSV admissions in older adults (ages 75 and above)

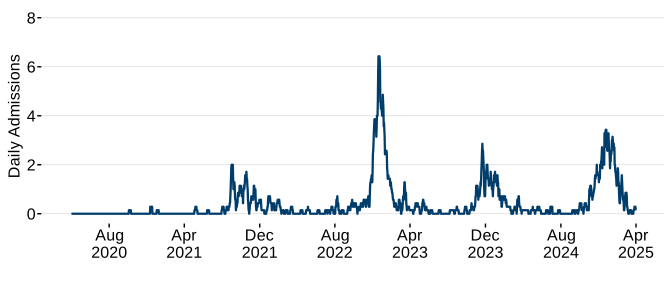
During the 2024 to 2025 season, there were a total of 224 RSV admissions among adults aged 75 and above with the daily admissions peaking at 3.43 admissions during the last week of December. The total admissions numbers in ages 75+ increased by 64% compared to the 2023 to 2024 season and by 35% compared to the 3-year average. Adults aged 75 to 79 showed an increase of 19% compared to the 2023 to 2024 winter but a 10% decrease compared to the 3-year average. Interpretation of this result is challenging due to low numbers and varying seasonal pressure due to RSV.

Figure 10: 7-day rolling average of daily RSV admissions in older adults (ages 75 and above), between April 2020 and March 2025 [note 1].

Image

Description of figure 10: a line chart showing RSV-related admissions in older adults ages 75 and above in Wales.

Source: Digital Health and Care Wales (DHCW).

[Note 1]: Data includes diagnosis codes J12.1, J20.5, J21.0 and B97.4 from ICD-10.

RSV vaccination programmes in older adults across the UK

Evidence from England and Scotland on the impact of the RSV vaccination program on hospital admissions is varied. A study noted on the Lancet website from the UKHSA found that the RSV vaccination has resulted in a 30% (95% confidence interval (CI) 18% to 40%) reduction in RSV hospitalisation rates among adults aged 75 to 79 in England. A similar study noted on the Lancet website by Public Health Scotland found a 62% (95% CI 35.0% to 79.8%) decrease in adults aged 74 to 79 years. Both studies employ regression discontinuity design (RDD) which uses a predefined cutoff — an age-based eligibility for the vaccine — to estimate effects by comparing outcomes among individuals above and below the threshold. They compare the hospitalisation rate for those in the late 70s age range in this season with a modelled expected hospitalisation rate for the 2024 to 2025 season in the absence of a vaccine programme. The improved protection against RSV-related hospitalisations in Scotland compared to England could be due to:

  • the earlier start date of their programme
  • the increased level of vaccine uptake in the eligible population occurring earlier in the RSV season

Neither study compares the current RSV admission rates (from 2024 to 2025 winter) to other winters prior to the introduction of the vaccination programme.

A study by Costello Medical and noted on their website showed that the weekly English hospital admission rates of RSV positive cases per 100,000 population in adults aged 75+ for the 2024 to 2025 season have been comparable to the 2023 to 2024 season, when an RSV vaccine was not available for the older adult population. Similarly with reference to Public Health Scotland's website, the RSV incidence rate per 100,000 population in Scotland in 2024 to 2025 season was comparable to that of the previous season without vaccination. Further study of the broader age category of 75+ versus the narrower group that is eligible for vaccination may yield useful evidence regarding these dynamics.

Figure 11: daily RSV admissions scenarios (adults aged 75 to 79) – winter 2025 to 2026

Image

Description of figure 11: line chart representing four projected scenarios for RSV admissions for adults aged 75 to 79 in Wales, factoring in vaccination uptake rates of 30% and 60% for a high season and a low season.

Source: SRE calculations.

The average length of stay of adults aged 75 to 79 due to RSV in Wales was 14.25 days in the 2024 to 2025 winter compared to 8.22 days in 2023 to 2024 winter. Similarly, adults aged 80 and above showed a higher length of stay in 2024 to 2025 winter (23.37 days vs 11.34 days).

The model suggests that improving the vaccine uptake rate from 30% to 60% could reduce RSV admissions (in 75 to 79-year-olds) over the 2025 to 2026 winter season from 68 to 54 admissions for the high scenario and from 23 to 18 admissions for the low scenario.

Figure 12: 7-day rolling average of daily RSV occupancy in older adults (ages 75 and above), between April 2020 and March 2025 [note 1].

Image

Description of Figure 12: A line chart showing RSV-related bed occupancy in older adults 75 and above in Wales.

Source: Digital Health and Care Wales (DHCW).

[Note 1]: Data includes diagnosis codes J12.1, J20.5, J21.0 and B97.4 from ICD-10.

During the first week of January in the winter of 2024 to 2025, the peak in occupancy in older adults was observed in the third week of January, which occurred nearly two months after the peak occupancy among children aged 0 to 4 years. As adults tend to occupy beds for longer durations, they contribute more significantly to overall bed occupancy. Occupancy for adults aged 75 and above reached a peak of 54 beds, which was almost three times higher than the previous winter (2023 to 2024). This finding may seem contradictory, as vaccination is typically associated with a reduced length of hospital stay. However, the vaccination status of hospitalised individuals within the dataset is not known. It is possible that unvaccinated individuals were more likely to be admitted and experienced worse outcomes. Age may have been another contributing factor to length of stay.

Figure 13: Daily RSV occupancy scenarios (adults aged 75 to 79) – winter 2025 to 2026.

Image

Description of figure 13: A line chart representing four projected scenarios for RSV bed occupancy for adults aged 75 to 79 in Wales, factoring in vaccination uptake rates of 30% and 60% for a high season and a low season.

Source: SRE calculations.

This section only presents modelling scenarios for adults aged 75 to 79 who are eligible for vaccination. (Results for those aged 80 and above are included in the model but not shown here. For these results see the ‘Effect of respiratory syncytial virus (RSV) vaccines on hospital admissions in Wales’ report). High season occupancy scenarios with VU= 30% and VU= 60% indicate a projected peak of 10 to 13 beds between 30 December 2025 to 2 January 2026, while low season occupancy scenarios with VU= 30% and VU= 60% estimate peak occupancy of 2 to 3 beds per day between 1 to 2 December 2025.
COVID-19

In May 2023, the World Health Organization (WHO) announced that COVID-19 is no longer classified as a global health emergency. However, the WHO also emphasised that the risk of virus evolution remains, with new variants emerging.

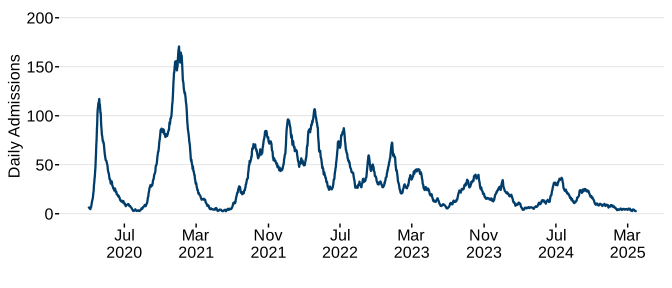
Figure 14: 7-day rolling average of daily COVID-19 admissions, between March 2020 and March 2025 [note 1].

Image

Description of Figure 14: A line chart of COVID-19 related admissions in Wales.

Source: Digital Health and Care Wales (DHCW).

[Note 1]: Data includes diagnosis codes U07.1, U07.2, U09.9 and U10.9 from ICD-10.

COVID-19 admissions during winter have been at the lowest levels since the pandemic. In Wales, admissions due to COVID-19 showed a similar decreasing trend totalling 2,228 admissions in the winter of 2024 to 2025, compared to 4,248 in 2023 to 2024. Additionally, the daily admissions showed a peak of 25 admissions in the first week of October 2025 after which the admissions continued to show a decreasing trend. The average length of stay due to COVID-19 was 15.1 days was across age groups. Adults aged 65 and above accounted for majority of admissions (68%) and showed a length of stay of 19.5 days on average. COVID-19 admissions can occur outside of winter, though this is outside of the scope of the modelling, it is important for decision makers to be aware of and consider in their planning.

Statistical modelling techniques were used to project future COVID-19 admission scenarios for the winter of 2025 to 2026. The severe and moderate scenarios correspond to repeats of data from the 2023 to 2024 and 2024 to 2025 winters respectively, while the low scenario is based on SARIMA modelling.

Table 3: names of COVID-19 admission and occupancy scenarios and the statistical models applied.

Scenario nameTechnique
SevereRepeat of 2023 to 2024 data
ModerateRepeat of 2024 to 2025 data.
LowSARIMA

Description of table 3: presents different COVID-19 admission and occupancy projected scenarios methods used.

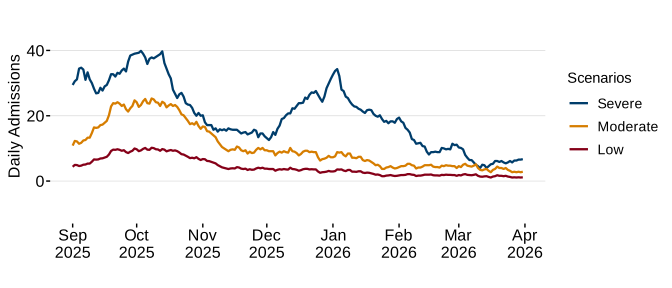
Figure 15: daily COVID-19 admissions scenarios – winter 2025 to 2026. [Note 1]

Image

Description of Figure 15: A line chart representing different projected daily COVID-19 admissions scenarios (low, moderate, severe) for Winter 2025 to 2026.

Source: SRE calculations.

[Note 1]: Note that the ‘moderate’ scenario depicts the 2024 to 2025 actuals.

The severe COVID-19 admissions scenario projects a peak of 40 admissions on 3 October, while the moderate and low scenarios estimate peaks of 25 and 10 admissions on 8 October, respectively. All three COVID-19 scenarios anticipate peaks occurring in October. RSV scenarios suggest peaks between November and December while influenza scenarios suggested peaks between December and January.

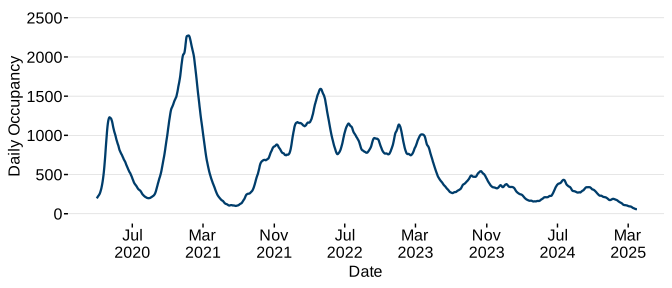
Figure 16: 7-day rolling average of daily COVID-19 occupancy, between March 2020 and March 2025 [note 1]

Image

Description of figure 16: a line chart showing the 7-day rolling average of daily COVID-19 occupancy, in Wales.

Source: Digital Health and Care Wales (DHCW).

[Note 1]: data includes diagnosis codes U07.1, U07.2, U09.9 and U10.9 from ICD-10.

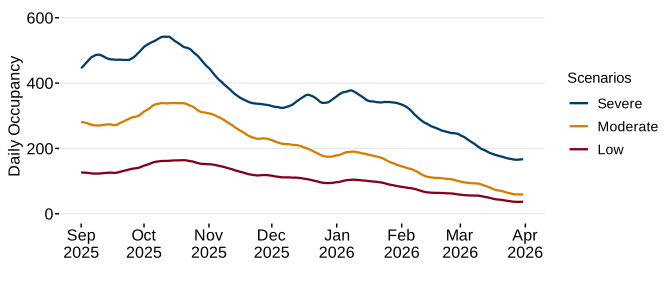
Figure 17: daily COVID-19 occupancy scenarios – winter 2025 to 2026. [Note 1].

Image

Description of figure 17: A line chart representing different projected daily COVID-19 bed occupancy scenarios in Wales for Winter 2025 to 2026.

Source: SRE calculations.

[Note 1]: Note that the ‘Moderate’ scenario depicts the 2024 to 2025 actuals.

The severe COVID-19 occupancy scenario estimates a maximum of 542 beds required on 13 October. The moderate and low scenarios project peaks of 339 and 164 beds on 15th October and 20th October, respectively.

Other infections

To assess the impact of other infections, admissions attributed to pneumonia (J12-18), acute bronchitis and bronchiolitis (J20-J22X, excluding RSV codes), Measles (B05-B06), Norovirus (A08.1), Whooping cough (A37), Streptococcus A (B950, A400, and A389), and Human Metapneumovirus (HMPV) (B9781, J211, and J123) were quantified.

During the 2024 to 2025 winter season, there were 21,055 admissions attributable to the other infections mentioned above (down from 23,177 in 2023 to 2024 and 22,089 in 2022 to 2023). Most of the admissions involved pneumonia, acute bronchitis, and bronchiolitis. There were 281 admissions attributed to Norovirus, representing a 24% increase compared to the previous winter (2023 to 2024), which had 226 admissions. The rapid mutation in 2024/25 may have caused some individuals to be infected with norovirus twice, as noted on GOV.UK. The average length of stay for patients admitted with Norovirus was 20.83 days, exceeding that of patients diagnosed with influenza or COVID-19. Admissions related to Strep A decreased to 193 in the 2024 to 2025 winter, compared to 316 in 2023 to 2024 and 535 during the 2022 to 2023 season. Patients admitted with Strep A had an average length of stay of 6.62 days. Admissions for measles and whooping cough have remained low over the past five years, with fewer than 10 admissions for measles and fewer than 50 admissions for whooping cough reported during this period.

Combined scenarios

In order to assess the collective impact of the three winter viruses (flu, RSV and COVID-19), a moderate and a severe scenario was selected for each and then combined with the three-year average of ‘other infections’ mentioned above (2022 to 2023, 2023 to 2024 and 2024 to 2025). The Low scenario estimates were not included in the combined analysis.

The combined moderate scenarios are based on the following four projections:

Table 4: details of scenarios used in the creation of moderate combined admissions and occupancy scenarios.

InfectionScenario/seasonDetails
InfluenzaModerateRepeat data from the 2024 to 2025 season
RSVLow season, VU = 30%Model fit to 2023 to 2024 winter, vaccine uptake of 30% in pregnant women and older adults
COVID-19ModerateRepeat data from the 2024 to 2025 season
Other infectionsThree-year averageAverage of 2022 to 2023, 2023 to 2024, and 2024 to 2025 winter

Description of table 4: outlines the scenarios used to develop the moderate combined projections for hospital admissions and bed occupancy in Wales.

Table 5: details of scenarios used in the creation of severe combined admissions and occupancy scenarios.

InfectionScenarioDetails
InfluenzaSevere scenarioRepeat data from the 2022 to 2023 season
RSV"high season, VU = 30%"Model fit to 2022 to 2023 season, vaccine uptake of 30% in pregnant women and older adults
COVID-19Severe scenarioRepeat data from the 2023 to 2024 season
Other infectionsThree-year averageAverage of 2022 to 2023, 2023 to 2024, and 2024 to 2025 winter

Description of table 5: outlines the scenarios used to develop the severe combined projections for hospital admissions and bed occupancy in Wales.

Figure 18: combined moderate scenario – daily hospital admissions (including ICU admissions) for winter 2025 to 2026.

Image

Description of figure 18: An area chart illustrating the combined moderate scenarios for daily hospital admissions across Wales during the 2025 to 2026 winter season for influenza, RSV, COVID-19, and "Other infections".

Source: SRE calculations.

Figure 19: combined severe scenario – daily hospital admissions (including ICU admissions) for winter 2025 to 2026.

Image

Description of figure 19: An area chart illustrating the combined severe scenarios for daily hospital admissions across Wales during the 2025 to 2026 winter season for influenza, RSV, COVID-19, and “Other infections”.

Source: SRE calculations.

The majority of winter pressure on the hospitals can be attributed to “other infections” defined above (not COVID-19, RSV or influenza), that accounted for 61% to 73% of admissions due to infectious diseases in the past three winters. COVID-19 admissions accounted for 8 to 23%, influenza admissions 8 to 15% while RSV accounted for 5 to 6% within the same time frame. According to modelling projections, the severe combined admissions scenario anticipates a peak of 296 admissions on 24 December 2025, whereas the moderate scenario estimates a maximum of 214 admissions on the same day.

Figure 20: combined moderate scenario – daily occupancy (including ICU admissions) for winter 2025 to 2026.

Image

Description of figure 20: An area chart illustrating the combined moderate scenarios for all daily hospital occupancy across Wales during the 2025 to 2026 winter season for influenza, RSV, COVID-19, and ‘Other infections’.

Source: SRE calculations

Figure 21: combined severe scenario – daily occupancy (including ICU admissions) for winter 2025 to 2026.

Image

Description of figure 21: An area chart illustrating the combined severe scenarios for daily hospital occupancy across Wales during the 2025 to 2026 winter season for influenza, RSV, COVID-19, and ‘Other infections’.

Source: SRE calculations

The severe combined occupancy scenario estimates a peak of 2,443 occupied beds on 5 January 2026, whereas the moderate scenario estimates a maximum of 1,885 beds occupied on 7 January 2026.

Part 6: emergency department attendances

Top line summary

There were 51,790 Emergency Department (ED) attendances due to respiratory problems in 2024 to 2025 — significantly more than the previous two winters.

The modelling scenarios suggest a peak of 264 to 417 ED attendances per day in Wales over the 2025 to 2026 winter period.

ED attendances

ED attendances are defined in the NHS Wales Data Dictionary as individual visits by patients to an accident and emergency department for treatment provided by the accident and emergency service. For winter modelling, the focus is on attendances related to respiratory issues, which represent approximately 8% of all ED attendances throughout the winter.

Figure 22: 7-day rolling average of daily ED attendances due to respiratory problems, between April 2020 and March 2025.

Image

Description of Figure 22: A line chart for the 7-day rolling average of daily ED occupancy, in Wales.

Source: Digital Health and Care Wales (DHCW).

In the winter of 2024 to 2025, there were 51,790 ED attendances due to respiratory problems — significantly more than the previous two years (48,048 in 2022 to 2023 and 50,506 in 2023 to 2024). Of all ED attendances, 35% resulted in admission in a same or different hospital, 6% were discharged, and 45% required no follow-up [footnote 1]. ED attendances due to respiratory problems peaked at 343 in the first week of January 2025. This is consistent with trends observed in the previous years where ED attendances have typically peaked in the last week of December or the first week of January (with the exception of the pandemic years).

Figure 23: daily ED attendances due to respiratory problems scenarios, winter 2025 to 2026.

Image

Description of Figure 23: A line chart showing projected daily ED attendances for respiratory problems in Wales from September 2025 to April 2026 under three scenarios: (severe, moderate, and low), showing potential variation in demand over time.

Source: Digital Health and Care Wales (DHCW).

To create scenarios for ED attendances, the following statistical techniques were used:

Table 6: names of ED attendance scenarios and the statistical models applied:

Scenario NameTechnique
LowSARIMA
ModerateETS
SevereRepeat of (2022 to 2023) data

The low scenario estimates a peak of 264 ED attendances on 1st January 2026, while moderate and severe scenarios predict a peak of 312 and 417 ED attendances on 30 December 2025.
Footnotes

[1]. The following categories cover the remaining 14%: Self-Discharge, Referred - Other HCP (Healthcare Professional), (Unknown), A and E Follow-Up, Transferred Other LHB, Referred - GP, Died in Department, Referred – Outpatients, DOA (Dead On Arrival).

Part 7: capacity and resilience

Top line summary

In Winter 2024 to 2025, 84 to 87% of all beds and 55 to 63% of paediatric beds were occupied on average.

The number of delayed transfers declined from 1,750 in April 2023 to 1,275 in July 2025.
NHS hospital beds

Figure 24: Average daily available and occupied beds in Wales, between April 2014 and March 2025.
Image

Description of Figure 24: A line chart showing trends in average daily available and occupied hospital beds in Wales from April 2014 to March 2025, highlighting changes in hospital capacity and bed occupancy over time.

Source: Stats Wales and Digital Health and Care Wales (DHCW).

During the winter of 2024 to 2025, average daily bed numbers available ranged from 10,260 to 10,670, with bed occupancy ranging between 84 to 87%. The percentage of beds occupied has remained relatively stable over the past three winters, consistently above 80% but never exceeding 90%. Historical data from April 2014 to March 2025 indicate that the number of beds occupied by patients in hospitals in Wales did not surpass the total number of available beds. 

This contrasts with the widely reported demand pressures in hospitals, where patients frequently experience difficulty obtaining hospital beds. Such discrepancies may result from staffing shortages within particular hospitals, variations in the availability of specialised care beds (such as ICU, cardiac, or paediatric units), surges in emergency admissions during peak periods, or differing hospital policies and procedures.

Wales had between 399 and 422 paediatric beds available during the winter of 2024 to 2025, with occupancy ranging between 55 to 63%. As noted by Stats Wales, the highest occupancy in the 2024 to 2025 winter occurred in November, reaching 63%, which was lower than the peak occupancy of 69% observed in the previous winter, 2023 to 2024. The introduction of the RSV maternal vaccination programme may have contributed to a reduction in paediatric bed occupancy.

Referrals

The patients receiving referrals from a GP or other medical practitioner to hospital for treatment in the NHS in Wales are categorised by the wait times: up to 26 weeks, 26 to 36 weeks and above 36 weeks. As noted by Stats Wales, the total number of patients waiting to start treatment rose from 775,031 in April 2024 to 802,268 in November 2024, after which it began to decrease. Most patients had to wait for less than 26 weeks. The number of patients waiting over 36 weeks reached a peak of 284,586 in December 2024.

Delayed transfers of care

As noted by Stats Wales, a delayed discharge occurs when a patient who is clinically ready for discharge cannot leave hospital because the necessary ongoing care and support or suitable accommodation for them is not yet accessible. Delayed discharge can adversely affect patient health and cause significant distress due to unnecessarily prolonged hospital stays. Additionally, such delays impact the overall productivity of the NHS by increasing waiting times for care, as they reduce the number of beds available for other patients.

The Welsh Government releases data on pathway of care delays, measuring the number of adults in NHS hospital beds who are deemed 'clinically optimised' and ready to return home or transition to the next stage of care but have experienced a transfer delay exceeding 48 hours. As noted by Stats Wales, the number of delayed transfers of care declined from 1,750 in April 2023 to 1,275 in July 2025 (-27%). Most of the delays were due to assessment issues including awaiting social worker allocation, awaiting completion of assessment by social care, awaiting completion of assessment nursing and awaiting joint assessment.

Part 8: primary care (GP consultations and vaccines)

Top line summary

Adults and children had fewer GP consultations for acute respiratory infections (ARI) in winter 2024 to 2025 than in 2023 to 2024.

Modelling scenarios suggest that during December to early January in the 2025 to 2026 winter period, GP consultation rates for acute respiratory infection (ARI) in Wales are expected to peak at 54 to 369 consultations per day among children and 16 to 106 consultations per day among adults.

Influenza vaccine uptake is on a decline in adults aged 65 and above and in individuals aged 6-64 years at risk. Both groups did not meet their target uptake rates in the winter of 2024 to 2025.
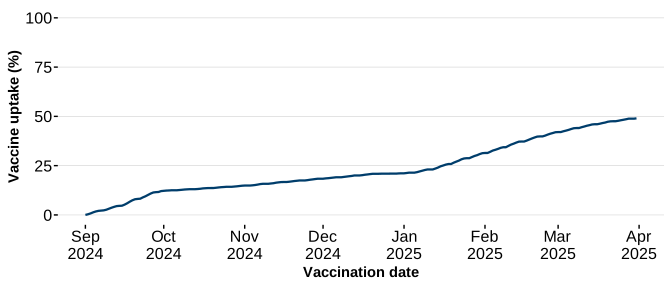
RSV vaccination program started in September 2024 in Wales. The uptake levels reached 40% in pregnant women who have delivered and 49% amongst adults aged 75 to 79 by the end of March 2025.
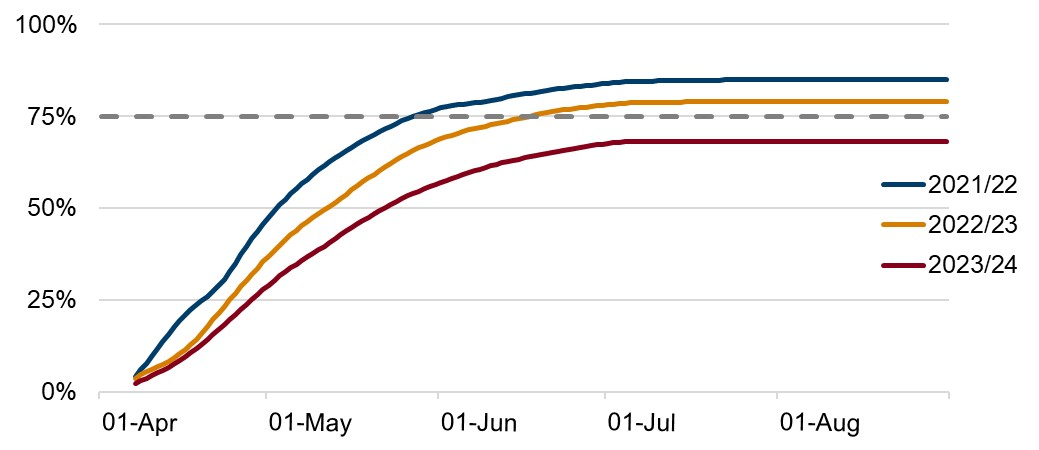
The COVID-19 vaccine uptake rates for adults aged 75 and above and for immunocompromised individuals, has decreased for each vaccine programme rollout (for Autumn and Spring Booster Programmes) for the past 3 years.

The COVID-19 Vaccine uptake among individuals aged 75+ and the immunocompromised has declined each year since 2021 to 2022:

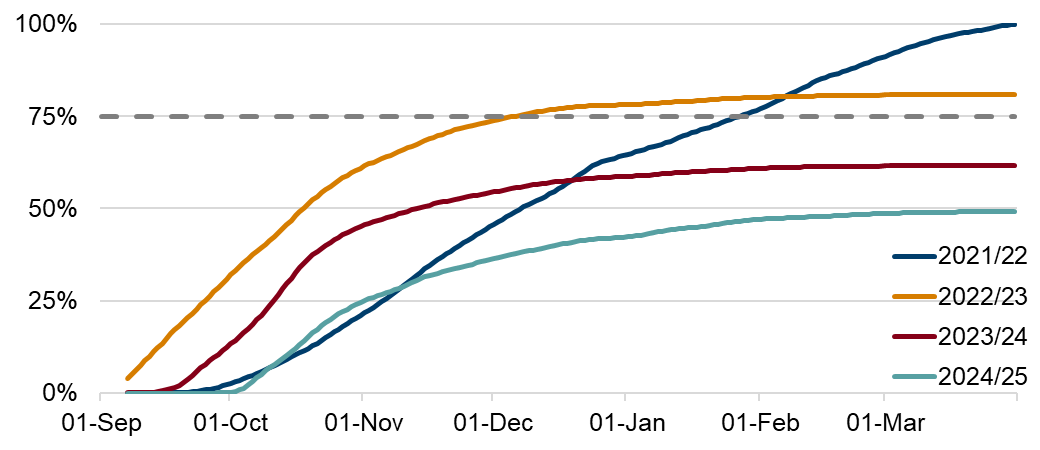
  • Autumn Booster (age 75 and over): Dropped from ~100% in 2021 to 2022 to 71% by March 2025.
  • Spring Booster (age 75 and over): Fell from ~85% in 2021 to 2022 to 68% by March 2025.
  • Autumn Booster (Immunocompromised): Declined from ~100% in 2021 to 2022 to 49% by March 2025.
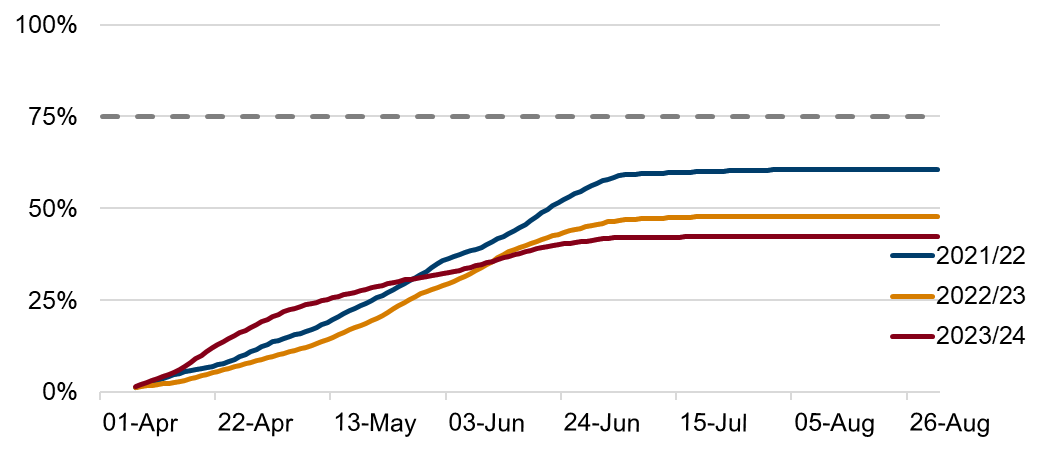
  • Spring Booster (Immunocompromised): Reduced from ~61% in 2021 to 2022 to 42% by March 2025.

GP ARI consultation rate

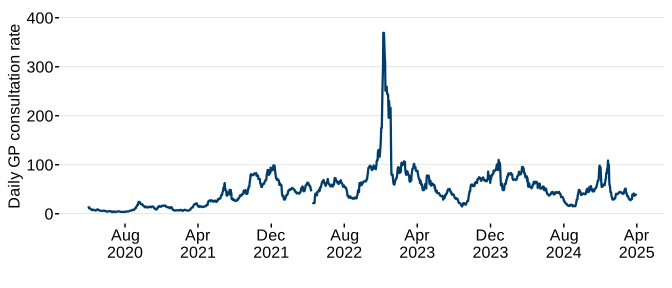
Acute respiratory infection (ARI) refers to a sudden onset of one or more respiratory symptoms, where clinical judgement determines the illness is caused by a viral infection such as COVID-19, flu, or RSV. GP consultations data related to acute respiratory infections are derived from the GP Sentinel Surveillance of Infections Scheme in Wales. This program monitors a subset of GP practices within Wales. The diagnosis relies on syndromic evaluation of patients, without conducting specific pathological tests for confirmation. Therefore, it is likely that GP consultations might over or underestimate the incidence of infectious diseases. To standardise the data, consultation rates are normalised by the practice population, resulting in consultations per 100,000 population. The rates were examined across two age categories: children (ages 0 to 14) and adults (15 years and above).

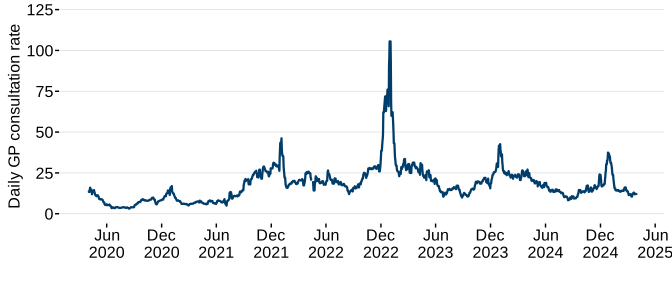
Figure 25: 7 day rolling average of daily ARI GP consultation rate in children (ages 0 to 14), between April 2020 and March 2025

Image

Source: Public Health Wales

[Note 1]: Consultation rate between 15 April 2022 and 18 April 2022 is not available. Stepped values have been imputed for those days, stepping from the 14 April 2022 average to the 19 April 2022 average. 

In the 2024 to 2025 winter, both adults and children had fewer GP consultations due to ARI compared to the 2023 to 2024 winter. The daily average GP consultation rate for children was higher than that for adults, with 47 consultations per 100,000 population for children compared to 17 consultations per 100,000 for adults.

Children’s rates peaked at 369, 110, and 109 GP consultations per 100,000 population during the winters of 2022 to 2023, 2023 to 2024, and 2024 to 2025, respectively while adult rates peaked at 106,43, and 37 during the same time period. The children’s peak GP consultation rate in 2022 to 2023 occurred in early December, while the peaks in 2023 to 2024 and 2024 to 2025 happened in the last week of December.

To create scenarios for GP consultation rates, the following statistical techniques were used:

Table 7: Names of GP consultation rate scenarios and the statistical models applied

Scenario NameTechnique
LowSARIMA
ModerateProphet
SevereRepeat of 2022 to 2023 data


Figure 26: Daily ARI GP consultation rate scenarios in children, winter 2025 to 2026

Image

Source: SRE calculations

The Severe, Moderate, and Low scenarios for GP consultation rates in children are estimated to reach maximum values of 369, 138, and 54 consultations per 100,000 population on December 9 to 11 December, December 17, and December 26, respectively.

Figure 27: 7 day rolling average of daily ARI GP consultation rate in ages 15 years and above, between April 2020 and March 2025 [Note 1]

Image

Source: Public Health Wales

[Note 1]: Consultation rate between 15 April 2022 and 18 April 2022 is not available. Stepped values have been imputed for those days, stepping from the 14 April 2022 average to the 19 April 2022 average.

Figure 28: Daily ARI GP consultation rate scenarios in adults, winter 2025 to 2026

Image

Source: SRE calculations

The projected peak of GP consultation rates for adults under the severe, moderate, and low scenarios are 106, 46, and 16 consultations per 100,000 population, occurring on 30 December 2025 to 2 January 2026, 27 December and 26 December, respectively.

These peaks are estimated to occur on or around the bank holidays at Christmas time and New Year. Potential closures in GP surgeries may put additional pressure on out of hours services, minor injuries services, and emergency departments.

Influenza vaccine

A total of 651,455 flu vaccines were administered to all eligible groups which includes adults aged 65 and older, as well as individuals aged 6 months to 64 years at risk for the 2024 to 2025 winter season. This is approximately 20,000 fewer doses compared to the previous year (2023 to 2024) and 50,000 fewer than the year before that (2022 to 2023).

Figure 29: Total number of flu vaccines administered between 2019 to 2020 and 2024 to 2025, all eligibility groups.

Image

Source: Public Health Wales

Table 8: Total number of flu vaccines administered between 2019 to 2020 and 2024 to 2025, all eligibility groups

Vaccine SeasonTotal vaccines
2019 to 2020642,284
2020 to 2021742,085
2021 to 2022726,641
2022 to 2023701,966
2023 to 2024670,633
2024 to 2025651,455


Source: Public Health Wales

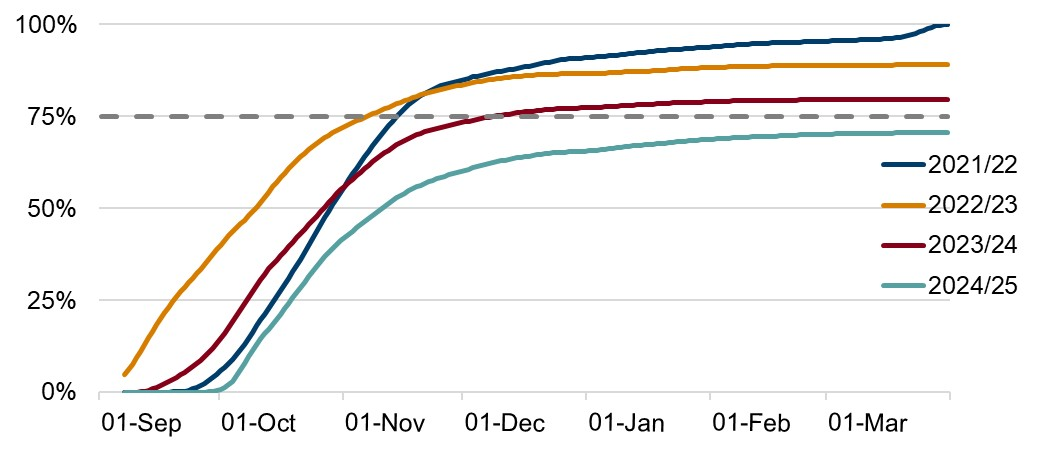
Figure 30: Weekly cumulative influenza vaccine uptake (%) in adults aged 65 and above administered between 2021 to 2022 and 2024 to 2025 in Wales, by season (winter). [Note 1]

Image

Source: Public Health Wales

[Note 1]: the horizontal grey dashed line indicates the vaccine uptake target for adults aged 65 and above.

The vaccination data was obtained from Public Health Wales goes up to the last week of March 2025. Vaccination data are aggregated by GP practice; however, not all practices submit data on a daily basis. To determine weekly uptake figures, we used the maximum value in the denominator (number of eligible individuals) for each week and the corresponding numerator (number of vaccinated individuals) to ensure most data available are captured, rather than relying solely on fluctuating numbers of daily submissions. The maximum vaccine uptake rates in the season are then reported. Please note that these figures may not align with those published by PHW who have access to more recent datasets.

The World Health Assembly resolution sets a target of 75% influenza vaccination coverage for older adults and people with chronic conditions. During the winters of 2021 to 2022 and 2022 to 2023, the vaccine uptake in adults aged 65 years and above met the 75% uptake target for flu vaccines. However, in 2023 to 2024 and 2024 to 2025, the uptake fell below the target, reaching a maximum of 72.3% and 70.1% respectively. All health boards did not meet the uptake target in the 2024 to 25 winter: 

  • Aneurin Bevan achieved a vaccine uptake of 73.5%
  • Betsi Cadwaladr reached 73.2%
  • Cardiff & Vale reached 70.1%
  • Cwm Taf Morgannwg reached 69.2%
  • Powys reached 69.5%
  • Swansea reached a maximum of 69.8%
  • Hywel Dda showed the lowest uptake among all health boards with 65.2%

Comparing these results to England, the flu vaccine uptake among adults aged 65 and above in England has declined from 82.3% during the 2021 to 2022 winter to 74.9% in the 2024 to 2525 winter. Notably, this marks the first time since the 2020 to 2021 winter that adults aged 65 and over did not meet the WHO target of 75%. Scotland data suggests a vaccine uptake of 74.1% in the winter 2024 to 2025 which falls just below the target as well (also lower than the vaccine uptake levels of 79.8% observed in Scotland in the 2023 to 2024 winter).

Figure 31: Weekly cumulative influenza vaccine uptake (%) in individuals aged 6m to 64 at risk administered between 2021 to 2022 and 2024 to 2025, by season (winter)

Image

Source: Public Health Wales

[Note 1]: the horizontal grey dashed line indicates the vaccine uptake target for individuals aged 6m to 64 at risk

The target for influenza vaccine uptake in individuals aged 6 to 64 years at risk was set at 55%. From 2021 to 2022 to 2024 to 2025, this target was not met at a Wales level or at the local health board level. The vaccine uptake levels in individuals aged 6 to 64 years at risk decreased from 48.1% in 2021 to 2022 to 36.8% in 2024 to 2025. The percentage-point drop for the under 65 years who are at-risk in England was similar, from 52.9% in winter 2021 to 2022 to 40.0% in winter 2024 to 2025.

RSV vaccine

RSV vaccination in the UK was introduced for women who are at least 28 weeks pregnant, to protect their infants, and to adults aged 75 to 79 years of age, using the Abrysvo® RSV vaccine (Pfizer Limited). Scotland began RSV vaccine rollout from 12 August 2024 and Wales, England and Northern Ireland in September 2024.

As of 31st March 2025, 5,646 doses of RSV vaccines were administered to pregnant women that have delivered, and 75,790 doses were administered to adults aged 75 to 79. This translates to vaccine uptake levels of 40% in pregnant women who have delivered and 49% amongst adults aged 75 to 79. 

Figure 32: Daily cumulative RSV vaccine uptake (%) administered in pregnant women in 2024 to 2025 winter

Image

Source: Public Health Wales

In England, the vaccination programme commenced in September 2024 and achieved cumulative coverage rates of 46.7% by December and 60.3% by March 2025 among adults aged 75 to 79. The RSV vaccination programme for older adults and pregnant women in Scotland commenced in August 2024. By early September, uptake in the older adult population reached 52.4% eligible vaccinated by 9 September 2024, and by 27 November 2024, it was 68.6%. As of 11 May 2025, 203,997 older adults in Scotland received an RSV vaccine with uptake rate of 70.6%, and 16,449 pregnant women who turned 28 weeks from 1 August 2024 received an RSV vaccine, with uptake rate of 49.6% over the entirety of the programme. Vaccine uptake rates in Wales are comparatively lower across both groups. 

Figure 33: Daily cumulative RSV vaccine uptake (%) administered in adults aged 75 to 79 in 2024 to 2025

Image

COVID-19

There have been a number of COVID-19 vaccine programmes in Wales rolled out since December 2020. Usually, there are 2 vaccine programmes a year; an autumn booster (typically starting September or October time) and a spring booster (typically starting around April time). For our analysis, we assumed for each year, the Autumn Booster programme ran from 1 September to 31 March, and the Spring Booster programme from 1 April to 31 August. We also assumed that the eligible populations were individuals aged 75 and above and immunocompromised individuals.

Table 9: Total number of COVID-19 vaccines administered between 2021 to 2022 and 2024 to 2025, all eligibility groups [Note 1]

Vaccine yearTotal vaccinesAutumn campaignSpring campaign
2021 to 2022782,034463,024319,010
2022 to 2023660,362362,074298,288
2023 to 2024587,725322,040265,685
2024 to 2025360,184286,90473,280


[Note 1]: The ‘vaccine year’ runs from 1 September one year to 31 August the following year.

To estimate the cumulative percentage uptake each season as shown in the following charts (Figures 34 to 37), the number of individuals vaccinated with a booster vaccine each day was calculated for each vaccine season (for the Autumn Booster Programme and for the Spring Booster Programme) initially. The cumulative number of individuals vaccinated throughout each vaccine season was calculated each day and divided by the eligible population[footnote1]. Finally, a 7-day rolling average of the cumulative percentages were calculated (Therefore, the first 6 days in each season were ignored). Due to start and end dates varying in earlier campaigns, there were occasions where the vaccine uptake slightly exceeded 100%. When this occurred, the vaccine uptake was capped at 100%.

Figure 34: Daily cumulative COVID-19 vaccine uptake for the predominant (booster) dose only (7-day rolling average %) administered in individuals aged 75 and above, September to March, 2021 to 2022 to 2024 to 2025 [Note 1].

Image

Source: Public Health Wales

[Note 1]: 29th February 2024 removed for convenience of display. The horizontal grey dashed line indicates the vaccine uptake target (75%). The dates 25 March 2022 to 31 March 2022 were capped at 100% for the booster dose for this chart.

The percentage of individuals aged 75 and above who were vaccinated each year as part of the Autumn Booster programme has decreased each autumn since the vaccine rollout began from around 100% at the end of the 2021 to 2022 Autumn Booster Programme (31 March 2022) to 71% by the end of the 2024 to 2025 Autumn Booster Programme rollout (31 March 2025).

Although very few booster doses were administered before 23rd September in Autumn 2021 to 2022, the rate of vaccine uptake was quicker and continued increasing for longer compared with subsequent years which plateaued earlier on in the Autumn Booster programme and at lower levels.

Figure 35: Daily cumulative COVID-19 vaccine uptake for the predominant (booster) dose only (7-day rolling average %) administered in individuals aged 75 and above, April to August, 2020 to 2021 to 2024 to 2025 [Note 1].

Image

Source: Public Health Wales

[Note 1]: Incomplete (early) data for 2025 not shown. The horizontal grey dashed line indicates the vaccine uptake target (75%). 

The percentage of individuals aged 75 and above who were vaccinated each year as part of the Spring Booster programme has decreased each spring since 2021 to 2022 from around 85% at the end of the 2021 to 2022 Spring Booster Programme (31 August 2022) to 68% by the end of the 2023 to 2024 Spring Booster Programme rollout (31 August 2024).

Figure 36: Daily cumulative COVID-19 vaccine uptake for the predominant (booster) dose only (7-day rolling average %), September to March, 2021 to 2022 to 2024 to 2025 [Note 1]

Image

Source: Public Health Wales

29th February 2024 removed for convenience of display. The horizontal grey dashed line indicates the vaccine uptake target (75%). The dates 28 March 2022 to 31 March 2022 were capped at 100% for the booster dose for this chart.

The percentage of immunocompromised individuals who were vaccinated each year as part of the Autumn Booster programme has decreased each autumn since the vaccine rollout began from around 100% at the end of the 2021 to 2022 Autumn Booster Programme (31 March 2022) to 49% by the end of the 2024 to 2025 Autumn Booster Programme rollout (31 March 2025).

The rate of vaccine uptake was slower in Autumn 2021 to 2022 compared with subsequent years, but the vaccine uptake rate continued increasing for longer.

Figure 37: Daily cumulative COVID-19 vaccine uptake for the predominant (booster) dose only (7-day rolling average %) administered in immunocompromised individuals, April to August, 2020 to 2021 to 2024 to 2025 [Note 1].

Image

Source: Public Health Wales

[Note 1]: Incomplete (early) data for 2025 not shown. The horizontal grey dashed line indicates the vaccine uptake target (75%). 

The percentage of immunocompromised individuals who were vaccinated each year as part of the Spring Booster programme has decreased each spring since 2021 to 2022 from around 61% at the end of the 2021 to 2022 Spring Booster Programme (31 August 2022) to 42% by the end of the 2023 to 2024 Spring Booster Programme (31 August 2024).

After an initial fast uptake, the rate of vaccine uptake was slower in the most recent Spring (2023 to 2024) compared with previous years.

Footnotes

[1] The ONS population mid-year estimates were used to calculate the population aged 75 years and over. The estimated number of immunocompromised eligible individuals for the whole period covered (2021 to 2022 to 2024 to 2025)  was taken from the Wales COVID-19 Vaccination Programme report from PHW dated 22 April 2025.

Part 9: UK and international comparisons and extreme weather conditions

UK comparisons

RSV

Overall RSV activity across all UK nations started around week 42 2024 (week starting 14 October 2024), and peaked across nations around weeks 47 to 49 2024 (18 November to 8 December 2024). The timing of peak RSV activity was similar to the 2023 to 2024 season in England and Wales, and slightly later than in previous seasons in Scotland and Northern Ireland.

Flu

In 2024 to 2025, The influenza-like illness (ILI) GP consultations rate for each UK nation peaked December to early January (with a temporary dip over the Christmas to New Year period) reaching medium levels (according to ‘moving epidemic method’, ‘MEM’, thresholds). Wales, Scotland and Northern Ireland had peak ILI GP consultation rates of around 35 to 40 GP consultations per 100,000) in the winter of 2024 to 2025. In both Wales and Northern Ireland, the 2024 to 2025 peak exceeded 2023 to 2024 and was similar to 2022 to 2023. In Scotland the 2024 to 2025 peak exceeded those of the previous two years (2022 to 2023 and 2023 to 2024). In England the 2024 to 2025 peak levels (around 25 per 100,000) did not reach those observed in the winter of 2022 to 2023. Direct comparisons can not be made between the nations due to the differing methodologies in data collections.

Hospital admissions due to flu reached high levels (according to the MEM thresholds) in England in 2024 to 2025 with a peak of 16.18 weekly admissions per 100,000 (in week 52, 2024). Scotland and Northern Ireland reached peaks of 29 and 21.3 weekly hospital admissions per 100,000 population respectively in weeks 52 and 51 2024 respectively. Wales peaked at 306 weekly admissions in week 52 equating to around 9.6 per 100,000 population. Different data collection methods were used for each nation, so these admission rates are not directly comparable between countries. The peak hospital admissions in each UK nation is much higher than the peak of the winter prior (2023 to 2024), around double in England Wales and Northern Ireland and an even higher multiple in Scotland. For England, Scotland and Northern Ireland, the 2024 to 2025 peak is similar to that of 2022 to 2023.

Flu test positivity peaked at around 28% (Respiratory Datamart) for England, 30% for Wales, 35% for Northern Ireland and 36% for Scotland. For Scotland and Northern Ireland, their peak positivity percentage exceeded the peaks of the previous two years (in 2022 to 2023 and 2023 to 2024). However, in England and Wales, although the peak for test positivity was higher last winter in 2024 to 2025 compared with the year prior (2023 to 2024), it was lower than the test positivity peak in 2022 to 2023. Different testing methods were used in each UK nation, so the flu test positivity percentages are not directly comparable between the UK countries.

International comparisons

A literature review of epidemiological data from the southern hemisphere was conducted to inform projections for the upcoming winter season in Wales. 

In Australia, from mid-March to mid-June 2025, the weekly proportion of FluTracking survey participants with new fever and cough symptoms was lower than those seen at the same time in 2022, 2023, 2024, and the five-year average; however, since early July the weekly proportion has been similar to the same time last year and the five-year average. Influenza cases are following a similar trend seen at the same time last year.

From January to mid-June 2025, influenza-like illness (ILI) GP consultation rates were consistent with rates seen in 2024. Since early June 2025, GP consultations for influenza-like illness consultation rates increased and now exceed the five-year average but remain below last year's figures. 

Patients admitted to sentinel hospitals with influenza were mostly admitted with influenza A (predominantly H1N1). There was a comparatively higher proportion of influenza B cases this season than was seen in 2024 and 10.7% more deaths due to influenza than was observed in the first 6 months of 2024. Over 98% of influenza isolates in 2025 match this year's vaccine components.

Between 2023 and 2025, COVID-19 was the leading cause of acute respiratory infection deaths, mainly among older adults although the number of deaths in the first 6 months of 2025 were substantially lower than those observed in 2024 and 2023.

In Hong Kong, the ILI consultation rate from 3 to 9 August was at baseline level, running similar to, or as of this week, lower than last year. In terms of hospital admissions, the baseline threshold was exceeded and peaked in January then decreased to a low level in late March, with a peak rate lower than that recorded last year. In Singapore, the polyclinic attendances for acute respiratory infection are similar to the attendances seen in 2024.

WHO is monitoring 6 variants of COVID-19 at present. NB.1.8.1 (Nimbus) is currently dominant however not associated with more severe disease and risk evaluation by the WHO is low. The XFG (Stratus) variant is currently increasing in prevalence and is associated with rapid spread but similarly, not with severity of symptoms.

Using the international picture to estimate what we may see in Wales, the flu season may see similar figures to 2024 although there could be increased proportion of influenza B and a potential shift in the dominant form of COVID-19. Vaccine effectiveness is expected to be maintained against symptomatic and severe disease.

Extreme weather conditions

The UKHSA published the fourth Health Effects of Climate Change (HECC) in the UK: state of the evidence report in December 2023. The HECC report summarises current evidence on the health impacts of climate change and effective interventions. Without adaptation, heat and cold related mortality in the UK is projected to rise due to climate change and demographic shifts. Increasing exposure to extreme weather will affect more people, with cold related deaths also rising due to an ageing population. While these impacts are widespread, their severity will vary by geography and sociodemographic factors.

Part 10: conclusions

Conclusions

The upcoming 2025 to 2026 winter season is expected to see a rise in respiratory viruses, as is typical each year. This leads to higher demand on primary (GP consultations) and secondary care services (admissions, ED attendances etc). The scenarios in this paper give an insight into how these viruses may impact the demand for healthcare in Wales and help in planning for a surge in capacity that might be needed to accommodate these excess winter pressures.

Vaccination programs are crucial in preventing infectious diseases. The RSV vaccination program was launched in September 2024, and the year-long program will continue through September 2026. High uptake is expected to significantly reduce admissions among infants (1 to 6 months) and adults (75 to 79 years). COVID-19 admissions are declining. The modelling in this report estimates earlier impact this winter. Flu vaccine uptake has decreased since 2021 to 2022, which, if the trend continues, may place additional strain on hospital admissions. The antigenicity of circulating influenza strains remains a critical factor influencing the severity of the flu season, although it is challenging to predict accurately. As a result, it's difficult to determine how severe each flu season will be.

Over the winter months (1st September to 31st March), there will be continued surveillance of admissions due acute respiratory viruses. The winter modelling scenarios presented in this report will be utilised alongside short-term projections, which will be updated as additional data are collected throughout the winter and presented in regular surveillance reports. Collectively, these models will serve as effective tools to support decision-making in healthcare planning across Wales.

Part 11: appendix

Retrospective analysis

To determine the effectiveness of the winter modelling produced and published in the 2024 to 2025 winter modelling report, we have compared the models with the recent admissions data received for the winter 2024 to 2025 period. Refer to the 2024 to 2025 winter modelling report for further detail on the definitions of each scenario shown (In Figures A1 to A4) below:

Figure A1: Comparison of flu and pneumonia daily admissions scenarios vs actuals in Wales between September 2024 and March 2025

Image

Description of Figure A1: A line chart showing projected daily hospital admissions due to flu and pneumonia in Wales, from September 2024 to March 2025, under four different scenarios, alongside actual admissions for comparison.

Source: Digital Health and Care Wales and SRE calculations

2024 to 2025 scenarios for flu and pneumonia predicted daily admissions peaking between 88 (scenario 1) and 132 (scenario 3) during the first week of January. Scenario 4 suggests a smaller peak of 63 in the third week of January (26 January 2025). Actual admissions data closely followed scenario 2, showing similar peak height and timing.

Figure A2: Comparison of RSV paediatric (ages 0 to 4) daily admissions scenarios vs actuals between September 2024 and March 2025

Image

Description of Figure A2: A line chart showing modelled daily hospital admissions due to RSV in children aged 0 to 4 years in Wales from September 2024 to March 2025 under four scenarios, alongside actual admissions for comparison.

Source: Digital Health and Care Wales and SRE calculations

2024 to 2025 RSV Scenarios 1 to 3 suggested a peak of 36-63 daily admissions during the first week of December while Scenario 4 suggested an early peak of 40 admissions in the first week of November (06 November 2024). Actuals admissions showed a peak of 47 admissions on 22 November 2024.

Figure A3: Comparison of COVID-19 daily admissions scenarios vs actuals between July 2023 and March 2024

Image

Description of Figure A3: A line chart showing modelled daily hospital admissions due to COVID-19 in from September 2024 to March 2025 under 4 scenarios, alongside actual admissions for comparison.

Source: Digital Health and Care Wales and SRE calculations

2024 to 2025 COVID-19 Scenario 1 indicated a flat time series with a maximum of 24 daily admissions while Scenarios 2 and 3 both suggested three peaks, occurring in the second weeks of September, December, and March (daily peaks of 42, 54, and 58 vs 77, 110, and 116 daily admissions respectively). Scenario 4 suggested two peaks: 39 admissions in the first week of October and 32 admissions in the first week of January. By contrast, actuals data showed no peak in winter and continued to show a decreasing trend through the winter.

Figure A4: Number of samples submitted for full-panel PCR testing in a non-sentinel setting across Wales, from April 2018 to March 2025.

Image

Description of Figure A4: A line chart showing the number of samples submitted for full-panel PCR testing in non-sentinel settings across Wales from April 2018 to March 2025, highlighting trends in testing volume over time.

Source: Public Health Wales

Testing protocols for infectious pathogens have evolved significantly since the onset of the pandemic. For example, as of January 2022, PCR samples processed for Coronavirus in NHS Wales laboratories can also be tested for influenza (flu) and respiratory syncytial virus (RSV). Testing may impact our admissions analysis, as ICD-10 codes depend on the accurate identification of the causative pathogen. Therefore, limited testing may result in an underestimation of admissions. Overall, testing has increased since the pandemic. During the winter of 2024/25, 32,390 samples were received for multiplex panel testing in non-sentinel context (hospitals and non-sentinel GPs). This is lower than the past two years, where 35,988 and 47,780 tests were used. However, to account for additional admissions that may not have been tested, broader categories such as pneumonia (J12-J18) and acute bronchitis and bronchiolitis (J20-J22, codes excluding RSV) are included in the combined scenarios.

Comparison of DHCW and ICNET datasets

Our winter modelling uses Patient Episode Database for Wales (PEDW) hospital admissions data from Digital Health and Care Wales (DHCW). However, due to a lag in clinical coding and in receiving PEDW data from DHCW, we use ICNET data from Public Health Wales (PHW) data for our actuals (observed data) for tracking throughout the winter. The data sources differ for a few reasons:

  • the influenza, RSV and COVID-19 data from PHW includes lab-confirmed results only and includes inpatients only
  • the PEDW data from DHCW is based on ICD10 codes and includes day case patients 

To make the data sources more comparable, the ICD-10 codes for influenza and RSV were refined for specific pathogens. Influenza is now identified using ICD-10 codes J09 to J11 instead of J09 to J18, while RSV is identified with J12.1, J20.5, J21.0, and B97.4 instead of J20 to J22. These narrower code selections resulted in improved concordance between the datasets (see Figures A5 to A7).

Figure A5: Comparison of influenza admissions from DHCW and ICNET (PHW), Winter 2025 to 2026

Image

Description of Figure A5: A line chart showing daily hospital admissions due to influenza in Wales, from September 2024 to March 2025, comparing data from DHCW and ICNET (PHW). The lines represent admissions reported by each data source over the same period.Source: Digital Health and Care Wales and Public Health Wales.

Source: Digital Health and Care Wales and Public Health Wales

Figure A6: Comparison of RSV admissions (all ages) from DHCW and ICNET (PHW), Winter 2025 to 2026

Image

Description of Figure A6: A line chart showing daily hospital admissions due to RSV across all age groups in Wales, from September 2024 to March 2025. The lines represent admissions reported by DHCW and ICNET (PHW), allowing comparison between the two data sources.

Source: Digital Health and Care Wales and Public Health Wales

Figure A7: Comparison of COVID-19 admissions from DHCW and ICNET (PHW), Winter 2025 to 2026

Image

Description of Figure A7: A line chart comparing daily COVID-19 hospital admissions in Wales from September 2024 to March 2025, highlighting trends and differences between admissions reported by DHCW and ICNET (PHW).

Source: Digital Health and Care Wales and Public Health Wales

The five harms

Using the five harms framework, originally developed to assess risks in relation to Covid-19, Table 1 provides an assessment of potential harms arising from socioeconomic deprivation in relation to winter illnesses. Contributing factors are also given to show the mechanisms by which these harms may arise. Deprivation factors arising from low income, such as poor diet and fuel poverty, have been associated with increased vulnerability to respiratory illnesses (such as influenza and Covid-19) and exacerbation of various other health conditions.

Assessment of potential harms arising from socioeconomic deprivation in relation to winter illness

Direct Harms

Direct harms include:

  • increased individual vulnerability to winter illness
  • greater likelihood of severe illness requiring NHS care
  • exacerbation of pre-existing conditions
  • health and care staff burnout
  • increased risk of poor care due to capacity issues in health settings

Contributing factors to direct harm include:

  • hunger and malnutrition
  • obesity and overweight
  • cold, damp or poorly ventilated homes
  • inadequate ventilation
  • overcrowding in the home
  • occupational exposure to contagious illness
  • pre-existing comorbidities
  • high demand across NHS services
  • high health and care staff sickness absence rates over winter

Indirect harms 

Indirect harms include:

  • condition deterioration and pain management for patients awaiting planned procedures
  • mental health concerns for patients facing delays
  • staff burnout and mental ill-health from long-term increased workload beyond winter
  • onward transmission of illness
  • delayed medical care due to financial hardship
  • adverse impacts on children’s education

Contributing factors to indirect harm include:

  • cancellation of planned care due to winter pressures
  • backlog of planned care due to cancelations to cope with winter pressures
  • inability to take sickness absence from work due to financial hardship
  • public perception of capacity issues and subsequent risks of poor service provision
  • public fear of contracting winter illnesses
  • absence from school due to sickness or needing to care for a sick family member
     

Harm arising from population-based health protection measures (such as, educational, psychological, or isolation)

Risks arising from population-based health protection measures include:

  • communication challenges for some patients
  • mental distress

Contributing factors to harm arising from population-based health protection measures include:

  • mask mandates in medical settings in the event of high levels of respiratory illness
  • increase in digital default appointments
  • restrictions on hospital visiting in the event of high levels of illness

Economic harms

Risks from economic harm (macroeconomic factors) includes:

  • lost working days
  • lower labour market participation
  • reduced tax revenue
  • increased welfare spending
  • households cutting back on spending

Risks from economic harm (microeconomic factors) includes:

  • loss or reduction of income
  • cutting back on essential expenditure

Contributing factors to economic harm include:

  • sickness absence and long-term illness (for example, long COVID)
  • absence from work due to caregiving
  • benefits payments for long-term sickness
  • increased budget pressure due to higher energy costs over winter

Harms arising from exacerbation or introduction of health inequalities

Risks from exacerbation or introduction of health inequalities include:

  • difficulty in accessing medical care
  • exacerbation of pre-existing conditions
  • higher risk of contracting illness at work

Contributing factors to exacerbation or introduction of health inequalities include:

  • public transport costs related to attending appointments or accessing care
  • pistance to GP surgery, pharmacy, hospital
  • poor weather conditions affecting public transport
  • lower provision of medical care services in deprived areas despite increased need
  • digital exclusion
  • higher likelihood of existing poor health
  • lower uptake of screening services and preventative programmes including vaccinations
  • overrepresentation in occupations where it is not possible to work from home (such as, manufacturing, or hospitality)
  • higher risk of occupational exposure to illness for ethnic minority groups, who are overrepresented in the health and care workforce
  • reliance on or ineligibility for statutory sick pay leading to presenteeism

Clinical coding issues

The ICD-10 coding is used to systematically record and analyse mortality and morbidity data in hospitals in the UK. However, the completion of coding is often time-consuming, and experiences delays of several months. Therefore, the admissions reported for the financial year 2024 to 2025 in this paper are likely to be underestimated.

Forecasting model advantages and disadvantages

Moving Averages

Description: A statistical technique where values equal the observed value from the previous season or an average of previous seasons.

Advantages:

  • simple to implement and understand
  • requires no estimation of parameters

Disadvantages:

  • assumes seasonal patterns remain unchanged over time
  • treats all observations equally, ignoring recency effects

ETS (Exponential Smoothing)

Description: Applies exponentially decreasing weights to past observations, giving more influence to recent data in future predictions.

Advantages:

Requires less computational time than SARIMA • More flexible than moving averages

Disadvantages:

  • may not capture complex autocorrelation structures
  • sensitive to outliers
  • performs better for short-term forecasts

SARIMA (Seasonal Autoregressive Integrated Moving Average)

Description: An extension of ARIMA, designed specifically for time series data with seasonal patterns.

Advantages:

  • highly flexible in capturing complex seasonal patterns and trends

Disadvantages:

  • sensitive to parameter selection
  • computationally intensive
  • performs better for short-term forecasts

Prophet

A machine-learning technique using an additive model with yearly, weekly, and daily seasonality, plus holiday effects.

Advantages: 

  • robust to outliers, missing data, and sudden changes
  • effective when seasonality is regular and well-defined
  • easy to implement and fast to run

Disadvantages:

  • poor handling of complex seasonality (SARIMA performs better here)
  • over-reliance on default parameters

Mechanistic compartment models

Mathematical models that divide populations into compartments (for example, susceptible, infected, or recovered) and simulate transitions between them.

Advantages:

  • can model effects of interventions like vaccinations or NPIs
  • performs better for long-term forecasts

Disadvantages:

  • heavily reliant on accurate model parameters
  • sensitive to initial conditions

Peaks analysis

Table A1: Peaks in 7-day rolling averages of influenza admissions between the winters of 2022 to 2023 and 2024 to 2025. [Note 1]

WinterPeak admissionPeak date
1 Sep 2022 to 31 Mar 202310924 December 2022
1 Sep 2023 to 31 Mar 20243701 February 2024
1 Sep 2024 to 31 Mar 20247801 January 2025 and 02 January 2025

Source: Digital Health and Care Wales

Note 1: Data for 2020 to 2021 and 2021 to 2022 winters are not shown due to low numbers

Table A2: Peaks in 7-day rolling averages of RSV paediatric admissions between the winters of 2022/23 and 2024/25. [Note 1]

WinterPeak admissionPeak date
1 Sep 2022 to 31 Mar 20232318 December 2022
1 Sep 2023 to 31 Mar 20242111 November 2023
1 Sep 2024 to 31 Mar 202519

17 November 2024 and

18 November 2024

Source: Digital Health and Care Wales

Note 1: Data for 2020 to 2021 and 2021 to 2022 winters are not shown due to low numbers

Table A3: Peaks in 7-day rolling averages of COVID-19 admissions between the winters of 2020 to 2021 and 2024 to 2025. [Note 1]

WinterPeak admissionPeak date
1 Sep 2020 to 31 Mar 202117102 January 2021
1 Sep 2021 to 31 Mar 20229606 January 2022
1 Sep 2022 to 31 Mar 20237324 December 2022 
1 Sep 2023 to 31 Mar 20244003 October 2023
1 Sep 2024 to 31 Mar 20252508 October 2024

Source: Digital Health and Care Wales

Note 1: COVID-19 admissions may show peaks during the summer that exceed those observed in the winter.

Table A4: Peaks in 7-day rolling averages of ED attendances due to respiratory problems between the winters of 2020 to 2021 and 2024 to 2025.

WinterPeak ED attendancePeak date
1 Sep 2020 to 31 Mar 202120216 September 2020
1 Sep 2021 to 31 Mar 202227221 October 2021
1 Sep 2022 to 31 Mar 202341730 December 2022
1 Sep 2023 to 31 Mar 20242861 January 2024
1 Sep 2024 to 31 Mar 20253431 January 2025

Source: Digital Health and Care Wales

Table A5: Peaks in 7-day rolling averages of GP consultation rate due to acute respiratory infections in children (ages 0 to 14 years) between the winters of 2020 to 2021 and 2024 to 2025.

WinterPeak GP ratePeak date
1 Sep 2020 to 31 Mar 20212416 September 2020
1 Sep 2021 to 31 Mar 2022999 December 2021
1 Sep 2022 to 31 Mar 20233699 December  to 11 December 2022
1 Sep 2023 to 31 Mar 202411028 December 2023
1 Sep 2024 to 31 Mar 202510926 December 2024

Source: Public Health Wales

Table A6: Peaks in 7-day rolling averages of GP consultation rate due to acute respiratory infections in adults (ages 15 years and above) between the winters of 2020 to 2021 and 2024 to 2025.

WinterPeak GP ratePeak date
1 Sep 2020 to 31 Mar 2021174 January 2021
1 Sep 2021 to 31 Mar 2022464 January 2022
1 Sep 2022 to 31 Mar 202310630 December 2022 to 2 January 2023
1 Sep 2023 to 31 Mar 2024432 January 2024
1 Sep 2024 to 31 Mar 20253726 December 2024

Totals analysis

Table A7: Total influenza admissions, between the winters of 2022 to 2023 and 2024 to 2025.


WinterTotal Admissions
1 Sep 2022 to 31 Mar 20233,892
1 Sep 2023 to 31 Mar 20242,437
1 Sep 2024 to 31 Mar 20254,349

Table A8: Total RSV paediatric admissions (ages 0 to 4 years), between the winters of 2022 to 2023 and 2024 to 2025.

WinterTotal Admissions
1 Sep 2022 to 31 Mar 20231,460
1 Sep 2023 to 31 Mar 20241,385
1 Sep 2024 to 31 Mar 20251,020

Table A9: Total COVID-19 admissions, between the winters of 2020 to 2021 and 2024 to 2025.


WinterTotal Admissions
1 Sep 2020 to 31 Mar 202114,970
1 Sep 2021 to 31 Mar 202214,127
1 Sep 2022 to 31 Mar 20238,315
1 Sep 2023 to 31 Mar 20244,248
1 Sep 2024 to 31 Mar 20252,228

Table A10: Total ED attendances due to respiratory problems, between the winters of 2020 to 2021 and 2024 to 2025.

WinterTotal Admissions
1 Sep 2020 to 31 Mar 202131,903
1 Sep 2021 to 31 Mar 202245,355
1 Sep 2022 to 31 Mar 202348,048
1 Sep 2023 to 31 Mar 202450,506
1 Sep 2024 to 31 Mar 202551,790