
Gwasanaethau deintyddol GIG: Ebrill 2025 i Mawrth 2026
Nifer y cleifion sy’n derbyn triniaeth ddeintyddol ar y GIG, y math o driniaeth a ddarparwyd a’r nifer o ddeintyddion GIG ar gyfer Ebrill 2025 i Mawrth 2026. Saesneg yn unig.
Ar y dudalen hon
Introduction
This statistical release provides analyses of two main components of NHS dental services: the patients treated and the activity performed by dentists.
Statistics are based on data collected through FP17W forms (NHS Business Services Authority) which are completed by dentists after every NHS treatment is performed.
Any privately funded dental activity is not included.
This is the final edition of the release that relates to the NHS Wales dental contract which was effective until 31 March 2026.
The next NHS dental statistical release will relate to activity under the new dental contract, effective from 1 April 2026. The new contract fundamentally changes how patients are recalled and how their treatment is categorised and will likely result in a break in the time series for many activity and patient measures.
Definitions of terms used in the release are available in the quality report.
Main points
Patients
The percentage of Welsh children treated by an NHS dentist continues to increase steadily, with half of the child population treated in the 12 months to March 2026.
Four out of ten adults were treated in the 24 months to March 2026, continuing the stable trend over the last 3 years.
A higher percentage of the female population were treated than male in all reference periods.
Although ethnic group data are missing for many patients, the data available show a higher percentage of the White ethnic group population were treated than any other ethnic group.
A higher percentage of children aged 6 to 11 were treated than any other age group. The percentage of adults treated was fairly evenly spread across all age groups.
In the last 2 reference periods, a higher percentage of adults who lived in the most deprived 20% of areas were treated compared with other deprivation quintiles.
In the last 4 reference periods, a higher percentage of children who lived in the least deprived 20% of areas were treated compared with other deprivation quintiles.
The percentage of children treated in the most deprived areas increased more than any other deprivation quintile and was in line with deprivation quintiles 2, 3 and 4 in the latest period.
Assessments of Clinical Oral Risks and Need (ACORN) showed small changes over the year. Most patients were recorded as low risk or need in all categories, while the percentage of patients with high risk or need for tooth decay and other dental needs continued to decrease.
The large majority of patients treated in Wales lived in Wales. However, the number of Welsh residents treated outside Wales increased and the number of non-Welsh residents treated in Wales decreased for both adults and children.
Just more than 150,000 new patients were treated in the financial year 2025 to 2026, a broadly similar number as in the previous 2 years.
NHS dental activity
While the number of courses of treatment provided decreased in the latest year, the trend has remained broadly stable over the previous 3 years.
More than 6 in 10 treatments were in Band 1 (check-ups and simple treatments), which increased from the previous year. Treatments for all other bands decreased from the previous year.
Just more than 10,600 orthodontic treatments started in 2025 to 2026, the second highest number on record.
Patients treated
This section focusses on data relating to Welsh resident patients treated at NHS dental practices located in Wales or England. The National Institute for Health and Care Excellence (NICE) recommends that adults are recalled for dental check-ups at intervals of 3 months to 24 months, depending on the individual’s oral health status. The guidance also recommends that the longest recall period for children aged under 18 is no longer than 12 months.
Therefore, statistics on adults treated are based on the previous 24-month period and statistics for children refer to the previous 12-month period.
Each patient is counted only once even if they have received multiple episodes of care during the reference period. Patients may be treated outside of their resident health board, and orthodontic patients are included.
Further information on patient count methodology is available in the quality report
Figure 1: percentage of Welsh resident adults and children treated in the reference period ending March each year, 2019 to 2026 [Note 1]
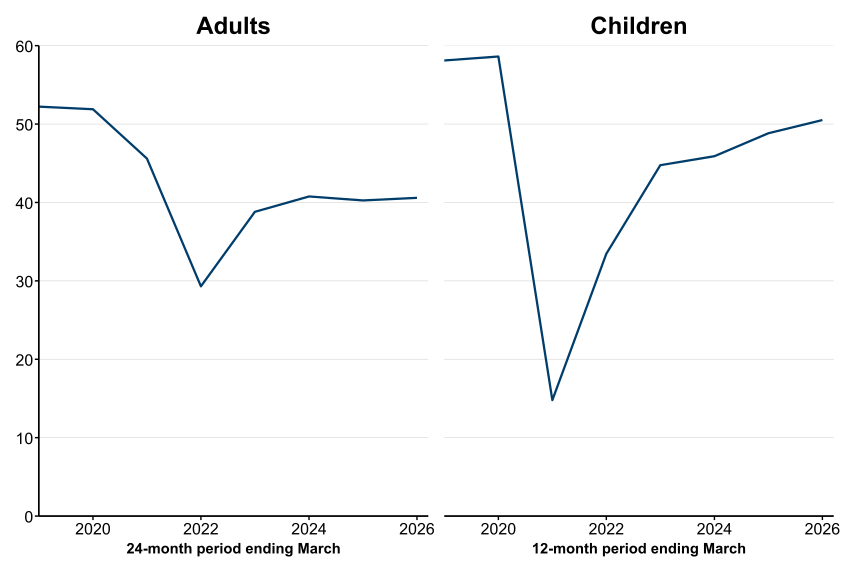
Description of figure 1: line charts showing the percentage of adults treated has remained broadly stable over the past 3 years, while the percentage of children treated has increased over the last 4 years. The coronavirus (COVID-19) pandemic had a significant impact on both adults and children treated, and the percentage of patients treated in the years since the pandemic is lower than before the pandemic.
Source: FP17W and FP17 forms, NHS Business Services Authority and mid-year population estimates, Office for National Statistics (ONS).
[Note 1] Adult refers to the resident population aged 18 years or over. Children refers to the resident population aged 0 to 17 years.
In the 24-month period ending March 2026, just over 1,041,000 adults were treated by NHS dentists. This is equivalent to 40.6% of the adult population and is 0.3 percentage points higher than the 24-month period ending March 2025.
In the 12-month period ending March 2026, just fewer than 308,000 children were treated by NHS dentists. This is equivalent to 50.5% of the child population and is 1.7 percentage points higher than the 12-month period ending March 2025.
The percentage of the adult population who saw an NHS dentist in the previous 24-month period was 11.3 percentage points lower than the pre-pandemic rate (24 months ending March 2020). Similarly, the percentage of children treated by an NHS dentist in the previous 12-month period was 8.1 percentage points lower than the percentage seen in the 12 months ending March 2020.
Characteristics of patients treated
Statistics on the characteristics of patients are based on people treated at dental practices in Wales. This means that the total number of patients is slightly different to patients included in figure 1, as this section includes non-Welsh residents treated in Wales but does not include Welsh residents treated outside Wales. This is because the Welsh Government has access to pseudonymised patient-level FP17W data from dental practices in Wales only.
See the quality and methodology information section for more information about the patient characteristics dataset.
Figure 2: percentage of adults and children treated by gender in the reference period ending March each year, 2022 to 2026 [Note 1]
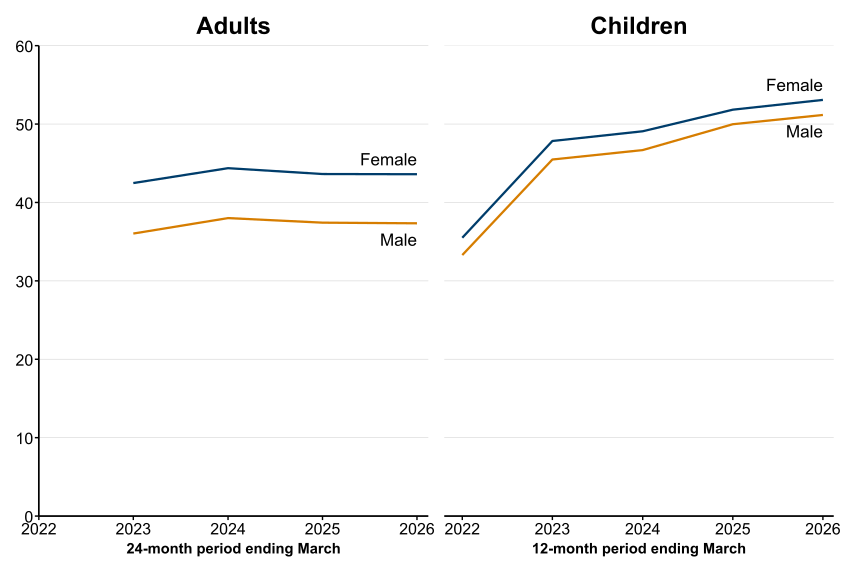
Description of figure 2: line charts showing the percentage of adult females treated by an NHS dentist was consistently higher than the percentage for adult males. While a higher percentage of female children were also treated by an NHS dentist than male children, the difference was narrower than in the adult population.
Source: FP17W form, NHS Business Services Authority and mid-year population estimates, ONS.
[Note 1] Data by gender are only available for the financial year ending in March 2022 onwards. As the adult measure is based on a 24-month reference period, the first year of available data is the 24 months ending March 2023.
Adults and children treated by gender on StatsWales
In the 24 months ending March 2026, 43.6% of adult females were treated by an NHS dentist, the same as in the 24 months ending March 2025. This compares with 37.3% of adult males, which decreased marginally by 0.1 percentage points over the same period.
In the 12 months ending March 2026, 53.1% of female children were treated by an NHS dentist, 1.3 percentage points higher than in the 12 months ending March 2025. This compares with 51.2% of male children, which increased by 1.2 percentage points over the same period.
Ethnic group
A relatively large proportion of patients do not have their ethnic group recorded. In 2026, 34.2% of adults and 40.0% of children either had missing data or declined to provide their ethnic group. Therefore, the following analysis is limited and is only included to provide an indication of patients treated by ethnic group.
When combining patients treated data with ethnic group population estimates from Census 2021 (ONS), the percentage of each ethnic group’s adult population treated by an NHS dentist in the 24 months ending March 2026 ranged from 28.0% for the White ethnic group to 15.5% for the Black or Black British ethnic group.
Similarly for children, the percentage of each ethnic group’s child population treated by an NHS dentist in the 12 months ending March 2026 ranged from 31.8% for the White ethnic group to 18.4% for the Black or Black British ethnic group.
Data on adults and children treated by ethnicity is available on StatsWales.
Age group
Figure 3: percentage of adults and children treated by age group, in the reference period ending March 2026 [Note 1]
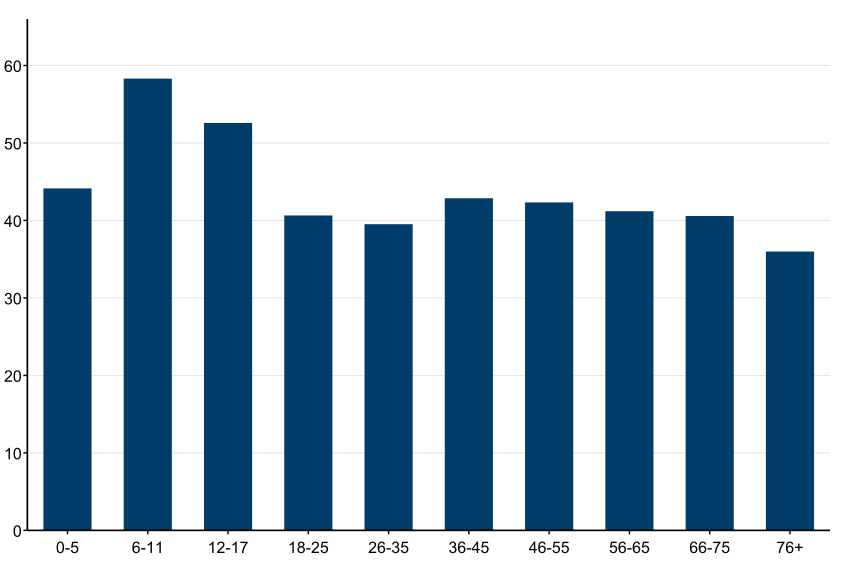
Description of figure 3: bar chart showing the percentage of the population treated by an NHS dentist in the latest reference period was highest for children aged between 6 and 17, and lowest for the oldest adult age group, 76 and over.
Source: FP17W form, NHS Business Services Authority and 2025 mid-year population estimates, ONS.
[Note 1] Data are based on the 12 months ending March 2026 for age groups between age 0 and 17, and on the 24 months ending March 2026 for all age groups of 18 and older.
Adults and children treated by age group on StatsWales
The percentage of children treated by an NHS dentist in the 12 months ending March 2026 ranged from 44.1% in the 0 to 5 age group to 58.3% for the 6 to 11 age group.
The percentage of adults treated by an NHS dentist in the 24 months ending March 2026 ranged from 42.9% in the 36 to 45 age group to 36.0% in the 76 years and over age group.
The percentage of people seen by NHS dentists increased for all age groups between age 0 to 45 when compared with the previous reference period. This ranged from a 0.2 percentage point increase in the 36 to 45 age group to a 2.9 percentage point increase in the 0 to 5 age group.
The percentage decreased for older age groups. This ranged from a 0.1 percentage points decrease for the 46 to 55 age group and a 0.7 percentage points decrease for the 66 to 75 age group.
Deprivation
Figure 4: percentage of Welsh residents treated by deprivation quintile in the reference period ending March each year, 2022 to 2026 [Note 1] [Note 2] [Note 3]
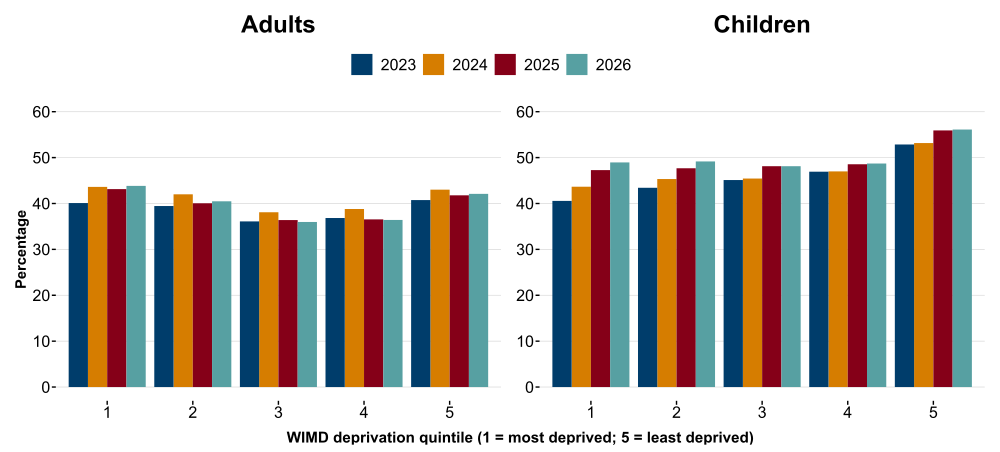
Description of figure 4: bar charts showing the highest percentage of adults treated in the 24 months ending March 2026 was in the most deprived quintile of Wales (quintile 1). The trend was different for children with the highest percentage of children seen in the 12 months ending March 2026 in the least deprived quintile (quintile 5).
Source: FP17W form, NHS Business Services Authority; Welsh Index of Multiple Deprivation (WIMD) 2025 and WIMD 2019, Welsh Government; LSOA population: Census 2021 and 2024 mid-year estimates, ONS.
[Note 1] Analyses based on patient resident LSOA. If the patient resided in a lower level super output area (LSOA) (ONS) which was ranked among the most deprived 20% of LSOAs in Wales according to WIMD 2025 (WIMD 2019 for reference periods up to March 2024), the patient was allocated to deprivation quintile 1. This allocation continues for each 20% category, ending with patients that resided in LSOAs ranked among the least deprived 20% of LSOAs being allocated to deprivation quintile 5.
[Note 2] Analyses based on patients residing in Wales only. For the 24 months ending March 2026, the resident LSOA was not known for 2.4% of adults treated. For the 12 months ending March 2026, the resident LSOA was not known for 1.9% of children treated.
[Note 3] Data for children are based on the 12 month reference period preceding that year, while for adults it is based on the 24 month reference period preceding.
Welsh resident adults and children treated by WIMD deprivation quintile on StatsWales
43.8% of adults who lived in the most deprived 20% of areas in Wales were treated by an NHS dentist in the 24-month period ending March 2026. This was the highest percentage for any deprivation quintile.
42.1% of adults living in the least deprived areas were treated (the second highest percentage) and 36.0% of adults living in deprivation quintile 3 areas were treated, (the lowest percentage).
The longer-term trend (for the 4 years of available data) shows the highest percentage of adult patients treated lived in either the most deprived or least deprived 20% of areas in Wales. The lowest percentage of patients treated resided in either deprivation quintile 3 or 4.
The pattern is different for children. In each year, the percentage of children treated by an NHS dentist was highest in the least deprived areas. In the 12 months ending March 2023 and 2024, the percentage of children treated in the most deprived areas was the lowest. However, the gap has closed and in the last 2 years, the percentage of children treated in deprivation quintiles 1, 2, 3 and 4 has been broadly similar.
56.1% of children who lived in the least deprived 20% of areas in Wales were treated by an NHS dentist, in the 12-month period ending March 2026. This was the highest percentage of any deprivation quintile. This compares with 48.9% of children living in the most deprived areas and 48.1% of children living in the middle-most deprived areas (deprivation quintile 3).
For both adults and children, the largest annual increase in the percentage of patients treated was in the most deprived quintile (quintile 1). The percentage of adults treated increased by 0.7 percentage points and children by 1.7 percentage points.
Assessments of Clinical Oral Risks and Need (ACORN)
ACORN (NHS Business Services Authority) is a programme that allows NHS dentists to carry out risks and needs assessments in a systematic way. Dentists use a colour-coded scoring system to assess various aspects of a patient’s dental health and risks, in line with the ACORN toolkit guidance (Public Health Wales). Green signifies low risk/need and red signifies high risk/need. ACORN data have been collected and validated from April 2022.
Figure 5: ACORN analysis of adults treated in the 24-month period ending March each year, 2023 to 2026 [Note 1] [Note 2]
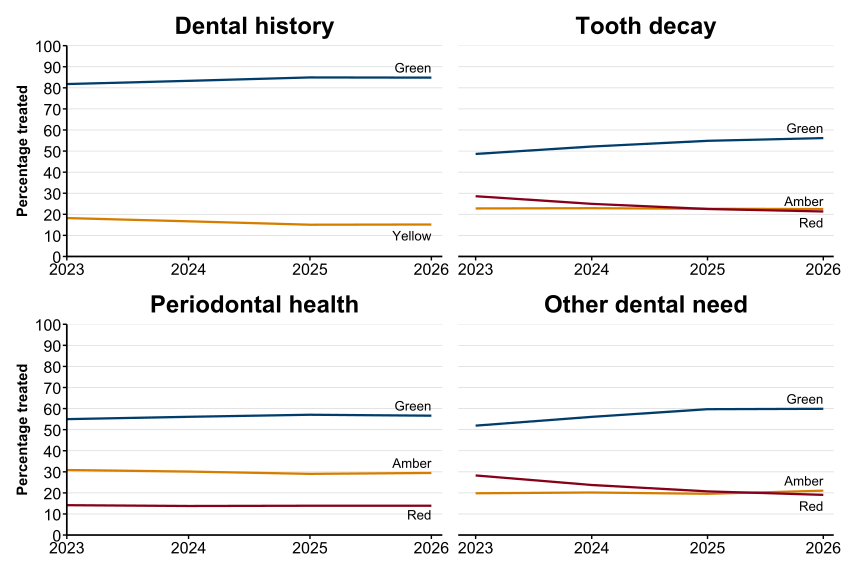
Description of figure 5: line charts showing that most adults were scored as green for each assessment type. The percentage of adults recorded as green has increased for all assessments over the time series.
Source: FP17W form, NHS Business Services Authority.
[Note 1] For the 24 months ending March 2026, the percentage of adults with missing or not applicable data was 25.6% for dental history and other dental need, 25.9% for tooth decay and 26.7% for periodontal health. Therefore, these patients are not included in this analysis.
[Note 2] Dental history is scored with only green and yellow categories as per the ACORN guidance.
Of the adults who were treated by an NHS dentist in the 24 months ending March 2026 where an ACORN was recorded:
- 84.8% were recorded as green for their dental history, a slight decrease of 0.1 percentage points from the previous period
- 56.2% were recorded as green for tooth decay, an increase of 1.3 percentage points from the previous period
- 21.3% were recorded as red for tooth decay, a decrease of 1.2 percentage points from the previous period
- 56.6% were recorded as green for periodontal health, a slight decrease of 0.4 percentage points from the previous period
- 29.5% were recorded as amber and 13.9% red for periodontal health, both largely unchanged from the previous period
- 59.9% were recorded as green for other dental needs, a slight increase of 0.2 percentage points from the previous period
- 19.1% were recorded as red, a decrease of 1.7 percentage points from the previous period
When comparing the full time series since the 24 months ending March 2023:
- the percentage of patients who scored green for all measures has increased
- the percentage of patients who scored red for tooth decay, periodontal health and other dental need all has decreased
This suggests that the patients treated in the latest year, had on average, slightly lower oral risks and dental needs than patients treated in the 24 months ending March 2023.
Figure 6: ACORN analysis of children treated in the 12-month period ending March each year, 2022 to 2026 [Note 1]
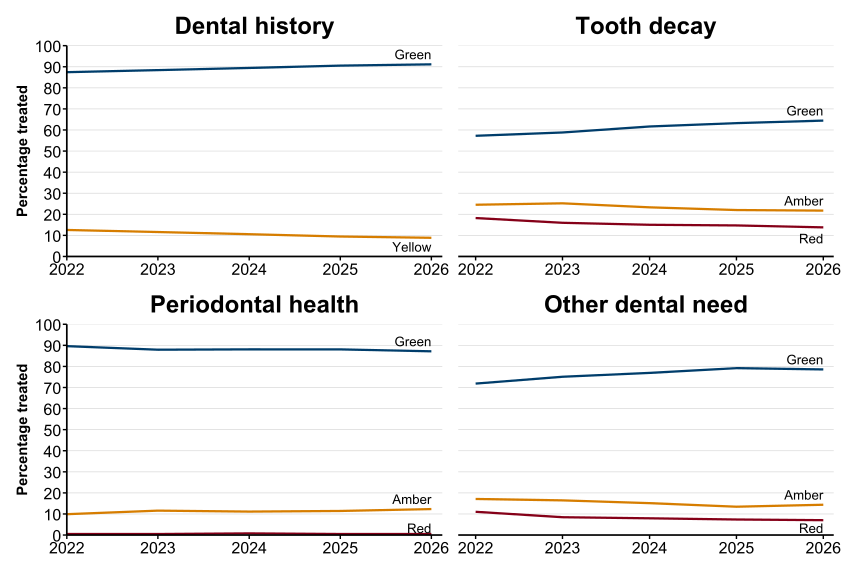
Description of figure 6: line charts showing the majority of children were scored as green for dental history, tooth decay, periodontal health and other oral need. The percentage of children scored as green has increased for all assessments except periodontal health over the five years for which data is available.
Source: FP17W form, NHS Business Services Authority.
[Note 1] Not all parts of ACORN are applicable to all children, depending on their stage of tooth development. For the 12 months ending March 2026, the percentage of children with missing or not applicable data was 18.2% for dental history and other dental need, 18.3% for tooth decay and 52.4% for periodontal health. Therefore, these patients are not included in this analysis.
Of the children who were treated by an NHS dentist in the 12 months ending March 2026 who had an ACORN recorded:
- 91.1% were recorded as green for their dental history, an increase of 0.6 percentage points from the previous year
- 64.5% were recorded as green for tooth decay, an increase of 1.2 percentage points from the previous year
- 21.7% were recorded as amber for tooth decay, a decrease of 0.3 percentage points from the previous year
- 13.8% were recorded as red for tooth decay, a decrease of 0.9 percentage points from the previous year
- 87.2% were recorded as green for periodontal health, a decrease of 0.9 percentage points from the previous year
- 12.3% were recorded as amber for periodontal health and less than 1% scored red
- 78.6% were recorded as green for other dental needs, a decrease of 0.6 percentage points from the previous year
- 7.1% scored red for other dental needs, a decrease of 0.3 percentage points from the previous year
Cross-border patient flows
Figure 7: adults and children treated across borders in the reference period ending March each year, 2019 to 2026 [Note 1] [Note 2]
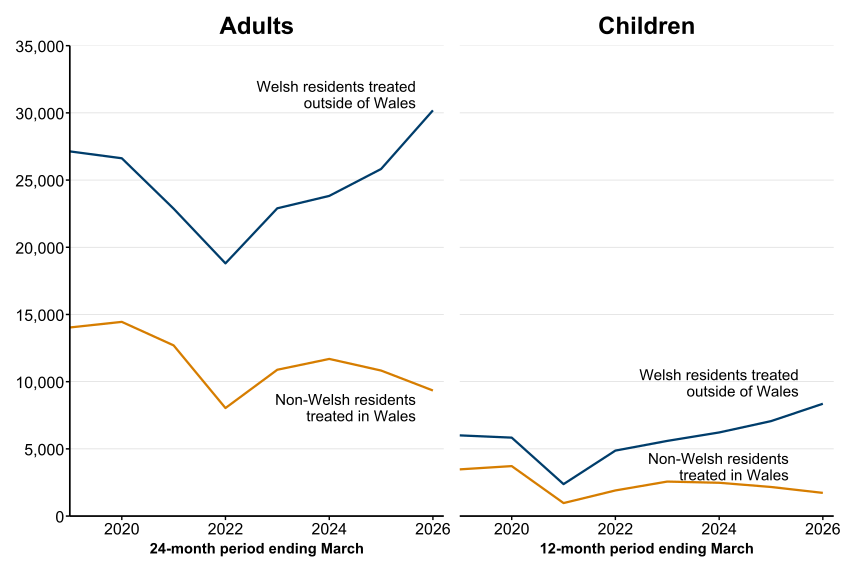
Description of figure 7: line charts showing a more Welsh residents were treated at NHS dental practices outside of Wales than non-Welsh residents treated at NHS dental practices in Wales, in each year.
Source: FP17W and FP17 forms, NHS Business Services Authority.
[Note 1] A small percentage of patients treated in Wales have missing or invalid residence data each year. In March 2026, this affected 1.4% of adults and 1.4% of children. In addition, a small number of Welsh resident patients may be treated outside of Wales without having valid residence data recorded and would therefore not be counted in these data.
[Note 2] Data on patients treated in Wales includes resident country from each UK country and the Channel Islands. Data on Welsh patients treated outside of Wales only include people treated in England and the Channel Islands. A small number of Welsh resident patients may have been treated in Northern Ireland or Scotland which are not included in this data.
Cross border flow of adults and children treated on StatsWales
In the 24 months ending March 2026:
- 30,187 adult Welsh residents were treated by NHS dentists in England
- 9,342 adult patients were treated in Wales who lived in other areas of the UK and Channel Islands
The gap has widened over time. The number of adults residing in Wales treated in England was double the number of non-Welsh residents treated in Wales in the 24 months ending March 2019. This gap increased to more than triple in the 24 months ending March 2026.
In the 12 months ending March 2026:
- 8,359 children resident in Wales were treated by NHS dentists in England
- 1,725 children treated in Wales but were not Welsh residents
The gap for children treated between borders has also increased over time. The number of children residing in Wales but treated outside of Wales was 1.6 times higher than the number of children residing outside of Wales but treated in Wales in the 12 months ending March 2019. This increased to 4.8 times as many in the 12 months to March 2026.
New patients treated
As part of the dental contract reform programme announced in 2020, dental practices were remunerated for seeing new patients, and data on new patients have been collected since April 2022. The aim of capturing new patients is to count people who are newly registered with an NHS dentist for routine treatments. There is a separate measure to count the urgent treatments of new patients who may not be registered with an NHS dentist for routine appointments.
New patients are defined as: a unique count of patients at each NHS dental contractor who completed a Band 1, 2, or 3 treatment with a complete Assessment of Clinical Oral Risks and Need (ACORN) in the year, whose previous Band 1, 2, or 3 treatment at the contractor was completed more than 48 months prior to the ACORN; or who have not previously been treated by the NHS dental contractor.
Figure 8: new adult and children patients treated, between financial years 2022 to 2023 and 2025 to 2026 [Note 1]
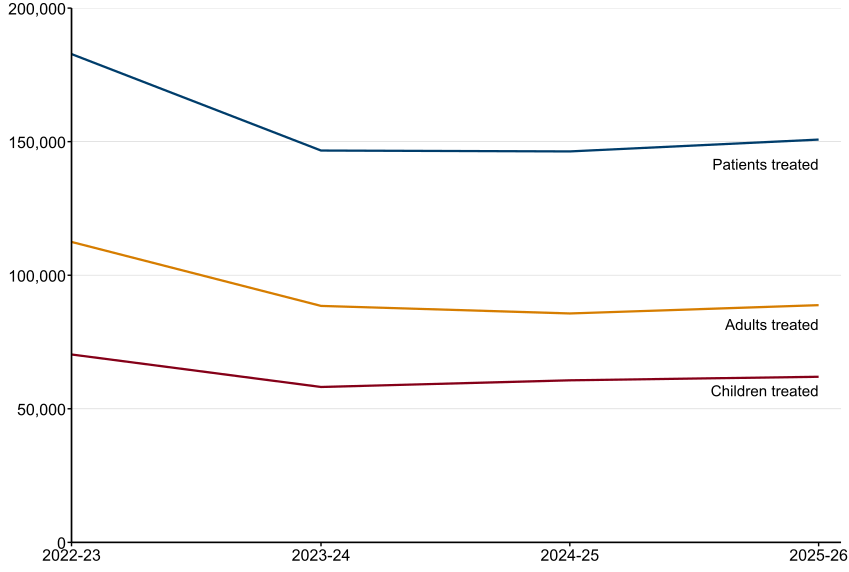
Description of figure 8: line chart showing the number of new patients treated each financial year has been broadly stable over the last 3 years. The majority of new patients treated were adults.
Source: FP17W, NHS Business Services Authority.
[Note 1] For 2023 to 2024, the period to count new patients was adjusted to count Band 1, 2 or 3 treatments back to 1 April 2019, to recognise the severe disruption to NHS dental services caused by the COVID-19 pandemic.
New NHS dental patients treated on StatsWales
150,776 new patients were treated in the financial year 2025 to 2026, an annual increase of 3.0%. Of these, 88,792 were adults and 61,984 were children.
While new patients are unique counts for each specific dental contractor, it is estimated that around 80% of new patients in the financial year did not have a separate Band 1, 2 or 3 treatment at another Welsh contractor in the previous 4 years.
Data on StatsWales show that there were 82,302 new urgent patient treatments in the financial year 2025 to 2026, an annual decrease of 13.7%.
Dental activity: courses of treatment
#treatment-bandsThis section focuses on the activities performed by NHS dentists in Wales in the financial year 2025 to 2026. Activity data are based on treatments started and recorded through FP17W forms (NHS Business Services Authority). Treatments are categorised by treatment bands which are used to determine the fee paid by patients, starting with Band 1 which includes check-ups and the simplest treatments.
More information is available in the quality report.
Figure 9: courses of treatment (millions) by treatment band, between the financial years 2016 to 2017 and 2025 to 2026
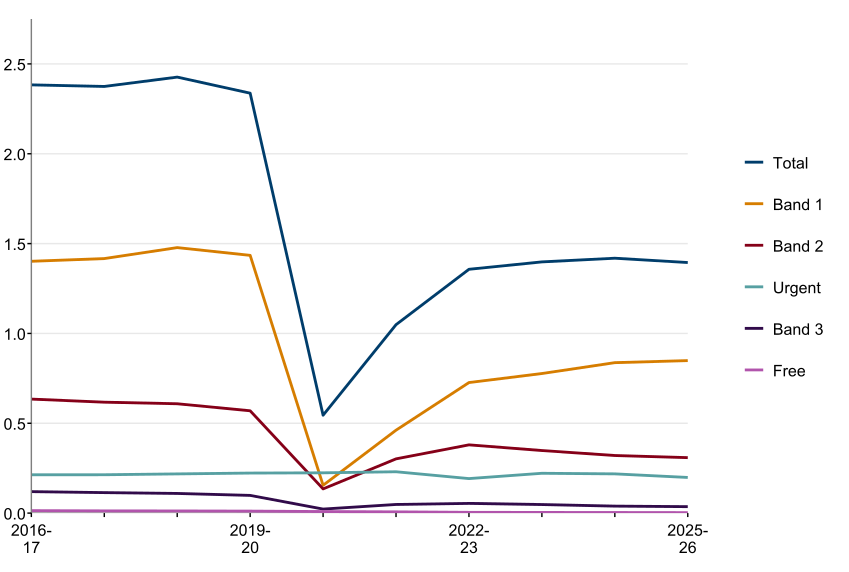
Description of figure 9: line chart showing that the number of courses of treatment provided each year has remained broadly stable for the last 3 years. While treatments have increased since the height of the pandemic, they remain below the pre-pandemic level.
Source: FP17W form, NHS Business Services Authority
Courses of treatment by treatment band on StatsWales
In the latest year:
- close to 1.4 million courses of treatment were recorded, a decrease of 1.7% from the previous year
- the total number of courses of treatment was 40.3% lower than in the last period largely unaffected by the pandemic (financial year 2019 to 2020)
- Band 1 treatments were the most common treatment band, accounting for 60.9% of all courses of treatment. The number of Band 1 treatments increased by 1.4% from the previous year
- Band 2 treatments decreased by 3.7%
- Band 3 treatments decreased by 7.7%
- Urgent treatments decreased by 9.1%
- Free treatments decreased by 16.9%, to the lowest number on record
Patient charges
In the financial year 2025 to 2026 there were:
- nearly 614,000 chargeable courses of treatment for paying adults
- 369,000 courses of treatment for non-paying adults
- 410,000 courses of treatment for children
Nearly £25.0 million was generated from patient charges, a decrease of 2.1% from 2024 to 2025.
Data for courses of treatment by patient type and patient charge data are available on StatsWales.
Data for clinical dental activity are available on StatsWales. The data show the most common activity was Assessments of Clinical Oral Risks and Need (ACORN), this was followed by fluoride varnish, which were included in 66.0% and 65.3% of courses of treatment respectively in the latest year.
Antibiotics was the most prescribed item in courses of treatment, which were included in 34,353 courses of treatment.
Data for Units of Dental Activity (UDA) are available on StatsWales.
Orthodontic activity
Orthodontics is a specialist area of dentistry concerned with the growth and development of the teeth and jaws. It focusses on prevention and treatment of abnormalities during development, therefore, most patients are children. Further details on orthodontics are available in the quality report.
Figure 10: orthodontic treatments started in Welsh practices, between financial years 2016 to 2017 and 2025 to 2026
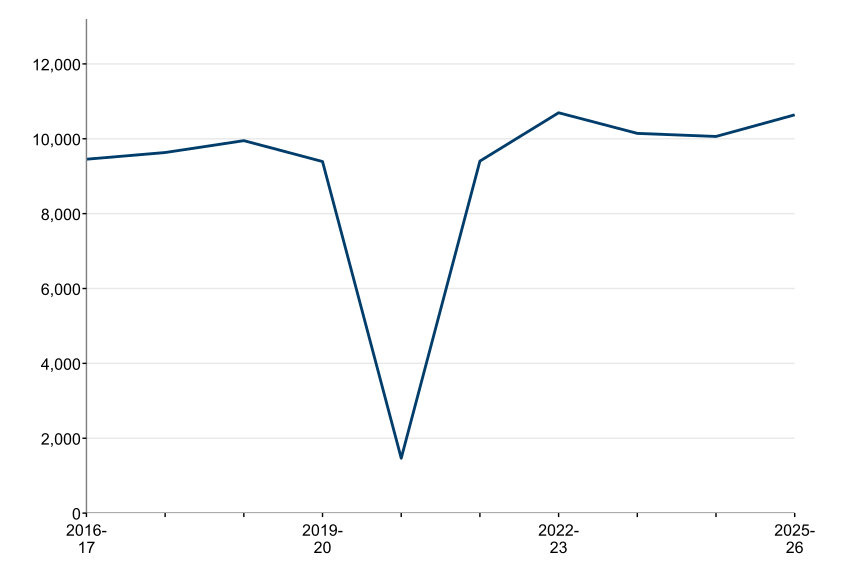
Description of figure 10: following the sharp fall during the pandemic, the number of orthodontic treatments increased to a record high in the financial year 2022 to 2023 and has remained above the pre-pandemic level since.
Source: FP17OW form (Assessed and Accepted FP17OW), NHS Business Services Authority.
Number of orthodontic treatments undertaken (Assessed and Accepted FP17OWs) on StatsWales
In the financial year 2025 to 2026, just more than 10,600 orthodontic treatments started in Wales. This is an increase of 5.7% from the previous year and is the second highest on record.
Dental practices
Figure 11: dental practices per 100,000 health board population, financial year 2025 to 2026
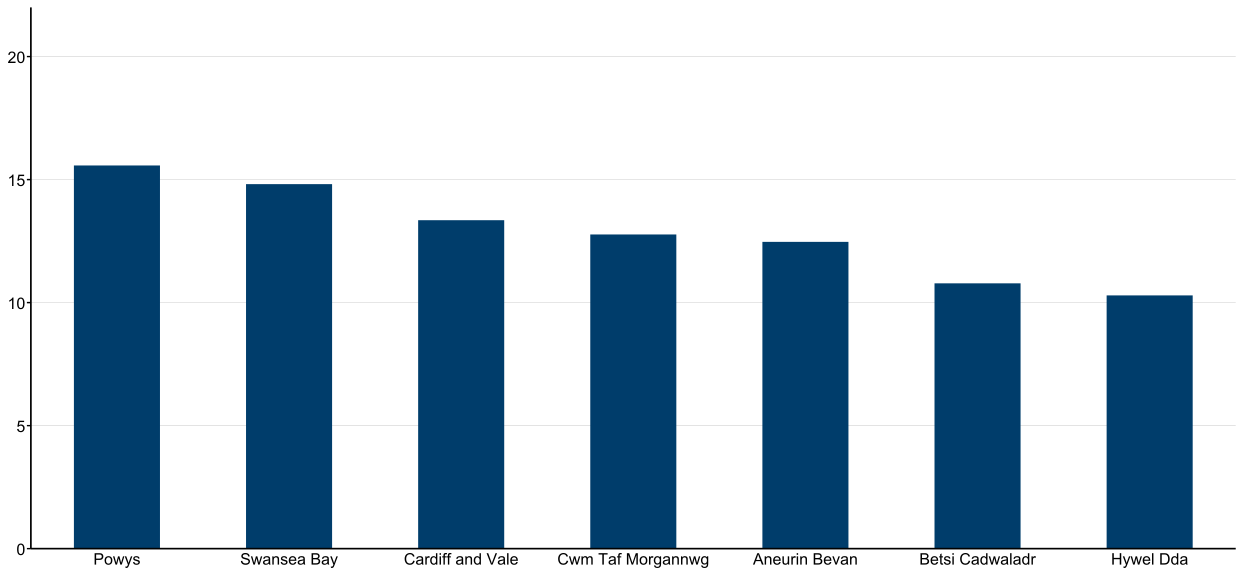
Description of figure 11: the number of dental practices which offered NHS or Community Dental Service appointments per 100,000 population was highest in Powys and lowest in Hywel Dda.
Source: FP17W, NHS Business Services Authority; mid-year population estimates, Office for National Statistics.
Dental contracts and practices (StatsWales)
In the financial year 2025 to 2026, there were 461 dentists in contract with the NHS, working out of 393 dental practices in Wales. This includes a small number of practices located in Shropshire, England.
There were 16 dental practices in Powys, per 100,000 population (the highest number per population) compared with 10 in Hywel Dda (the lowest). Powys has the largest land area but lowest population and therefore the lowest population density of all health boards in Wales, which partly explains why its number is higher than other health boards.
See the quality and methodology information section for contract and practice definitions.
Quality and methodology information
Detailed information about the statistics in this release are published in the quality report.
Workforce
At the time of publication, data for the NHS dental workforce in Wales were not available. Once available, they will be published as part of the next quarterly NHS dental statistical release.
Patient characteristics
A separate FP17W level dataset, supplied by NHS Business Services Authority, is used to derive counts of patients treated by patient characteristics. Totals derived from this dataset are higher than the equivalent headline figures published on StatsWales: adults treated at Welsh dental practices over the last 24 months and StatsWales: children treated at Welsh dental practices over the last 12 months because patients whose most recent treatment within a reference period took place in England, but who also received earlier treatment in Wales during that period, are excluded from the headline measures but retained in the FP17W level dataset. At Wales level, counts for adults treated over the last 24 months are no more than 0.9% higher, while counts for children treated over the last 12 months are no more than 4.3% higher.
Courses of treatment
A Course of Treatment (CoT) is defined as:
- an examination of a patient, an assessment of their oral health, and the planning of any treatment to be provided to that patient as a result of that examination and assessment
- the provision of any planned treatment (including any treatment planned at a time other than the time of the initial examination) to that patient.
Treatments are split into treatment bands, according to level of complexity and these bands are used to determine the charge paid by patients.
Treatment bands
Band 1
Includes a check-up and simple treatment (such as examination, diagnosis (for example, x-rays), advice on preventative measures, and fluoride varnish).
Band 2
Includes mid-range treatments (such as fillings, extractions, and root canal work) in addition to Band 1 work.
Band 3
Includes complex treatments (such as crowns, dentures, and bridges) in addition to Band 1 and Band 2 work.
Urgent
Treatments where prompt care is provided because, in the opinion of the dental practitioner, that person's oral health is likely to deteriorate significantly, or the person is in severe pain by reason of their oral condition; and care and treatment is provided only to the extent that is necessary to prevent that significant deterioration or address that severe pain.
Free
Treatments which do not incur a patient charge and include arrest of bleeding, bridge repairs, denture repair, removal of sutures, and prescription issues.
Accredited Official Statistics status
The United Kingdom Statistics Authority has designated these statistics as Accredited Official Statistics (formerly known as National Statistics), in accordance with the Statistics and Registration Service Act 2007 and signifying compliance with the Code of Practice for Statistics (UK Statistics Authority).
This status means that official statistics meet the highest standards of trustworthiness, quality and public value.
All official statistics should comply with all aspects of the Code of Practice for Statistics. They are awarded Accredited Official Statistics status following an assessment by the Office for Statistics Regulation (OSR). The authority considers whether the statistics meet the highest standards of code compliance, including the value they add to public decisions and debate.
These statistics were designated as Accredited Official Statistics in June 2012 (OSR) following a full assessment against the Code of Practice by the OSR.
Since the latest review by the OSR, we have continued to comply with the Code of Practice for Statistics, and have made the following improvements.
- Included additional open data, with more detailed breakdowns, on our StatsWales website.
- Sourced individual course of treatment data to allow for more rigorous data validations and some reproducible analytical pipelines.
- Included further insights into patients treated, including analysis of:
o deprivation of the patient’s resident area
o gender of the patient
o age group of the patient
o ethnic group of the patient
o Assessments of Clinical Oral Risks and Need
o additional types of course of treatment
o workforce joiners and leavers
o characteristics of the dental workforce - Updated quality information and refreshed commentary throughout the release, including longer time comparisons of data.
Statement of compliance with the Code of Practice for Statistics
Our statistical practice is regulated by the Office for Statistics Regulation (OSR). OSR sets the standards of trustworthiness, quality and value in the Code of Practice for Statistics that all producers of official statistics should adhere to.
All of our statistics are produced and published in accordance with a number of statements and protocols to enhance trustworthiness, quality and value. These are set out in the Welsh Government’s Statement of Compliance.
These accredited official statistics demonstrate the standards expected around trustworthiness, quality and public value in the following ways.
Trustworthiness
The published figures are compiled by professional analysts using the latest available data and applying methods using their professional judgement and analytical skillset.
These statistics are pre-announced on the Statistics and Research area of the Welsh Government website. Access to the data during processing is restricted to those involved in the production of the statistics, quality assurance and for operational purposes. Pre-release access is restricted to eligible recipients in line with the Code of Practice for Statistics.
Quality
Statistics published by Welsh Government adhere to the Statistical Quality Management Strategy which supplements the Quality pillar of the Code of Practice for Statistics and the European Statistical System principles of quality for statistical outputs.
Where there are data quality issues, they are stated in the release and on StatsWales.
Value
The purpose of this statistical release is to inform users about the main components of NHS dental services: the patients treated; the activity performed by the dentist; and the workforce who provided the dental activity.
These statistics are published quarterly with up to a six-month lag between the end of the reference period of the latest statistics and the publication date. Statistics are published as data tables on StatsWales with an accompanying headline every quarter. An in-depth report is also published annually in HTML format with analysis, charts and commentary focusing on the latest financial year.
Well-being of Future Generations Act (WFG)
The Well-being of Future Generations Act 2015 is about improving the social, economic, environmental and cultural wellbeing of Wales. The Act puts in place seven wellbeing goals for Wales. These are for a more equal, prosperous, resilient, healthier and globally responsible Wales, with cohesive communities and a vibrant culture and thriving Welsh language. Under section (10)(1) of the Act, the Welsh Ministers must (a) publish indicators (“national indicators”) that must be applied for the purpose of measuring progress towards the achievement of the wellbeing goals, and (b) lay a copy of the national indicators before Senedd Cymru. Under section 10(8) of the Well-being of Future Generations Act, where the Welsh Ministers revise the national indicators, they must as soon as reasonably practicable (a) publish the indicators as revised and (b) lay a copy of them before the Senedd. These national indicators were laid before the Senedd in 2021. The indicators laid on 14 December 2021 replace the set laid on 16 March 2016.
Information on the indicators, along with narratives for each of the wellbeing goals and associated technical information is available in the Wellbeing of Wales report.
Further information on the Well-being of Future Generations (Wales) Act 2015.
The statistics included in this release could also provide supporting narrative to the national indicators and be used by public services boards in relation to their local wellbeing assessments and local wellbeing plans.
We want your feedback
We welcome any feedback on any aspect of these statistics which can be provided by email to: stats.healthinfo@gov.wales
Contact details
NHS workforce and primary care statistics
Email: stats.healthinfo@gov.wales
Media: 0300 025 8099
SFR 71/2026
