
Cleifion mewn ysbytai ac unedau iechyd meddwl: ar 31 Mawrth 2026
Data ar breswylwyr yn ysbytai ac unedau'r GIG ar gyfer pobl â salwch meddwl neu anabledd dysgu ar 31 Mawrth 2026. Saesneg yn unig.
Ar y dudalen hon
Introduction
This release presents summary results from the 2026 Psychiatric Census. On 31 March each year, the census records the number of people with a mental illness or learning disability living in NHS hospitals and units.
The Mental Health Act 1983 (UK legislation) allows people with a mental disorder to be admitted to hospital, detained and treated without their consent. This may be needed for their own health or safety, or to protect other people.
People can be admitted, detained and treated under different sections of the Mental Health Act. People who have to stay in hospital under the Act are called ‘formal’ patients. People who agree to stay in hospital for treatment without the use of compulsory powers are called ‘informal’ patients.
Data were not collected in 2020 because of the response to the coronavirus (COVID-19) pandemic. Data for 2021 and 2022 were also affected by the pandemic, so detailed comparisons between these years and other years should be avoided. Some hospitals reported changes in how they provided care, and there with fewer patients staying in mental health facilities and more services being provided in the community.
We used statistical tests to assess whether the differences found between these data and the wider population were likely to be real or could have happened by chance. Please see the quality and methodology section for more information.
This release focuses on the most recent year and provides a ten-year time series for some analyses. Summary data from this release, broken down by local health board, are available on StatsWales.
Main points
Mental illness
At 31 March 2026, the psychiatric census identified that:
- there were 1,174 patients with a mental illness in mental health hospitals and units
- most patients (61%) were formally detained
- most patients (60%) were being treated under the adult mental illness specialty
- around half of patients (52%) had stayed in hospital for less than 3 months
- most female patients had stayed in hospital for less than 3 months (60%). Most male patients had stayed in hospital for longer than 3 months (54%)
- there were more male patients (58%) than female (42%)
- the most common age groups were 65 years and over and 25 to 44 years old (both 32%)
- 18% of patients had not disclosed their ethnicity. Of the patients with complete ethnicity information, most were White (93%)
- of the patients with complete ethnicity information, Black, Black British, Caribbean or African patients made up nearly 3 times the proportion seen in the wider population
Learning disability
Learning disability data are based on small numbers of patients and can be volatile from year to year. More emphasis should be placed on longer term trends when interpreting these data.
At 31 March 2026, the psychiatric census identified that:
- there were 75 patients with a learning disability in mental health hospitals or units
- a similar number of patients were formally detained and informally admitted
- most patients were male (75%)
- 3 out of the 7 local health boards had learning disability patients
- most patients were in a hospital in the Swansea Bay local health board (61%)
- the most common length of stay was between 3 months and 2 years (49%)
- the most common age group was 45 and 64 years old (43%)
Patients in mental health hospitals and units for people with a mental illness, at 31 March 2026
Method of admission
Figure 1: number of patients in mental health hospitals and units with a mental illness by method of admission at 31 March, 2017 to 2026 [Note 1]
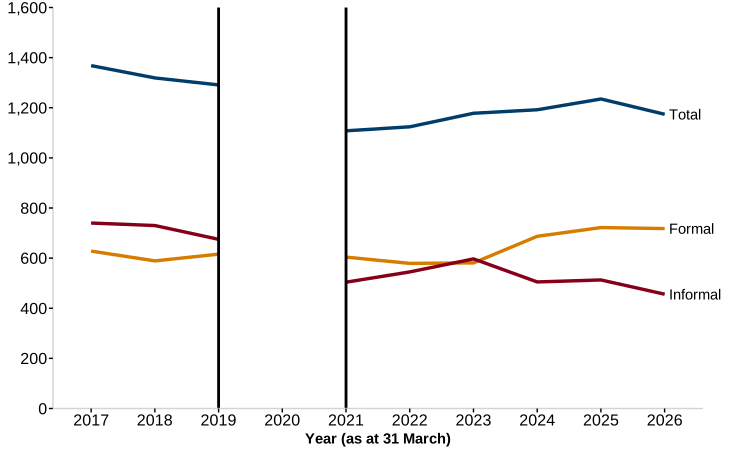
Description of figure 1: a line chart showing the number of informal mental illness patients has decreased over the last 10 years. The number of formal patients has increased and is now higher than informal patients.
Source: Psychiatric Census collection (Welsh Government)
Patients in mental health hospitals and units in Wales with a mental illness on StatsWales
[Note 1] Data were not collected in 2020 because of the response to the COVID-19 pandemic.
At 31 March 2026, there were 1,174 patients with a mental illness in mental health hospitals and units, 5% fewer than in 2025. 61% of these were formal patients while 39% were informal patients. In the last 10 years, there has been a decrease in the total number of patients. The main reason for this is a decrease in the number of informal patients. Over the same period, the number of formal patients has increased.
Trends relating to formal and informal patients have shifted over the last decade. Initially, there was a higher proportion of informally admitted patients. However, there has been a higher proportion of formal patients nearly every year since 2021.
There were 39 hospitals with resident mental illness patients. 43% of all patients were residents in 1 of 5 hospitals (Hafan y coed, Cefn Coed, Llandough, Wrexham Maelor and Royal Glamorgan). 61% of all patients were residents in 1 of 10 hospitals.
Treatment specialty
Figure 2: number of resident patients in mental health hospitals and units with a mental illness by specialty at 31 March, 2017 to 2026 [Note 1]
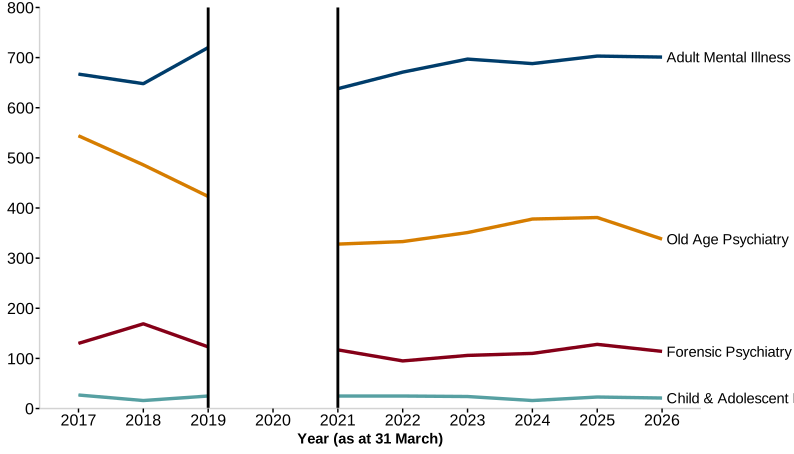
Description of figure 2: a line chart showing most resident patients are being treated for adult mental illness over the last decade and a decline in the number of patients treated under the old age psychiatry specialty.
Source: Psychiatric Census collection (Welsh Government)
[Note 1] Data were not collected in 2020 because of the response to the COVID-19 pandemic.
At 31 March 2026, most patients (60%) were treated under the adult mental illness specialty. 29% of patients were treated under old age psychiatry, 10% under forensic psychiatry and 2% under child and adolescent psychiatry.
Most patients were treated under adult mental illness each year since 2017. The proportion of patients in this specialty has been steadily increasing over this period. Over the last 10 years, the proportions of patients treated under the forensic psychiatry and child and adolescent psychiatry specialties have remained similar.
The proportion of patients treated under the old age psychiatry specialty has decreased over the last 10 years, from 40% in 2017 to 29% in 2026. The number of patients treated under this specialty has also decreased from 544 in 2017 to 338 in 2026. This has contributed to the decline in the total number of resident patients over the last 10 years.
Patients treated under the forensic psychiatry specialty were mostly male (91%). This has been consistent over the last 10 years. Patients treated under the child and adolescent specialty have been mostly female over the last 10 years.
Length of stay
Figure 3: number of resident patients in mental health hospitals and units with a mental illness by length of stay at 31 March, 2017 to 2026 [Note 1]
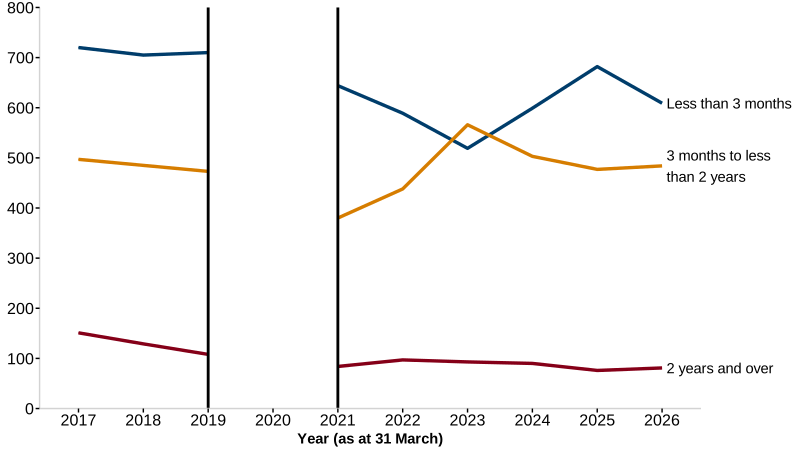
Description of figure 3: a line chart showing most patients stay in hospital for less than 3 months and has been the case in all but one year of the last decade. There has also been a decline in the number of patients staying 2 years and over.
Source: Psychiatric Census collection (Welsh Government)
[Note 1] Data were not collected in 2020 because of the response to the COVID-19 pandemic.
At 31 March 2026, around half of patients (52%) stayed in hospital for less than 3 months. This has been the case in all but one of the last 10 years. 41% of patients stayed in hospital between 3 months and 2 years.
7% of patients stayed in hospital for 2 or more years. This category has had the lowest proportion of patients in each of the last 10 years. The number of patients staying for 2 of more years has decreased over this period, from 151 to 81.
Most female patients stayed in hospital for less than 3 months (60%). Most male patients stayed in hospital for longer than 3 months (54%). 2 years or longer was the least common length of stay for both males and females.
Characteristics of patients
Figure 4: number of resident patients in mental health hospitals and units with a mental illness by sex at 31 March, 2017 to 2026 [Note 1]
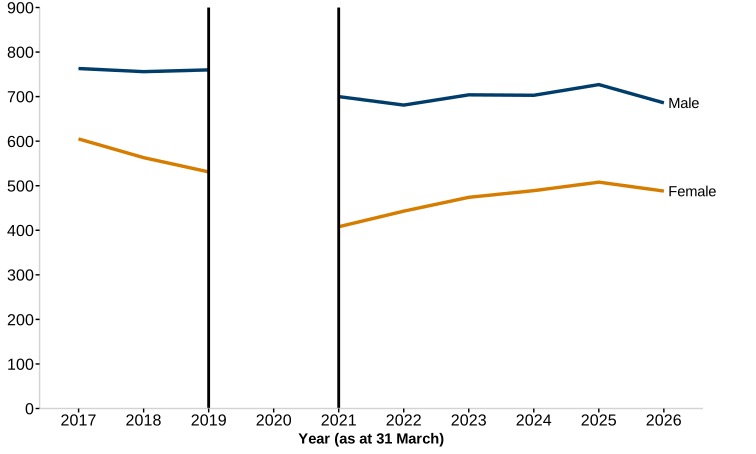
Description of figure 4: a line chart showing the numbers of both male and female patients have decreased over the last 10 years. There has been consistently more male than female patients each year.
Source: Psychiatric Census collection (Welsh Government)
[Note 1] Data were not collected in 2020 because of the response to the COVID-19 pandemic.
At 31 March 2026, of the total patients with a mental illness, there were 686 (58%) males and 488 (42%) females. Most patients have been male in each of the last 10 years. The proportion of male patients has been decreasing each year since 2021 (63%).
Between 2017 and 2019, the proportion of female patients was decreasing each year. Since 2021, this proportion has been increasing every year.
Over the last 10 years, patients were more likely than the wider population to be male. They were less likely to be female.
Figure 5: number of resident patients in mental health hospitals and units with a mental illness by age group at 31 March, 2017 to 2026 [Note 1]
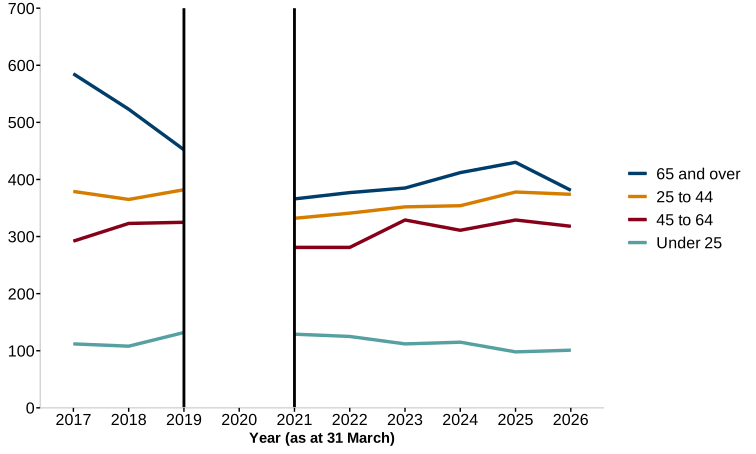
Description of figure 5: a line chart showing most patients were 65 years or older but the number in this age group has fallen over the last decade. Under 25 years has consistently been the least common age group.
Source: Psychiatric Census collection (Welsh Government)
[Note 1] Data were not collected in 2020 because of the response to the COVID-19 pandemic.
At 31 March 2026, 9% of patients were under 25 years old, 32% were 25 to 44 years old, 27% were 45 to 64 years old and 32% were 65 years or older.
Most patients in hospital have been 65 and over each year since 2017. The number of patients in this age group has decreased over this period, from 585 in 2017 to 381 in 2026. The proportion has also decreased to 32% in 2026 from 43% in 2017. Under 25 years was the least common age group each year since 2017.
Most females were 65 years or older, whereas most males were aged between 25 and 44 years old.
We used Census 2021 data to compare the proportion of patients in each age group with the Welsh population. Over the last 10 years, patients were more likely than the wider population to be aged 25 to 44 years or 65 years and over. They were less likely to be under 25 years or aged 45 to 64 years.
Figure 6: percentage of resident patients in mental health hospitals and units with a mental illness by stated ethnicity at 31 March 2026, compared to the wider population [Note 1]
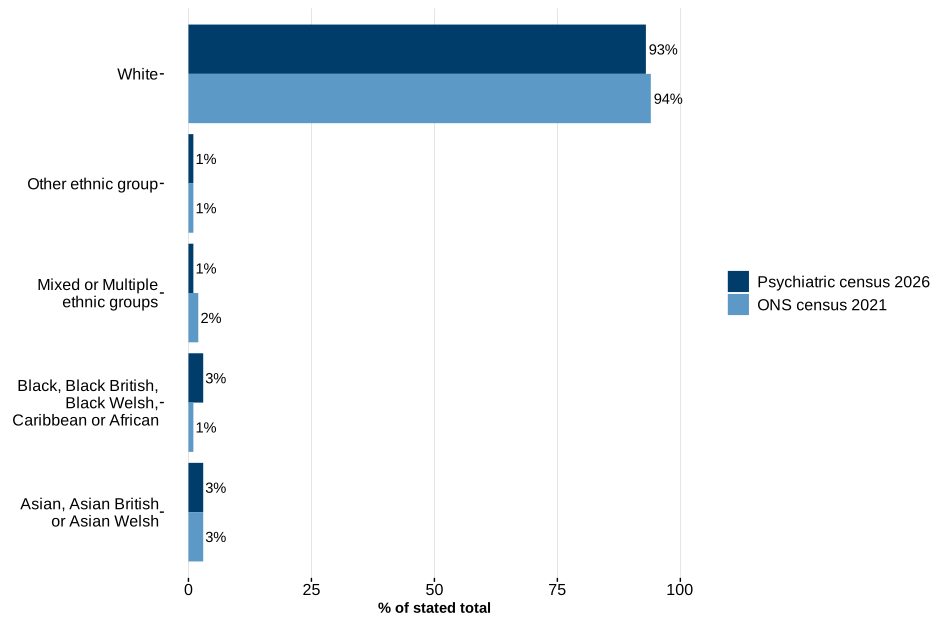
Description for figure 6: a bar chart showing that most patients with mental illness were White, at a similar proportion to people who were White in the wider population. The next highest ethnic group was Black, Black British, Black Welsh, Caribbean or African. The proportion in this group is higher than the proportion of people who were Black, Black British, Black Welsh, Caribbean or African in the wider population.
Sources: Psychiatric Census collection (Welsh Government), Census 2021 (Office for National Statistics)
[Note 1] 18% of patients did not disclose their ethnicity. Patients with incomplete ethnicity data have been excluded when calculating percentages. We do not know how these missing records are distributed across ethnic groups. The figures should be used to look at general trends rather than small differences between groups.
18% of patients did not disclose their ethnicity in 2026. We compared the patients with complete ethnicity data to the population of Wales using the Census 2021 data.
In 2026, the proportions of patients from White, Asian, Asian British or Asian Welsh, Mixed or Multiple and Other ethnic groups were similar to the wider population. Black, Black British, Black Welsh, Caribbean or African patients made up nearly 3 times the proportion seen in the wider population.
Over the last 10 years, patients were more likely to be Black, Black British, Black Welsh, Caribbean or African than the wider population. Patients were also less likely to be Asian, Asian British or Asian Welsh and from Mixed or Multiple ethnic groups.
Patients in mental health hospitals and units for people with a learning disability, at 31 March 2026
Learning disability data are based on small numbers of patients and can be volatile from year to year. More emphasis should be placed on longer term trends when interpreting these data.
Method of admission
Figure 7: number of resident patients in mental health hospitals and units with a learning disability by method of admission at 31 March, 2017 to 2026 [Note 1]
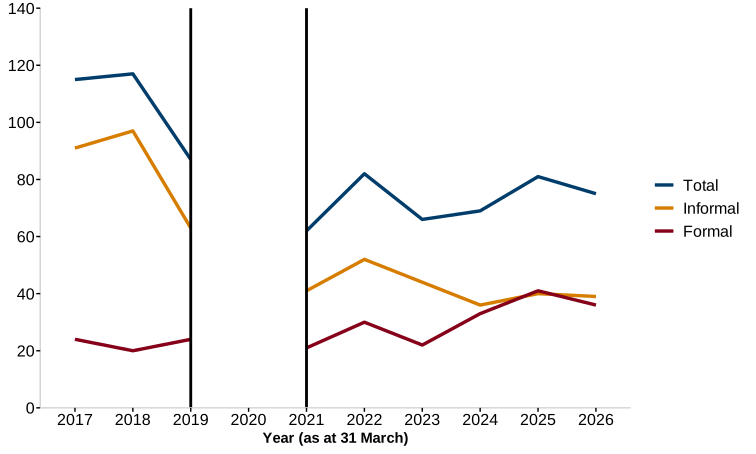
Description of figure 7: a line chart showing the total number and informal number of patients with learning disabilities has decreased over the last 10 years. The number of formal patients with learning disabilities has increased.
Source: Welsh Government - Psychiatric Census collection
[Note 1] Data were not collected in 2020 because of the response to the COVID-19 pandemic.
Patients in mental health hospitals and units in Wales with a learning disability on StatsWales
At 31 March 2026, there were 75 patients with a learning disability in mental health hospitals and units, 6 fewer than in 2025.
A similar number of these patients were formal and informal. This is a change from 2017, when 79% of patients were informal and 21% formal. Over the last 10 years, the number of formal patients has increased slightly, while the number of informal patients has fallen by more than half.
Most patients with a learning disability were male. The proportions of male and female patients who were formal or informal were similar.
3 out of the 7 local health boards (LHB) had learning disability patients. Most patients were in a hospital in the Swansea Bay LHB (61%).
Length of stay
Figure 8: number of resident patients in mental health hospitals and units with a learning disability by length of stay at 31 March, 2017 to 2026 [Note 1]
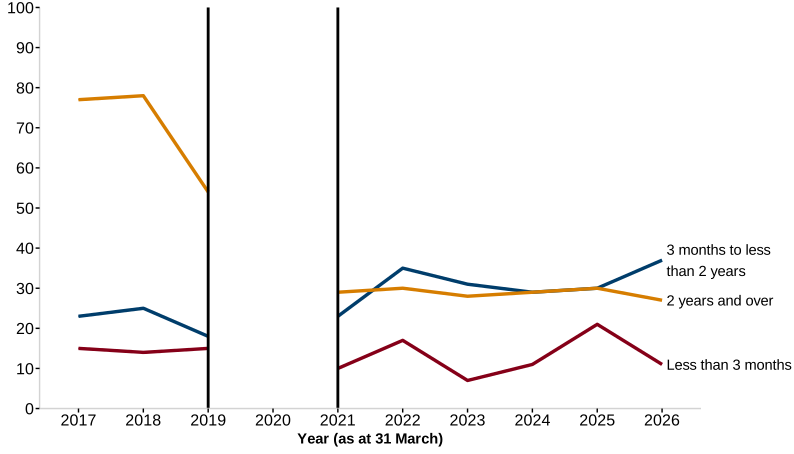
Description of figure 8: a line chart showing that most patients stayed in hospital for over 3 months each year. Prior to 2022, the most common duration of stay was 2 years and over, whereas this is now between 3 months and 2 years.
Source: Psychiatric Census collection (Welsh Government)
[Note 1] Data were not collected in 2020 because of the response to the COVID-19 pandemic.
At 31 March 2026, the most common length of stay was between 3 months and 2 years (49%). This did not vary by sex. Less than 3 months has been the least common length of stay each year since 2017. The proportion of patients who stayed less than 3 months was 15%. The proportion of patients who stayed 2 years of more was 36%.
Fewer patients stayed in hospital for 2 years or more in 2026 (27) than in 2017 (77). The number began to fall after 2018 and has continued to decrease since then. This is the main reason for the decrease in the total number of patients with a learning disability.
Most patients with learning disabilities stayed longer than patients with mental illness. Over half of patients with mental illness stayed less than 3 months compared with 15% for patients with learning disabilities.
Characteristics of patients
Figure 9: number of resident patients in mental health hospitals and units with a learning disability by sex at 31 March, 2017 to 2026 [Note 1]
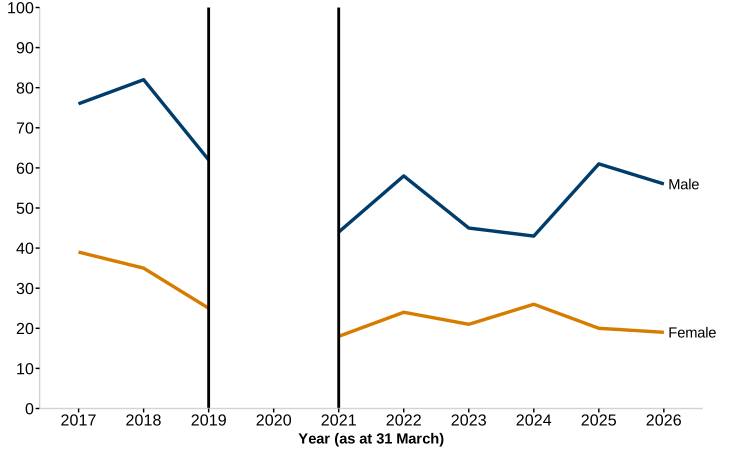
Description of figure 9: a line chart showing the number of male and female patients has decreased over the last 10 years. There has been consistently more male than female patients each year.
Source: Psychiatric Census collection (Welsh Government)
[Note 1] Data were not collected in 2020 because of the response to the COVID-19 pandemic.
Most patients have been male each year since 2017. 75% of patients were male in 2026. The proportion of female patients has decreased over the last 10 years, from 34% in 2017 to 25% in 2026.
Figure 10: number of resident patients in mental health hospitals and units with a learning disability by age group at 31 March, 2017 to 2026 [Note 1]
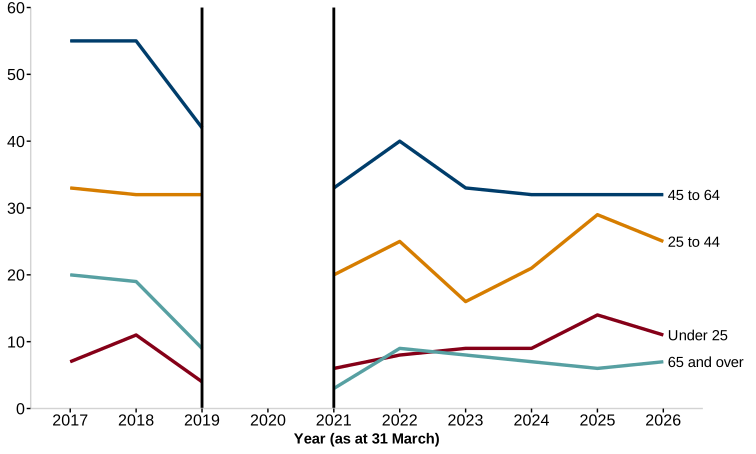
Description of figure 10: a line chart showing most patients were between 45 and 64 years old. This has been consistent over the last decade.
Source: Psychiatric Census collection (Welsh Government)
[Note 1] Data were not collected in 2020 because of the response to the COVID-19 pandemic.
Most patients have been between 45 and 64 years old, each year since 2017. In 2026, 15% of patients were under 25 years, 33% between 25 and 44 years, 43% between 45 and 64 years and 9% 65 years and over.
5% of patients did not disclose their ethnicity in 2026. 96% of patients with a learning disability with complete ethnicity data were White.
Patients with incomplete ethnicity data have been excluded when calculating percentages. We do not know how these missing records are distributed across ethnic groups. The figures should be used to look at general trends rather than small differences between groups.
Quality and methodology information
The census is carried out at midnight on 31 March each year. It counts patients staying in NHS mental health hospitals and mental health units in NHS hospitals across Wales.
These hospitals and units care for people with mental illness and people with learning disabilities. Some hospitals may also have patients who are there for other reasons, but these patients are not included in the census.
The census does not include people who live in Wales but are being treated in hospitals in England. However, it may include people who live in England if they are being treated in a hospital in Wales.
We used statistical testing called chi-squared tests to check whether differences between this data and Census 2021 data were likely to be meaningful, rather than due to chance. We considered differences to be statistically significant when the p-value was less than 0.05. A statistically significant result does not necessarily mean that the difference is large or important.
We report ethnicity using broad ethnic groups, as defined by the NHS Wales Data Dictionary. Each broad ethnic group contains more detailed categories, which are shown below.
White
Any White background, including:
- Welsh
- English
- Scottish
- Northern Irish
- Irish
- British
- Gypsy or Irish Traveller
Mixed or multiple ethnic groups
- White and Black Caribbean
- White and Black African
- White and Asian
- Any other Mixed background or multiple ethnic background
Asian, Asian British or Asian Welsh
- Indian
- Pakistani
- Bangladeshi
- Chinese
- Any other Asian background
Black, Black British, Black Welsh, Caribbean or African
- Caribbean
- African
- Any other Black background
Other ethnic groups
- Arab
- Any other ethnic group
Comparability
There is similar information available from other parts of the UK. The data are not exactly comparable due to local definitions and standards in each area.
England
Mental Health Data Hub (NHS Digital)
Scotland
Learning disability inpatient activity (Public Health Scotland)
Northern Ireland
Mental Health & Learning Disability (Department of Health Northern Ireland)
Statement of compliance with the Code of Practice for Statistics
Our statistical practice is regulated by the Office for Statistics Regulation (OSR). OSR sets the standards of trustworthiness, quality and value in the Code of Practice for Statistics that all producers of official statistics should adhere to.
All of our statistics are produced and published in accordance with a number of statements and protocols to enhance trustworthiness, quality and value. These are set out in the Welsh Government’s Statement of Compliance.
These official statistics demonstrate the standards expected around trustworthiness, quality, and public value in the following ways.
Trustworthiness
The main source of information is the annual Psychiatric Census. Digital Health and Care Wales (DHCW) collects the data from individual local health boards.
We carry out checks on the data before it is published. Since 31 March 2013, DHCW has also carried out extra checks to remove duplicate records. These checks have not been applied to older data because they are expected to have very little effect.
Local health boards are responsible for making sure that the data they provide are correct and follows the agreed definitions and guidance.
Percentages are rounded. This means that the sum of individual percentages may not always add up to 100%.
The data collections are overseen by the Welsh Information Standards Board (WISB) (DHCW). WISB oversees standards for collecting information across the NHS and local health boards. It also provides assurance on issues such as confidentiality and consent.
The publication date for these statistics is announced in advance on the Statistics and Research Upcoming calendar. While the statistics are being produced, access to the data is limited to people who need it to produce and check the statistics or for operational purposes. Access before publication is restricted in line with the Code of Practice for Statistics (UK Statistics Authority).
If incorrect data is published, we will correct it and let users know. This will be done in line with our revisions, errors and postponements arrangements. We will clearly show when figures have been revised, using 'r', and explain the size of the change from the previous release.
Revisions are not common. They usually happen when a Local Health Board sends us updated data for an earlier year. When this happens, the revised figures are normally published alongside the latest year's data.
Quality
Welsh Government statistics follow the Statistical Quality Management Strategy. This supports the quality requirements in the Code of Practice for Statistics and the European Statistical System principles for statistical quality.
The data is collected each financial year. Welsh Government statisticians check the data before it is published and ask Local Health Boards about anything that looks incorrect or unclear. Local Health Boards are responsible for making sure the data they provide is correct and follows agreed definitions and guidance.
The same standards and definitions are used across Wales. Data is collected from the same sources each year and follows national standards. This helps make sure the data is consistent across Local Health Boards and over time.
Senior statisticians check the statistical release before it is published. It is published in line with the Code of Practice for Statistics (UK Statistics Authority).
We aim to use plain English and make our publications accessible. Our headlines are published in both Welsh and English.
Definitions of terms used in this release can be found in the NHS Wales Data Dictionary.
Value
These statistics are used for many purposes. They:
- provide information for Welsh Ministers and NHS Wales
- provide information for the media and discussions in the Senedd (Welsh Parliament) and elsewhere
- support research into mental health
- support economic analysis
- help local health boards monitor their services and performance
More detailed data are available on the StatsWales website. Users can explore the data online or download it as a spreadsheet.
The statistics also support the previous Welsh Government's long-term plan for health and social care, A Healthier Wales.
We publish the most recent reliable data available.
You are welcome to contact us with comments about these statistics or how we meet statistical standards. You can also contact the Office for Statistics Regulation (OSR) by emailing regulation@statistics.gov.uk or through the OSR website.
Well-being of Future Generations Act (WFG)
The Well-being of Future Generations Act 2015 is about improving the social, economic, environmental and cultural wellbeing of Wales. The Act puts in place 7 wellbeing goals for Wales. These are for a more equal, prosperous, resilient, healthier and globally responsible Wales, with cohesive communities and a vibrant culture and thriving Welsh language. Under section (10)(1) of the Act, the Welsh Ministers must (a) publish indicators (“national indicators”) that must be applied for the purpose of measuring progress towards the achievement of the wellbeing goals, and (b) lay a copy of the national indicators before Senedd Cymru. Under section 10(8) of the Well-being of Future Generations Act, where the Welsh Ministers revise the national indicators, they must as soon as reasonably practicable (a) publish the indicators as revised and (b) lay a copy of them before the Senedd. These national indicators were laid before the Senedd in 2021. The indicators laid on 14 December 2021 replace the set laid on 16 March 2016.
Information on the indicators, along with narratives for each of the wellbeing goals and associated technical information is available in the Wellbeing of Wales report.
Further information on the Well-being of Future Generations (Wales) Act 2015.
The statistics included in this release could also provide supporting narrative to the national indicators and be used by public services boards in relation to their local wellbeing assessments and local wellbeing plans.
We want your feedback
We welcome any feedback on any aspect of these statistics which can be provided by email to stats.healthinfo@gov.wales.