
Gweithlu'r GIG (staff a gyflogir yn uniongyrchol gan GIG Cymru): 30 Mehefin 2026
Ystadegau chwarterol ar nifer y staff, absenoldeb salwch a nifer y swyddi gwag, hyd at 30 Mehefin 2026. Saesneg yn unig.
Ar y dudalen hon
Introduction
This statistical release summarises statistics on staff directly employed by NHS Wales, including:
- full-time equivalent (FTE) staff numbers
- sickness absence
- vacancy rates
Official statistics on staff directly employed and sickness absence are sourced from the NHS Electronic Staff Record, provided by Health Education and Improvement Wales.
Vacancies statistics are published as official statistics in development (Office for National Statistics (ONS)) and are collected from each NHS organisation by the Welsh Government.
Workforce statistics for each local health board are published on StatsWales.
Workforce data for primary care services such as general medical practitioners (GPs) and NHS dental practitioners are not included in this release. They are published separately as they are independent NHS contractors.
Summary
The directly employed NHS Wales workforce increased in June 2026, continuing the pattern of sustained long-term growth.
There now more than 40,000 FTE registered nursing, midwifery and health visiting staff, while medical and dental staff saw the largest annual increase.
Sickness absence rates continue to increase slightly and were highest among health care assistants, support workers and ambulance staff.
The overall vacancy rate remains stable, but trends vary by staff group. Over the year, registered nursing vacancies have decreased, while medical and dental vacancies have increased.
Main points
Full-time equivalent (FTE) staff
- 99,751 FTE staff directly employed by the NHS on 30 June 2026.
- FTE increased by 0.6% from the previous year and by 24.6% from June 2019 (the earliest comparable reference date).
- There were 8,769 FTE medical and dental staff, an annual increase of 2.3%.
- There were 40,061 FTE registered nursing, midwifery and health visiting staff, an annual increase of 0.3%.
Sickness absence
- The average sickness absence rate was 6.2% during the most recent quarter (1 April to 30 June 2026).
- Sickness absence increased by 0.4 percentage points from the same period a year ago and by 1.4 percentage points from the same period 10 years ago.
- The sickness absence rate ranged from 8.7% for healthcare assistants and support workers to 2.3% for medical and dental staff.
- Anxiety, stress, depression and other psychiatric illnesses were the leading causes of sickness absence (36.3% of all sickness) during the most recent quarter.
Vacancies
- The estimated number of FTE vacancies across NHS Wales was 5,813 and the estimated vacancy rate was 5.8% on 30 June 2026.
- The vacancy rate increased by 0.4 percentage points from the same date in the previous year.
- The vacancy rate ranged from 3.2% for the nursing, midwifery and health visiting (registered) staff group to 10.0% for the nursing, midwifery and health visiting (support) staff group.
Staff directly employed
Analysis for staff directly employed focusses on the number of FTE staff employed on the last day of the latest available quarter.
FTEs are generally considered the best measure of staffing levels as it accounts for part-time working.
One FTE is the equivalent of a person working the standard hours for their grade (usually 37.5 hours a week). More detail is provided in the quality report.
Figure 1: headcount and full-time equivalent (FTE) staff directly employed by NHS Wales on 30 June 2019 to 2026 [Note 1]
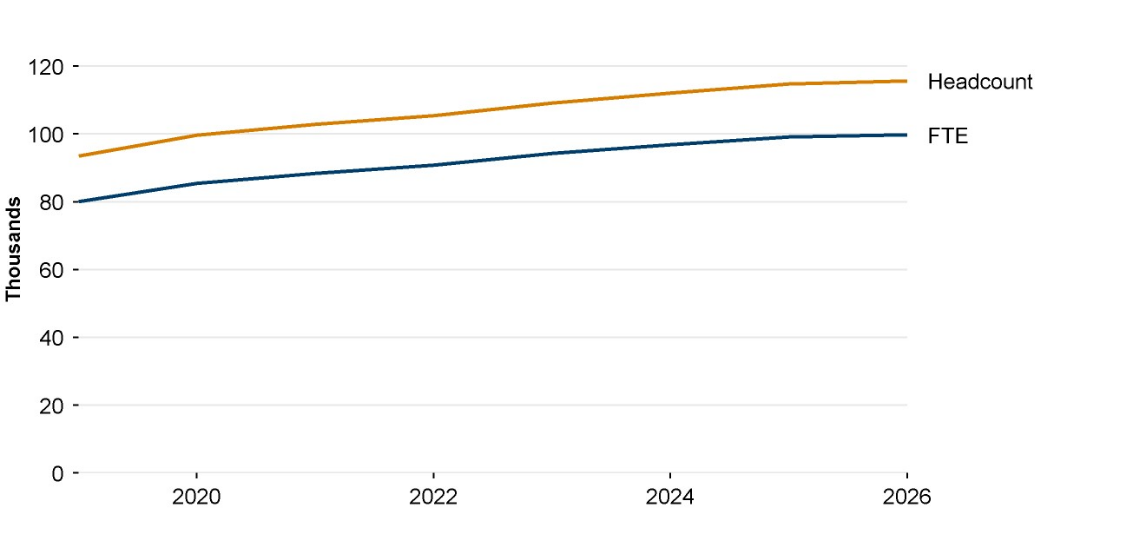
Description of figure 1: line chart showing that both FTE and headcount have increased steadily 2019, with slower growth in recent quarters.
Source: Electronic Staff Record, Health Education and Improvement Wales (HEIW)
NHS staff summary by staff group and year on StatsWales
NHS staff by occupation code
[Note 1] In this chart, headcount refers to the ‘assignment count’ which is the number of filled posts on the reference date.
On 30 June 2026, there were:
- 99,751 FTE staff directly employed by the NHS.
- 0.6% more than FTE staff than on the same date in the previous year
- 24.6% more FTE staff than on the same date in 2019 (the earliest comparable period)
Figure 2: number of full-time equivalent (FTE) staff directly employed by NHS Wales on 30 June, by staff group, 2019 to 2026
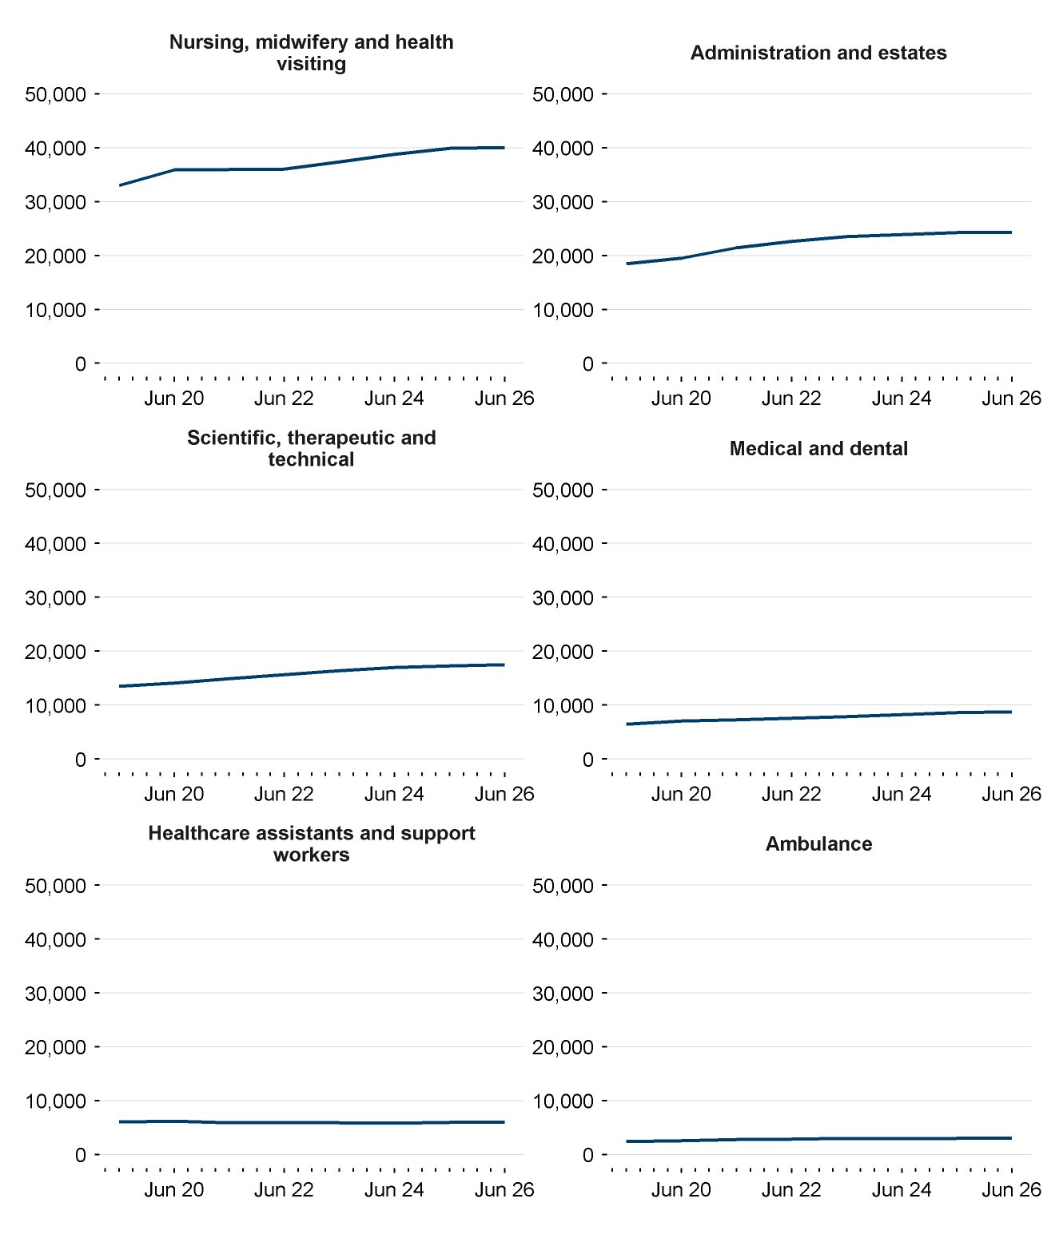
Description of figure 2: line charts showing a long-term upward trend in the number of FTE staff for all staff groups apart from healthcare assistants and ambulance staff which have remained broadly stable.
Source: Electronic Staff Record, Health Education and Improvement Wales (HEIW)
NHS staff summary by staff group and year on StatsWales
All statistics in this section relate to FTE staff on 30 June 2026.
Registered nursing, midwifery and health visiting
- 40.2% of all FTE staff were registered nursing, midwifery and health visiting staff, the largest staff group.
- Staff in this group increased by 0.3% from 30 June 2025 and by 21.2% from 30 June 2019.
Administration and estates
- 24.4% were administration and estates staff.
- Staff in this group increased by 0.2% from 30 June 2025 and by 31.9% from 30 June 2019.
Scientific, therapeutic and technical
- 17.6% were scientific, therapeutic and technical staff.
- Staff in this group increased by 1.3% from 30 June 2025 and by 29.8% from 30 June 2019.
Medical and dental
- 8.8% of staff were medical and dental staff.
- Staff in this group has increased by 2.3% from 30 June 2025 and by 36.2% from 30 June 2019.
Healthcare assistants and other support staff
- 6.0% were healthcare assistants and other support staff.
- Staff in this group remained broadly unchanged compared with 30 June 2025 and decreased by 2.3% from 30 June 2019.
- Fluctuations in staff for this group are in-part due to the re-coding of some healthcare assistants to nursing assistants or auxiliaries; further detail is included in the quality report.
Ambulance
- 3.0% were ambulance staff.
- Staff in this group increased by 0.2% from 30 June 2025 and by 17.4% more than on 30 June 2020.
- Significant changes to the ambulance section of the NHS Occupation Codes Manual between 2018 and 2019 limit comparisons before and after this period.
Sickness absence rates
Sickness absence rates are calculated by dividing the FTE number of days recorded as sick by the FTE number of days available. The number of FTE days available are based on calendar days which equate to 365 days of the year, or 366 days for a leap year.
Sickness rates show seasonal variation throughout the year, typically with lower rates in summer and higher rates in winter. Data for single months and 12-month moving averages are shown in figure 3.
Figure 3: sickness absence rates in NHS Wales, June 2017 to June 2026 [Note 1]
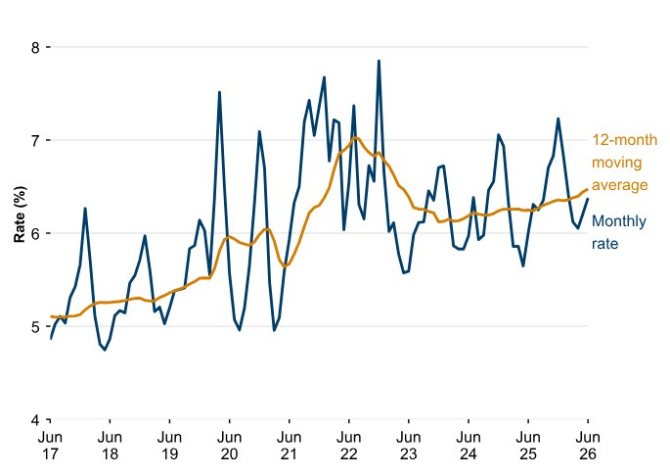
Description of figure 3: line chart showing a slight upward trend for the 12-month moving average sickness absence rate since January 2024. The rate remains below the peaks seen during the COVID-19 pandemic, but higher than the period before the pandemic.
[Note 1] Y axis starts at 4 instead of 0.
Source: Electronic Staff Record, Health Education and Improvement Wales (HEIW)
Sickness absence in the NHS, percentage of staff absent by reason and staff group (StatsWales)
Between 1 July 2025 and 30 June 2026
- The average sickness absence rate was 6.5%.
- 0.2 percentage points higher than in the same 12-month period in the previous year.
The trend has changed over the last 10 years
- The moving average ranged between 5.1% and 5.4% for all 12-month periods ending June 2017 and September 2019.
- The rate increased sharply during the COVID-19 pandemic, reaching record highs (7.0%) for the 12-month periods ending 31 July and 31 August 2022.
- The rate then fell to its lowest point (6.1%) since the pandemic for the 12 months ending December 2023.
- Since, the rate has increased gradually and reached 6.5% for the 12 months ending June 2026.
Statistics for sickness absence by reason and staff group are published on StatsWales.
For the quarter 1 April to 30 June 2026
- 36.3% of all sickness absence related to anxiety, stress, depression and other psychiatric illnesses, the largest of all categories.
- 9.2% was for other musculoskeletal problems.
- 7.7% was for gastrointestinal problems.
Sickness absence rate by NHS Wales organisation
Figure 4: sickness absence rates by organisation, April to June 2026 compared with the same quarter in the previous year
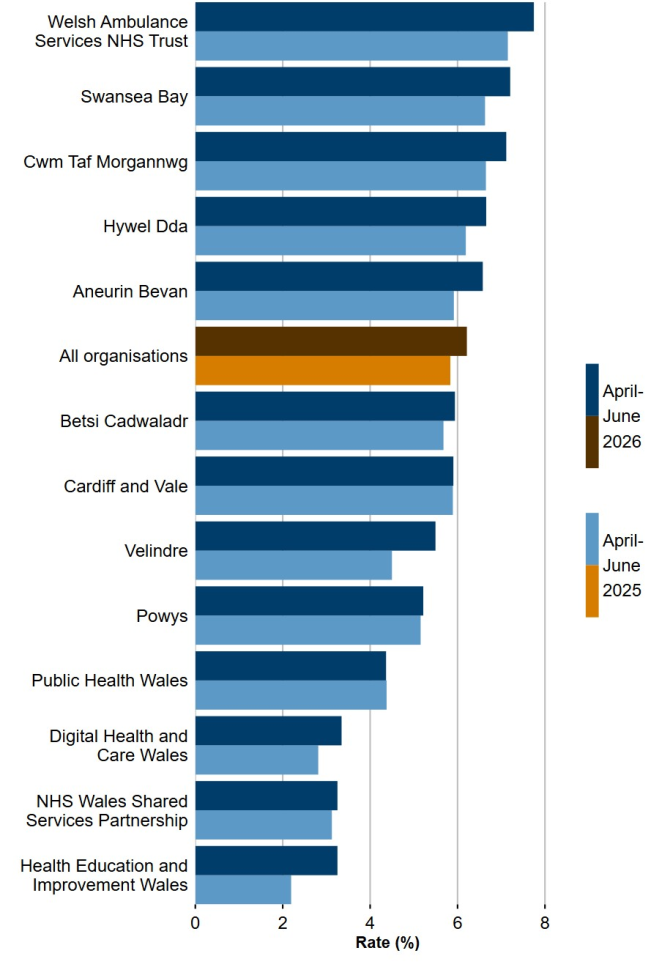
Description of figure 4: bar chart showing that sickness absence rates vary widely by NHS organisation and are generally higher in the seven health boards and the Welsh Ambulance Services Trust than in the other NHS organisations.
Source: Electronic Staff Record, Health Education and Improvement Wales (HEIW)
Sickness absence in the NHS, percentage of staff absent by reason and staff group (StatsWales)
In the quarter that ended on 30 June 2026
- Sickness absence rates stayed the same or increased in all 13 NHS organisations when compared with the same quarter in the previous year.
- Annual changes ranged from no change for staff in Public Health Wales to a 1.1 percentage point increase for staff in Health Education and Improvement Wales.
- Welsh Ambulance Services Trust had the highest sickness absence rate (7.7%) of all NHS organisations. This was a 0.6 percentage point increase from the same quarter in the previous year.
- The lowest sickness absence rates were in Digital Health and Care Wales, NHS Wales Shared Services Partnership and Health Education and Improvement Wales (3.3%).
Sickness absence rate by staff group
Figure 5: quarterly sickness absence rates by staff group, June 2017 to 2026
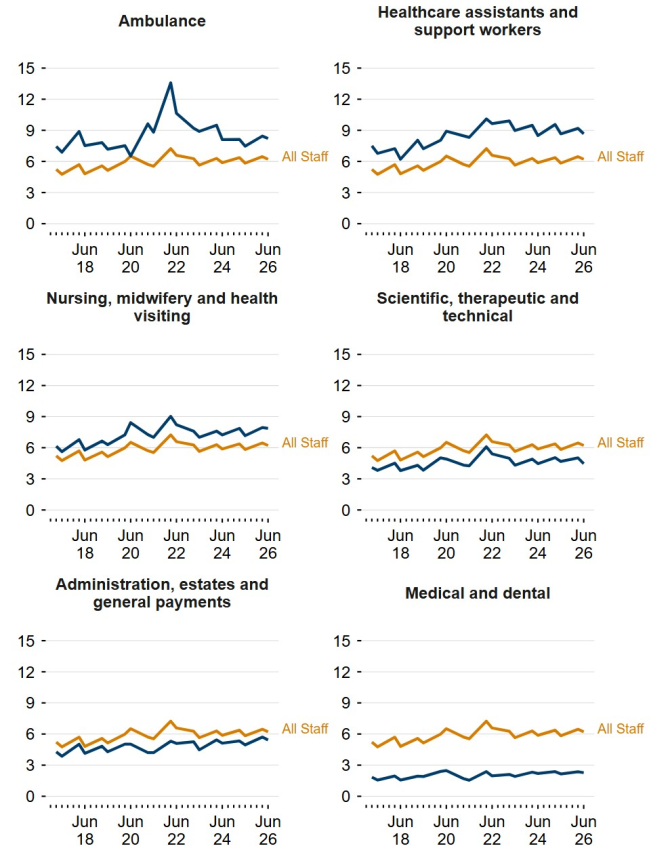
Description of figure 5: bar charts showing that sickness absence rates varied widely between different staff groups. The rate for healthcare assistants and support staff was more than 3 times greater than for medical and dental staff in June 2026.
Source: Electronic Staff Record, Health Education and Improvement Wales (HEIW)
Sickness absence in the NHS, percentage of staff absent by reason and staff group (StatsWales)
Analysis of sickness absence rates shows:
- medical and dental staff had the lowest sickness absence rate in the quarter (2.3%) and the lowest rate in all quarters since data was first collected in 2009
- healthcare assistants and support workers had the highest sickness absence rate in the quarter (8.7%)
- either ambulance staff or healthcare assistants and support workers have had the highest sickness absence rates since data was first collected in 2009
Vacancy rate by staff group
An NHS Wales ‘vacancy’ is defined as the difference between the number of funded FTE posts recorded on the finance general ledger, and the number of FTE staff in post recorded on the NHS Electronic Staff Record (ESR). The vacancy rate is the number of vacancies divided by the number of funded FTE posts recorded on the general ledger.
The statistics only include vacancies for staff who would be directly employed by NHS Wales. They do not include primary care contractors such as general medical practitioners (GPs) or NHS dental practitioners.
Vacancy statistics are designated as official statistics in development because there are known limitations of the data which are detailed in the quality report.
Figure 6: vacancy rates by staff group, 31 December 2022 to 30 June 2026 [Note 1] [Note 2]
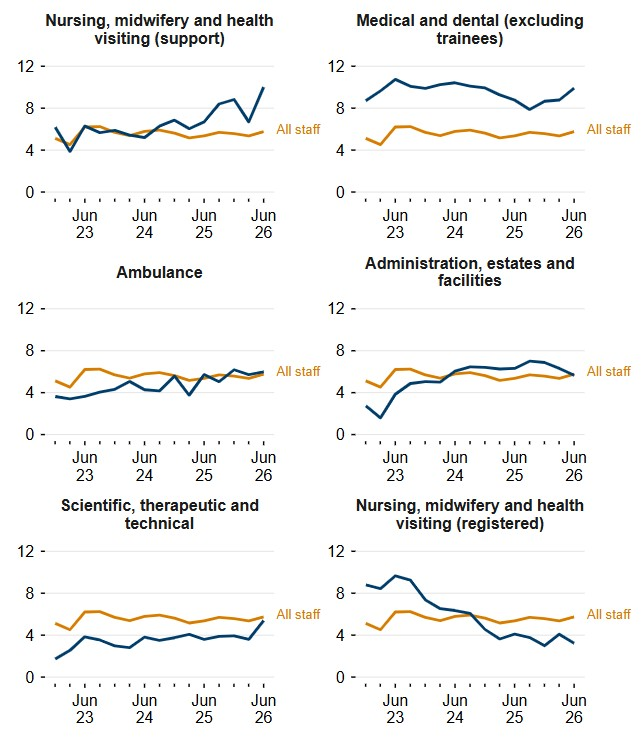
Description of figure 6: line charts showing the overall vacancy rate for NHS Wales has remained broadly stable over the last 3 years, but there have been variations between different staff groups. In recent months, rates for both registered nurses and admin staff have decreased. In contrast, rates for medical and dental, nursing support and scientific, therapeutic and technical staff have increased.
[Note 1] Excludes: medical, dental and pharmacy trainees from health boards and single lead employer
[Note 2] Staff groups are labelled slightly differently to those used in the staff directly employed charts. This is because in the vacancies data, staff are grouped by ‘subjective code’ rather than ‘NHS occupation code’ as subjective code is a common data item in both the finance general ledger and Electronic Staff Record.
Source: NHS vacancy data collection, Welsh Government
NHS staff vacancies by organisation, staff group and date (StatsWales)
On 30 June 2026
- The estimated number of full-time equivalent (FTE) vacancies across NHS Wales was 5,813.
- The estimated vacancy rate was 5.8%.
- The vacancy rate was 0.4 percentage points higher than on the same date in the previous year.
The estimated number of FTE vacancies by each staff group and change since the same date in the previous year was:
- 531 for medical and dental staff (excluding trainees), with an estimated vacancy rate of 9.9%, an increase of 1.1 percentage points
- 931 for registered nursing, midwifery and health visiting staff, with an estimated vacancy rate of 3.2%, a decrease of 0.9 percentage points
- 1,396 for nursing, midwifery and health visiting support staff, with an estimated vacancy rate of 10.0%, an increase of 3.3 percentage points
- 990 for scientific, therapeutic and technical staff, with an estimated vacancy rate of 5.4%, an increase of 1.8 percentage points
- 1,760 for administration, estates and facilities staff, with an estimated vacancy rate of 5.7%, a decrease of 0.7 percentage points
- 205 for ambulance staff, with an estimated vacancy rate of 6.0%, an increase of 0.3 percentage points
Vacancy rate by NHS organisation
Figure 7: vacancy rate by NHS organisation, 30 June 2025 and 2026 [Note 1] [Note 2]
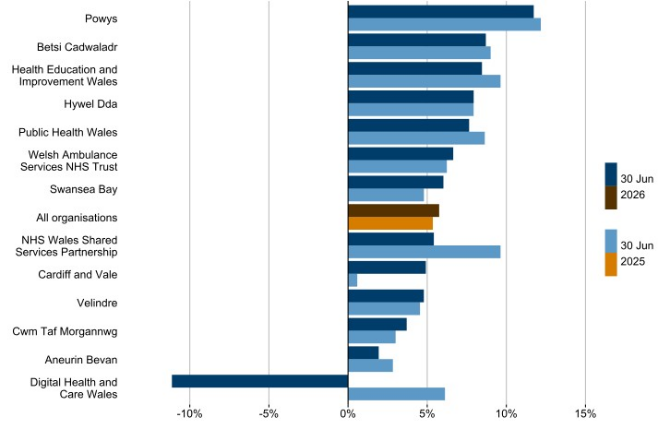
Description of figure 7: bar chart showing large variation in the vacancy rate among NHS organisations. The vacancy rate ranged from -11.1% at Digital Health and Care Wales to 11.7% at Powys.
[Note 1] Excludes: medical, dental and pharmacy trainees from health boards and single lead employer
[Note 2] A substantial portion of the Digital Health and Care Wales staff budget was not confirmed on the reference date (30 June 2026) which resulted in the unusual negative vacancy rate. The budget has since been confirmed and it is likely the rate will return to its usual level on the next reference date.
Source: NHS vacancy data collection, Welsh Government
NHS staff vacancies by organisation, staff group and date (StatsWales)
On 30 June 2026
- Estimated vacancy rates were lower in 7 of 13 NHS organisations when compared with the same date last year.
- Annual changes ranged from a decrease of 17.3 percentage points in Digital Health and Care Wales, to an increase of 4.3 percentage points in Cardiff and Vale.
- The vacancy rate for the 7 local health boards combined was 6.4%, with the highest rate in Powys (11.7%) and the lowest rate in Aneurin Bevan (1.9%).
- The local health board average was slightly higher than the rate for all NHS organisations and 0.7 percentage points higher than on the same date in the previous year.
Quality and methodology information
The number of staff directly employed by the NHS has some seasonal patterns, linked to set times in the year when newly qualified staff can be recruited into permanent roles. As such, fair comparisons can only be made with the same date or period in previous years.
The percentages in this release are rounded to the nearest 0.1. Percentage point changes are calculated based on the unrounded numbers.
Full details of quality issues are provided in the Staff directly employed by the NHS quality report.
Statement of compliance with the Code of Practice for Statistics
Our statistical practice is regulated by the Office for Statistics Regulation (OSR). OSR sets the standards of trustworthiness, quality and value in the Code of Practice for Statistics that all producers of official statistics should adhere to.
All of our statistics are produced and published in accordance with a number of statements and protocols to enhance trustworthiness, quality and value. These are set out in the Welsh Government’s Statement of Compliance.
These official statistics demonstrate the standards expected around trustworthiness, quality and public value in the following ways.
Trustworthiness
Workforce statistics are produced with integrity and are presented without political interference. All analysis included in this release is matter of fact and the presentation of these statistics is designed to minimise any misleading inferences.
The decision was made to introduce a vacancies data collection and later publish vacancies statistics as official statistics in development. This was done with the public good in mind and approved by the Chief Statistician.
These statistics were pre-announced on the Statistics and Research area of the Welsh Government website more than 28-days before publication and were published at 9.30am on the release date. Pre-release access is granted to a short list of Welsh Government officials, no more than 5 days before the publication date, in accordance with the Pre-release Access to Official Statistics (Wales) Order 2009.
Where revisions have been necessary, statistics have been republished with explanatory notes so that users are aware of what happened.
All underlying data are stored securely with access restricted to only the statisticians who produce this publication. Statistics are compiled by professional statisticians using the latest available data and applying methods using their professional judgement and analytical skillset.
Quality
The statistics are produced in line with our Statistical Quality Management Strategy. Validation checks are performed by Welsh Government statisticians and queries referred to Health Education and Improvement Wales and other NHS organisations where necessary. Staff are grouped based on occupation code within the Electronic Staff Record, and published data aligns the main groups referred to in the NHS Occupation Code Manual.
The statistical release is approved by senior statisticians before publication. Data are published in line with the statement on confidentiality and data access each quarter.
As the Electronic Staff Record is a live system and data extracts are taken from it, data presented may be revised in future editions of the statistical release. Over recent years, a number of quality issues have been identified with the data, some of which have been resolved. To help users to interpret the data and understand where those limitations may be, these are described more clearly in the Staff directly employed by the NHS quality report.
Value
The NHS is Wales’s largest employer and provides crucial services to the whole population. The purpose of the statistical release is to inform users about staffing, sickness absence and vacancy levels in NHS Wales. Published together, they aim to give a more complete picture of the staff directly employed by the NHS workforce.
Statistics are typically published quarterly with a three-month lag between the reference period of the latest statistics and publication. Methods of counting staff, sickness absence and vacancies are all defined in the main statistical release and expanded upon in the quality report. The statistics are published with brief analysis and commentary, in addition to open data format tables which are published on StatsWales: staff. StatsWales data are accompanied by metadata to aid interpretation and assess the quality of the data. The outputs are aimed to provide the whole range of users with the level of information they need.
You are welcome to contact us directly with any comments about how we meet these standards. Alternatively, you can contact OSR by emailing regulation@statistics.gov.uk or via the OSR website.
Well-being of Future Generations Act (WFG)
The Well-being of Future Generations Act 2015 is about improving the social, economic, environmental and cultural wellbeing of Wales. The Act puts in place seven wellbeing goals for Wales. These are for a more equal, prosperous, resilient, healthier and globally responsible Wales, with cohesive communities and a vibrant culture and thriving Welsh language. Under section (10)(1) of the Act, the Welsh Ministers must (a) publish indicators (“national indicators”) that must be applied for the purpose of measuring progress towards the achievement of the wellbeing goals, and (b) lay a copy of the national indicators before Senedd Cymru. Under section 10(8) of the Well-being of Future Generations Act, where the Welsh Ministers revise the national indicators, they must as soon as reasonably practicable (a) publish the indicators as revised and (b) lay a copy of them before the Senedd. These national indicators were laid before the Senedd in 2021. The indicators laid on 14 December 2021 replace the set laid on 16 March 2016.
Information on the indicators, along with narratives for each of the wellbeing goals and associated technical information is available in the Wellbeing of Wales report.
Further information on the Well-being of Future Generations (Wales) Act 2015.
The statistics included in this release could also provide supporting narrative to the national indicators and be used by public services boards in relation to their local wellbeing assessments and local wellbeing plans.
Contact details
NHS Workforce and Primary Care Statistics
Email: stats.healthinfo@gov.wales
Media: 0300 025 8099
SFR: 84/2026