Adroddiad sefyllfaol COVID-19: 10 Mehefin 2021
Diweddariad gan Gell Wybodaeth COVID-19 a'r Grŵp Ymgynghorol Diogelu Iechyd.
Ar y dudalen hon
Crynodeb o’r adroddiad ar sefyllfa COVID-19
Pwyntiau allweddol i’w nodi
Mae Cymru ar Lefel Rhybudd 1.
Mae trosglwyddiadau COVID-19 yn cynyddu yn gyffredinol ond yn gymharol isel. Mae’r amcangyfrif consensws ar gyfer y rhif atgynhyrchu yng Nghymru rhwng 1.0 ac 1.4. Ffynhonnell: SPI-M/SAGE, 9 Mehefin 2021. Mae nifer yr achosion a chanran y bobl sy’n profi’n bositif ar gyfer COVID-19 yn parhau’n gymharol isel. Sleid 3, Ffynhonnell: PHW
Mae’r pwysau sydd ar y GIG oherwydd COVID-19 wedi sefydlogi yn gyffredinol ac mae’n debyg i’r lefelau isaf a welwyd ers i gofnodion ddechrau. Sleid 4, Ffynhonnell: Data Gweithredol GIG Cymru
Mae 87 achos ychwanegol o’r amrywiolyn Delta (B.1.617.2, a nodwyd gyntaf yn India) wedi’u darganfod yng Nghymru, ar 9 Mehefin, gan ddod â’r cyfanswm i 184 o achosion a gadarnhawyd. Ffynhonnell: PHW
Er bod niferoedd absoliwt yr achosion yng Nghymru’n gymharol isel, mae ardaloedd eraill yn y DU yn gweld cynnydd mawr yn nifer yr achosion o amrywiolyn Delta. Mae gwaith dadansoddi sy’n defnyddio data genomig yn parhau i ddangos bod cyfradd dwf y Delta yn cynyddu’n sylweddol o’i chymharu â’r amrywiolyn dominyddol Alpha (B.1.1.7). Mae data cychwynnol y GIG gan awdurdodau iechyd cyhoeddus Lloegr a’r Alban yn awgrymu hefyd bod y risg o orfod mynd i’r ysbyty yn cynyddu hefyd, er bod y salwch yn llai difrifol a chan effeithio ar gyfran is o’r grwpiau oed hŷn, hynny gan fod mwy wedi’u brechu (hyder isel oherwydd nifer isel yr achosion).
O ran brechu, ar 9 Mehefin 2021, roedd cyfanswm o 3.48 miliwn o ddosau o frechlyn COVID-19 wedi cael eu rhoi yng Nghymru. O’r 3.48 miliwn o ddosau a roddwyd yn genedlaethol, dosau cyntaf oedd 2.19 miliwn ohonynt ac ail ddosau oedd 1.29 miliwn ohonynt. Os na cheir unrhyw ymddygiadau diogelu eraill, ni fydd y niferoedd presennol sydd wedi’u brechu yn diogelu ar lefel y boblogaeth gyfan. Ffynhonnell: PHW
Dangosyddion allweddol
Mae nifer o’r dangosyddion allweddol yn dechrau dangos cynnydd, yn dilyn cyfnod o drosglwyddiadau isel ym mis Ebrill a mis Mai.
Sylwer bod y saethau yn cynrychioli newid mewn cymhariaeth â’r wythnos ddiwethaf.
| Gwerth cyfredol (05/06/21) | Newid ers yr wythnos flaenorol (29/05/21 – 05/06/21 oni nodir fel arall) | ||||
|---|---|---|---|---|---|
| Newid mewn canran | Newid mewn gwerth | ||||
| Cyfradd yr achosion a gadarnhawyd (swm 7 diwrnod treigl fesul 100k) | 12 | +64% | ↑ | (+5) | |
| Cyfradd achosion a gadarnhawyd yn y rheini dros 60 oed (swm 7 diwrnod treigl fesul 100k) | 7 | +23% | ↑ | (+1) | |
| Positifedd profion (Cyfartaledd treigl 7 diwrnod) | 1.3% | +53% | ↑ | (+0.5 percentage points) | |
| Y boblogaeth yr amcangyfrifir bod ganddi COVID-19 (cyffredinrwydd)1 | 0.08% | -20% | - | (-0.02 percentage points) | |
| Capasiti’r GIG – Derbyniadau2 | 4 | 0% | - | 0 | |
| Marwolaethau ONS (swm 7 diwrnod)3 | 2 | -67% | - | (-4) | |
| Marwolaethau PHW (swm 7 diwrnod) | 1 | -50% | - | (-1) | |
- Mae data diweddaraf yr Arolwg Heintiadau COVID-19 ar gyfer y cyfnod o 30 Mai 2021 i 5 Mehefin 2021.
- Y cyfartaledd treigl saith diwrnod hyd at y dyddiad presennol o gleifion y cadarnhawyd bod ganddynt COVID-19 – nid yw’n cynnwys cleifion yr amheuwyd bod ganddynt COVID-19 neu sy’n gwella.
- Mae data marwolaethau diweddaraf ONS hyd at 28 Mai 2021 (yn hytrach na 5 Mehefin 2021) ar gyfer y gwerth cyfredol. Defnyddir data hyd at 21 Mai 2021 ar gyfer y newid ers yr wythnos flaenorol.
What is the current status of the epidemic?
| Local Authority | Number | % of All Wales Total | Case Incidence per 100,000 | Incidence threshold reached | Change from previous week |
|---|---|---|---|---|---|
| Conwy | 36 | 0.102 | 30.7 | 25 to < 50 | 64% ↑ |
| Swansea | 57 | 0.161 | 23.1 | 20 to < 25 | 338% ↑ |
| Gwynedd | 21 | 0.059 | 16.9 | 15 to < 20 | 62% ↑ |
| Flintshire | 22 | 0.062 | 14.1 | Under 15 | 120% ↑ |
| Denbighshire | 13 | 0.037 | 13.6 | Under 15 | 30% ↑ |
| Carmarthenshire | 25 | 0.071 | 13.2 | Under 15 | 92% ↑ |
| Newport | 19 | 0.054 | 12.3 | Under 15 | 46% ↑ |
| Cardiff | 43 | 0.122 | 11.7 | Under 15 | 26% ↑ |
| Neath Port Talbot | 16 | 0.045 | 11.2 | Under 15 | -11% ↓ |
| Pembrokeshire | 14 | 0.04 | 11.1 | Under 15 | 40% ↑ |
| Torfaen | 10 | 0.028 | 10.6 | Under 15 | 150% ↑ |
| Isle of Anglesey | 7 | 0.02 | 10 | Under 15 | 250% ↑ |
| Monmouthshire | 8 | 0.023 | 8.5 | Under 15 | 0% → |
| Wrexham | 10 | 0.028 | 7.4 | Under 15 | -44% ↑ |
| Rhondda Cynon Taf | 16 | 0.045 | 6.6 | Under 15 | 220% ↑ |
| Blaenau Gwent | 4 | 0.011 | 5.7 | Under 15 | 100% ↑ |
| Vale of Glamorgan | 6 | 0.017 | 4.5 | Under 15 | 0% → |
| Bridgend | 6 | 0.017 | 4.1 | Under 15 | -74% ↓ |
| Caerphilly | 7 | 0.02 | 3.9 | Under 15 | 75% ↑ |
| Merthyr Tydfil | 2 | 0.006 | 3.3 | Under 15 | 100% ↑ |
| Powys | 4 | 0.011 | 3 | Under 15 | -20% ↓ |
| Ceredigion | 2 | 0.006 | 2.8 | Under 15 | -50% ↓ |
| Unknown | 5 | 0.014 | - | 0% → | |
| Total | 353 | 1 | 11.2 | Under 15 | 45% ↑ |
At a Wales level, on 4 June, the 7-day rolling incidence of COVID-19 cases and the percentage of people testing positive for COVID-19 have increased slightly since last week.
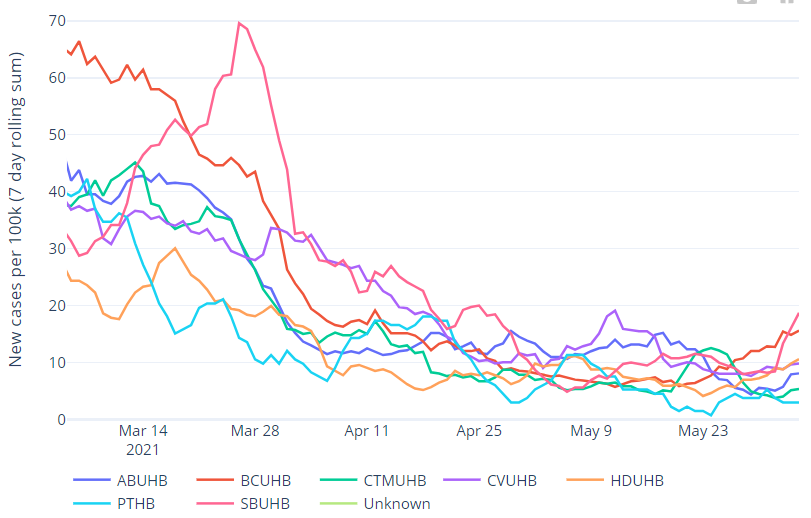
The SAGE/ SPI-M consensus estimate of Reproduction number (Rt) is 1.0 - 1.4 (as at 9 June 2021). When we look at reproduction numbers using PHW positive test data only (see second table below) - a more timely estimate but limited by variation in testing - we see a reproduction number estimate of 1.6 for Wales. At local health board level, there is considerable variation in the reproduction number (cases only) estimate, with the central estimate above 1 for Aneurin Bevan, Cardiff & Vale, Hywel Dda and Betsi Cadwaladr health boards, and above 2 for Swansea Bay.
7-day cumulative case incidence remains low across Wales at 11.2 per 100,000 population. This is a slight increase compared to the previous report (7.7 per 100,000 population).
Case incidence is increasing in most local authorities. Conwy is the only local authority with a case incidence above the 25 per 100,000 population threshold. Conwy's case incidence has increased over the past week. Swansea has a case incidence above 20 per 100,000 and has also increased over the past week.
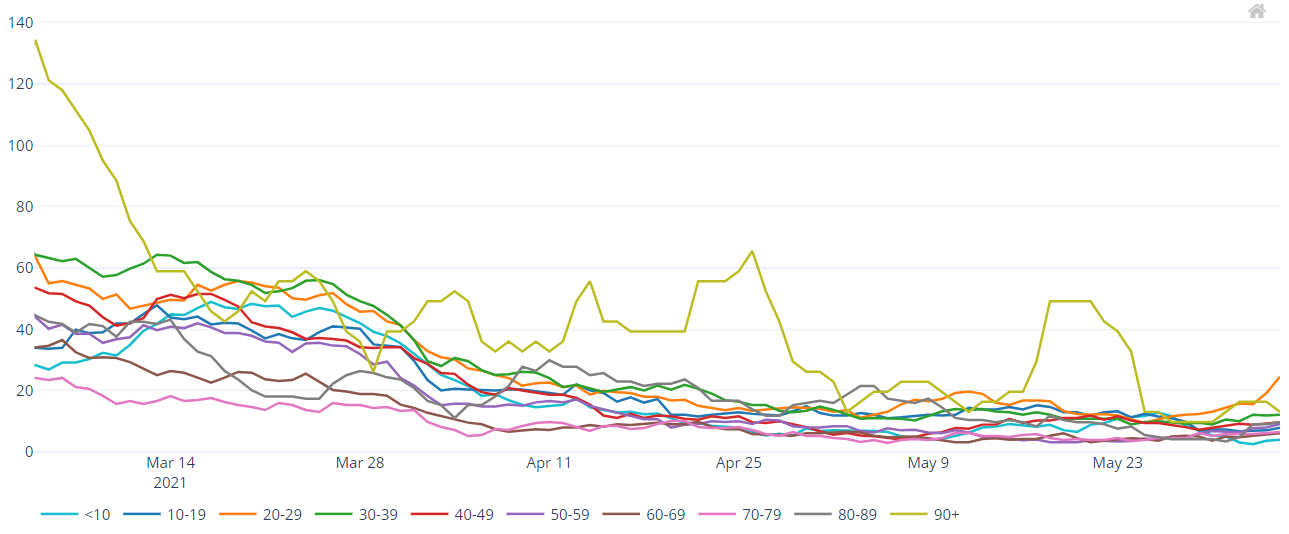
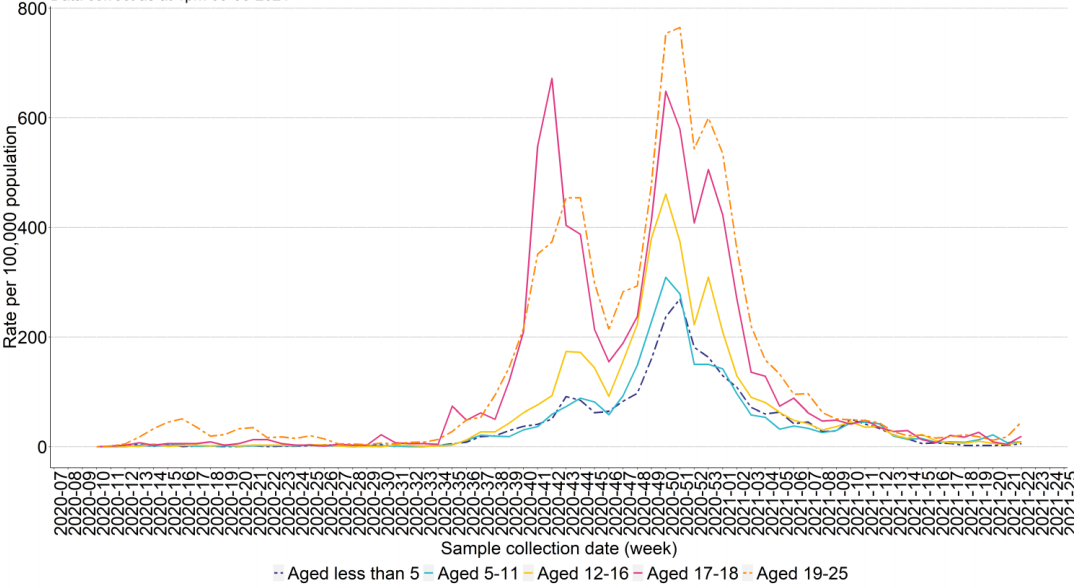
Incidence varies by health board and age. Over the past week, case incidence has risen sharply for those aged 20 – 29, more than doubling from 12.2 to 24.6 per 100,000 population as at 4 June 2021.
The table below also provides estimates of doubling and halving times based on COVID-19 positive test data. In this table, halving times are positive, whilst doubling times are negative. The 95% confidence intervals are showing in brackets after the central estimate. An asterisk (*) means that there are small numbers and estimates should be treated with caution. Local health board level estimates of Rt and halving times will be unstable when incidence is low.
| Local Health Board | Rt (cases) | Halving time (days) |
|---|---|---|
| All Wales | 1.6 (1.5 to 1.7) | 9 (6 to 17) DOUBLING |
| Swansea Bay UHB | 2.2 (1.8 to 2.6) | 7 (4 to 27) DOUBLING |
| CTM UHB | 0.8 (0.6 to 1.1) | 25 (6 to –10) |
| Aneurin Bevan UHB | 1.3 (1.0 to 1.6) | 17 (5 to -10) DOUBLING |
| Cardiff & Vale UHB | 1.2 (0.9 to 1.5) | 11 (6 to 144) DOUBLING |
| Hywel Dda UHB* | 1.5 (1.1 to 1.9) | 11 (4 to –16) DOUBLING |
| Powys THB* | 0.9 (0.5 to 1.3) | 14 (3 to –6) |
| Betsi Cadwaladr UHB | 1.4 (1.2 to 1.6) | 11 (6 to –162) DOUBLING |
Cases per 100k (PHW Data) (7 day rolling sum)
Cases per 100k by age (PHW Data) (7 day rolling sum)
Data as at 12:00PM 09 June 2021 unless otherwise specified
What is the situation with the NHS and social care?
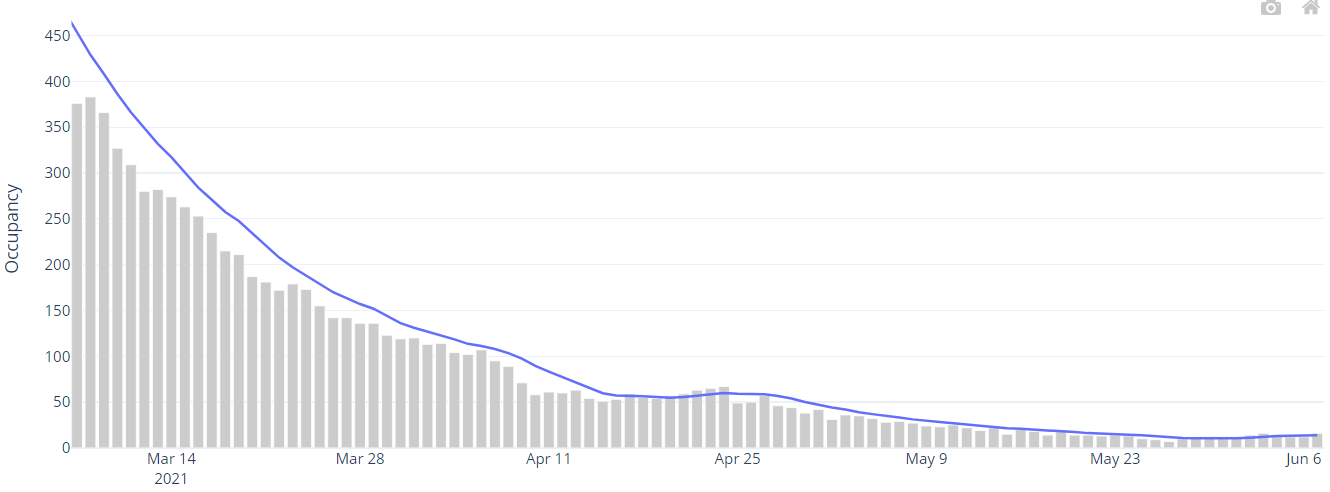
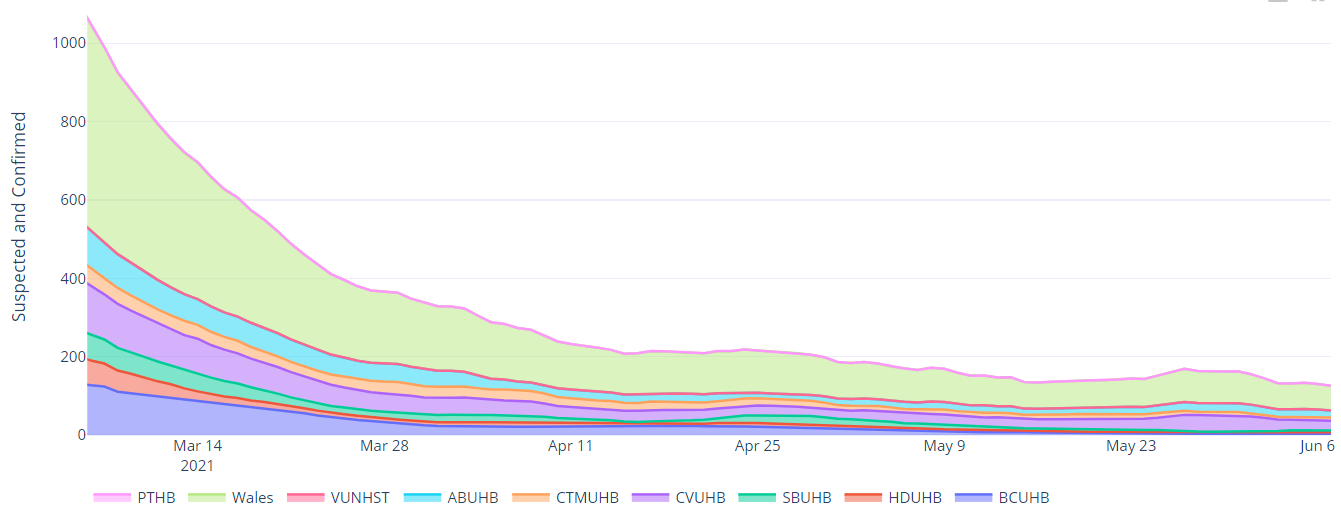
COVID-19 pressure on the NHS has generally stabilised and is now similar to the lowest levels since reporting began. As at 9 June 2021, there were 127 COVID-19 related patients (Suspected, Confirmed and Recovering) occupying a hospital bed. This compares to 131 (4 fewer occupied beds) on 2 June 2021. Confirmed patients accounted for 25 of the total occupied beds, and are at similar levels to mid-May 2021.
There are 3 patients with Suspected or Confirmed COVID-19 in critical care beds in Wales. This is 161 lower than the maximum COVID-19 position of approximately 164. The total number of patients in critical care for both COVID-19 and non-COVID-19 stands at 154, 2 more than the historic maximum critical care capacity of approximately 152.
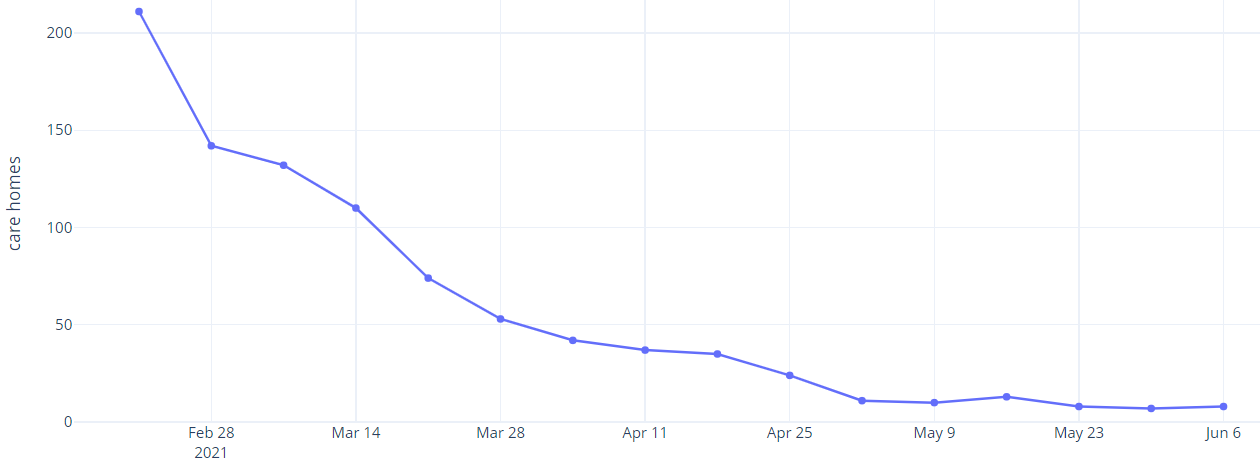
The situation with care homes remains stable with a relatively low number of care home incidents reported across Wales.
In the 7 days up to 2 June 2021, 4 (0.4%) adult care homes in Wales notified CIW of one or more confirmed cases of COVID-19, in staff or residents. This is 3 fewer notifications compared to the last 7 days up to 26 May 2021. The number of notifications is similar to the lowest levels since the beginning of the reporting period on 16 December 2020.
Confirmed hospital occupancy (7 day rolling average)
Overall invasive ventilated bed occupancy (7 day rolling average)
Invasive ventilated bed occupancy for suspected and confirmed COVID-19 positive patients (7 day rolling average)

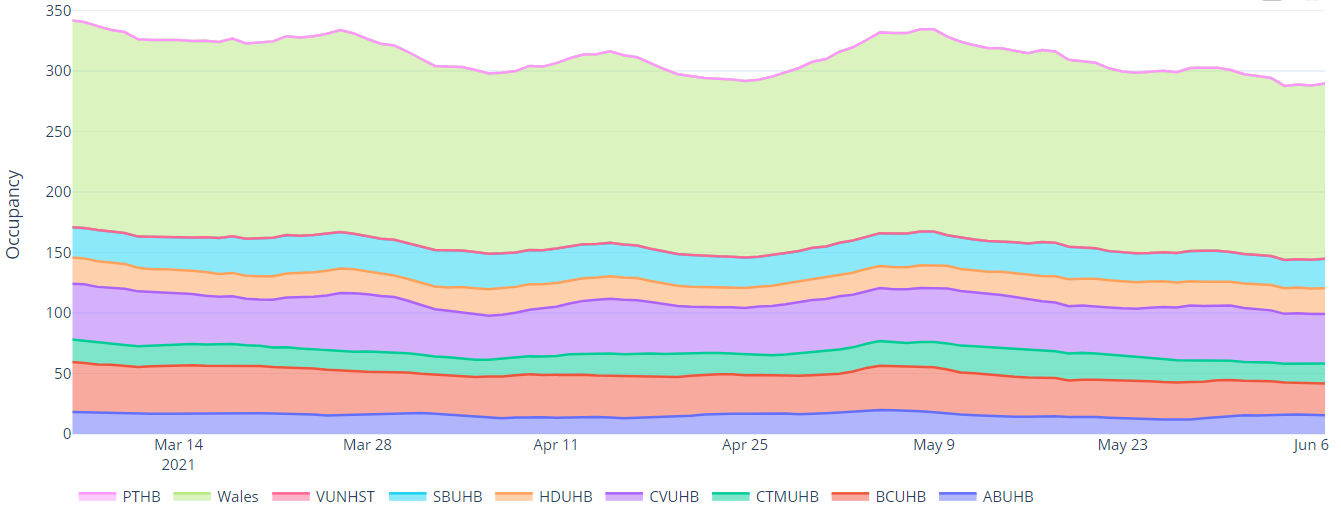
Hospital bed occupancy for suspected and confirmed COVID-19 positive patients (7 day rolling average)
Number of adult care homes reported an ongoing outbreak/incident (last 7 days)
What is the situation with education, children and young adults?
Childcare settings
The latest National Situation Background Assessment Recommendation (SBAR) report covering the week of 31 May to 6 June reported 1 new cluster of 3 confirmed cases (1 child and 2 staff) in a childcare setting.
Schools
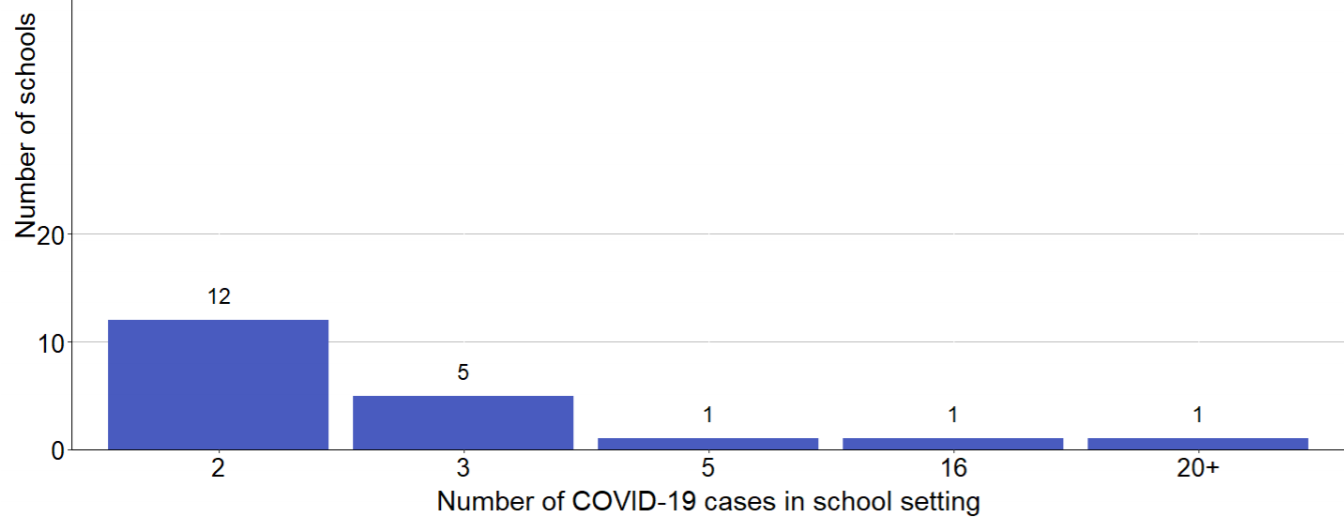
The National SBAR for the above period reported 2 new clusters and 5 ongoing clusters associated with schools. There were 2 incidents attributed to a school setting and 5 attributed to household, social or extra-curricular activities.
- One Incident Management Team (IMT) reported 2 clusters of 3 cases each in a primary school and a comprehensive. A further secondary school had 2 cases amongst pupils and another school had 2 cases that were thought to be due to in-school transmission.
- CTM updated that one school now has 30 cases within the school and 9 cases within families associated, but there is no evidence of onward community transmission and there have been no new cases in 2 days.
- There were no new cases reported in two schools that each reported one each last week. Source: National SBAR.
Weekly COVID-19 incidence per 100,000 population for school age children and young adults in Wales (data as at 1pm 9 June 2021)
Schools with more than one COVID-19 case identified within the last 21 days, excluding 43 schools with 1 COVID-19 case
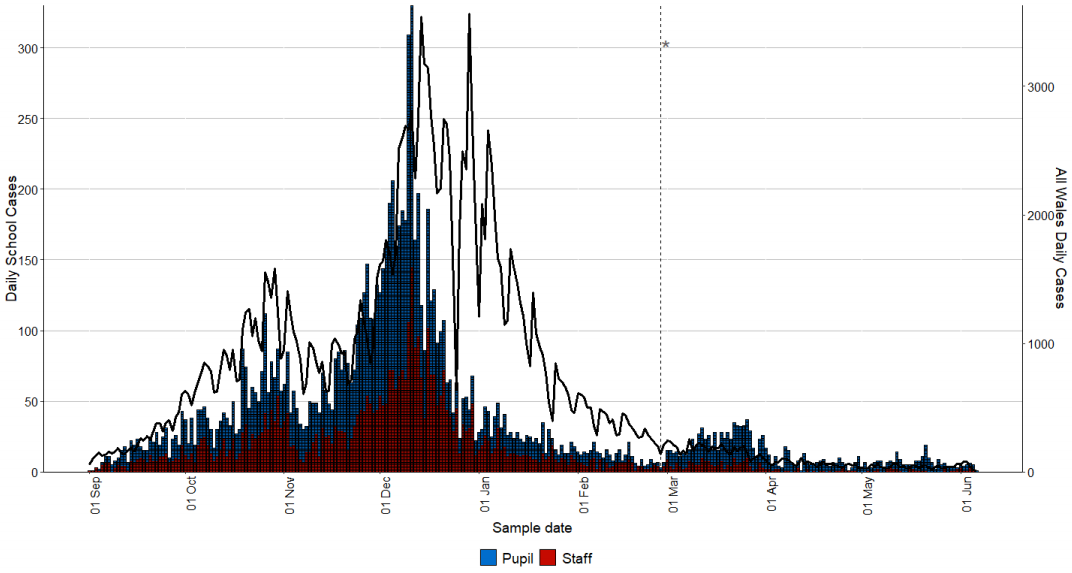
Epidemiological curve of cases in all staff and pupils linked to a school between 01 September 2020 to 7 June for all Wales maintained schools
School Attendance
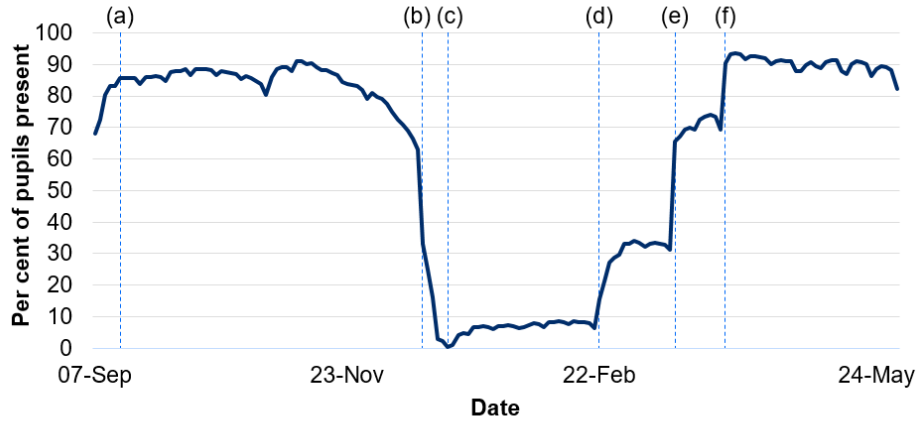
An average of 88% of all pupils were present in school over the week of 24 May to 28 May. This information is provisional and will be revised on 9 June. There is no data for the week of 31 May to 4 June due to the school holidays. Source: Stats Wales
Pupils present by day in Wales, from 07 September 2020
Further Education (FE)
There are no new or ongoing clusters within FE settings in Wales. Source: SBAR
Higher Education Institutions (HEIs)
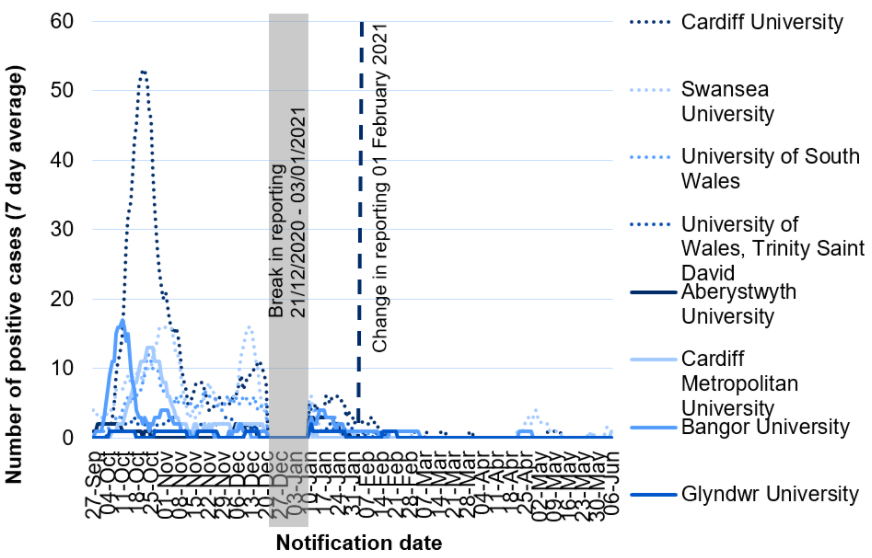
HEIs report cases notified to them by students and staff. From 1 February 2021 most HEIs have changed the way in which they report data, with positive cases referring only to students or staff attending campus or returning to the local area for study (with the exception of University of Wales Trinity St David's who are unable to split cases on this basis). Over the past week, the 7-day rolling average has been less than 3 positive COVID-19 cases for all HEI's. Source: Stats Wales
We now also capture data via the National SBAR from local IMTs. Three new clusters and five on going clusters were reported in HE settings last week. This compares to one new cluster of two individuals and three on going clusters over two health boards in the previous week.
One health board area reported small linked clusters in two HMOs with five positive in total to date and likely to be Delta variant. The remaining new cluster was associated with two students living in the same flat. Source: National SBAR
There is currently voluntary lateral flow device (LFD) testing of childcare staff, school staff, FE and HEI staff; FE and HE students, and older secondary school aged pupils. Detailed information on LFD test outcomes is not yet available.
7 day rolling average of positive cases in Welsh universities 27 September to 28 May 2021
Please note: Due to accuracy & timeliness limitations with the capability of our surveillance systems, distinguishing exact case associations between children over 19, school staff and/or family members is currently not possible. We are looking to develop this with local health protection officers.
What does the situation look like going forward?
Based on the current rates observed with current restrictions:
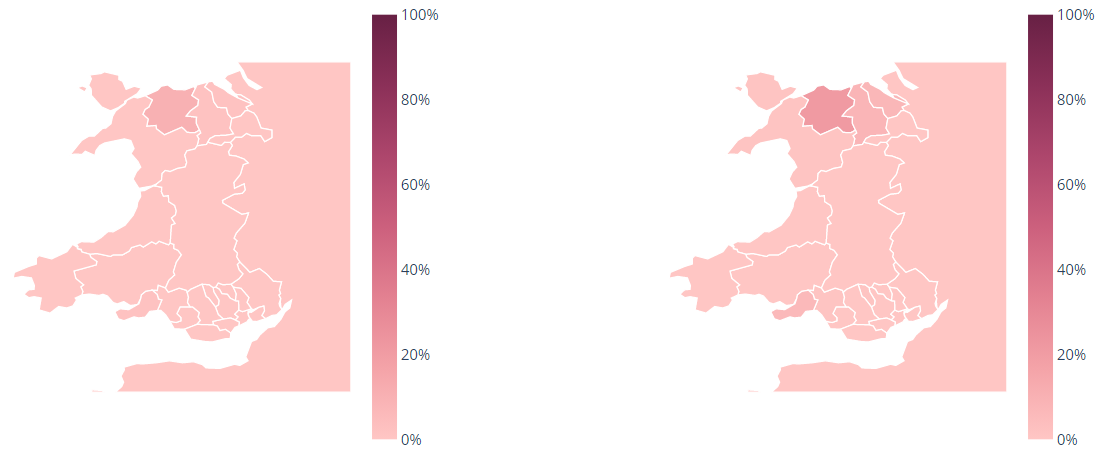
- Cases – the probability of incidence greater than 100 per 100,000 remains low for all local authorities. The figure illustrates the probability (between 0 – 100%) of incidence being greater than 100 per 100,000. Source: Imperial College London
Probability of greater than 100 per 100,000 cases by local authority, Wales
13 - 19 June and 20 - 26 June
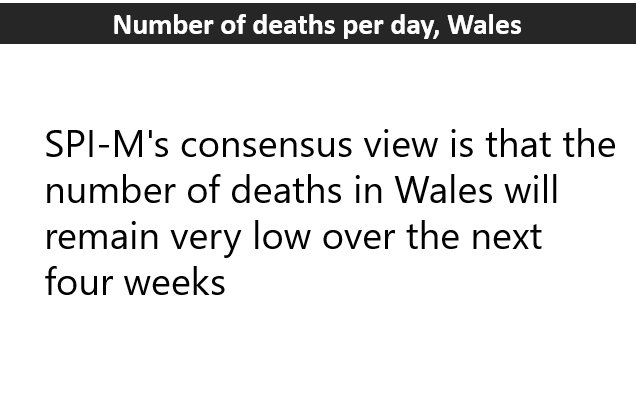
- Deaths per day – continue to see small numbers over the next four weeks, although projection is difficult when numbers fall to low levels. Source: Modelled medium term projections, SAGE/SPI-M, 7 June
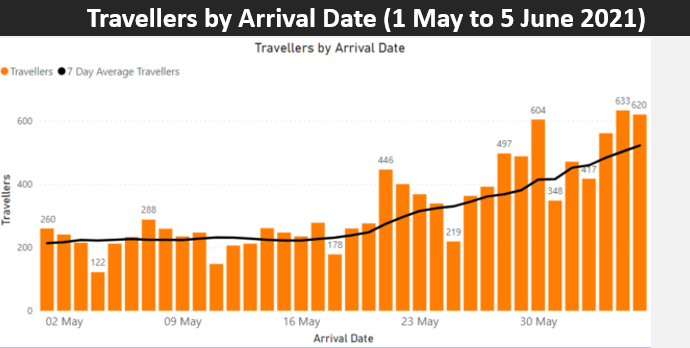
- Hospitalisations per day - continue to decrease to under 1 per day over the next four weeks. Source: Modelled medium term projections, SAGE/SPI-M, 1 June
Hospitalisations per day, Wales
These projections are based on current trends and will not fully reflect the impact of policy or behavioural changes over the past two to three weeks. The projections include the impact of vaccines, but cannot capture any future increases in transmission resulting from new variants. They are not forecasts or predictions.
Projecting forwards is difficult when numbers fall to very low levels, therefore SPI-M-O have decided to pause producing medium term projections where this is the case. The small numbers can also introduce apparent inconsistency as regions are aggregated.
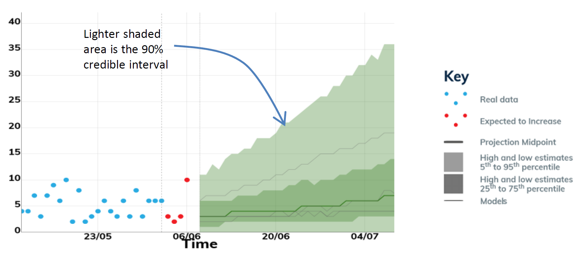
What is the situation with arriving travellers
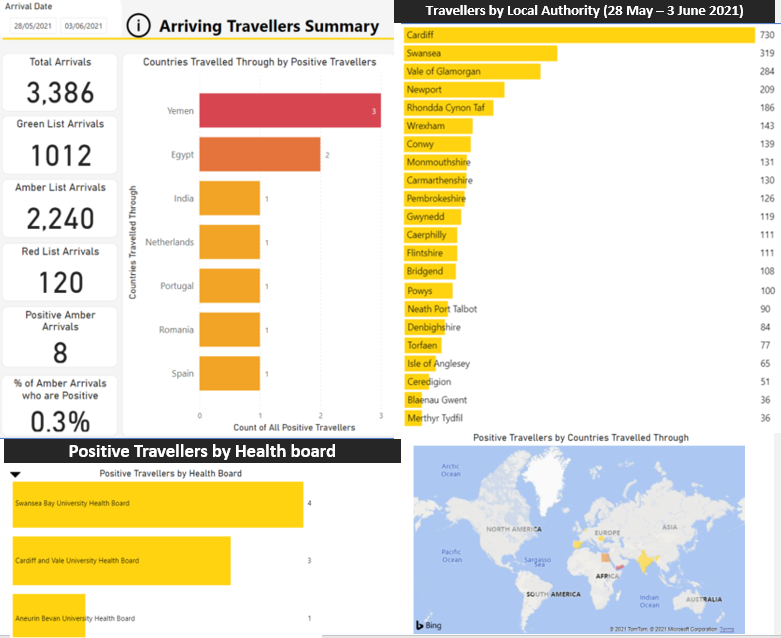
This week has seen another sharp increase in overall arrivals with Green List arrivals accounting for a just under a third of all arrivals
Portugal has seen a large increase in arrivals, higher than both France and Spain who traditionally represent the highest volume of arrivals. Nearly 900 travellers arrived from Portugal in this week. This week has also seen some changes in the traditional flow of travellers due to the Half Term/Bank Holiday period with large numbers across all days and lower drops for midweek travel. This week has seen an increase of around 2% in travellers still awaiting test results at day 10.
- There has been an increase of 859 (34%) in the overall arrivals compared to last week.
- There have been very few positive cases from Green countries (0.14%).
- Positive cases from Amber countries remain low (0.9%).
- Overall, the number of arriving travellers is rising significantly.
Source: Home Office, as at 6 June 2021
Please note that the data provided by the Home Office is derived from Passenger Locator Forms (PLF) which are self-completed by travellers. As such, data may contain inaccuracies. Due to the limitations associated with data capture and legislation, some minor discrepancies may be present in the data.
Mobility data, adherence and UK comparison
Mobility data up to 5 June shows further increases in the last week, with mobility levels in some areas higher than last summer and the highest since early March 2020 compared to a baseline of January-February 2020. It is not possible to determine if mobility is higher/lower than would have been expected prior to the pandemic as data for 2019 or earlier is not published. Note the most recent week also includes changes to mobility over half term and the bank holiday.
Mobility data by location of trip
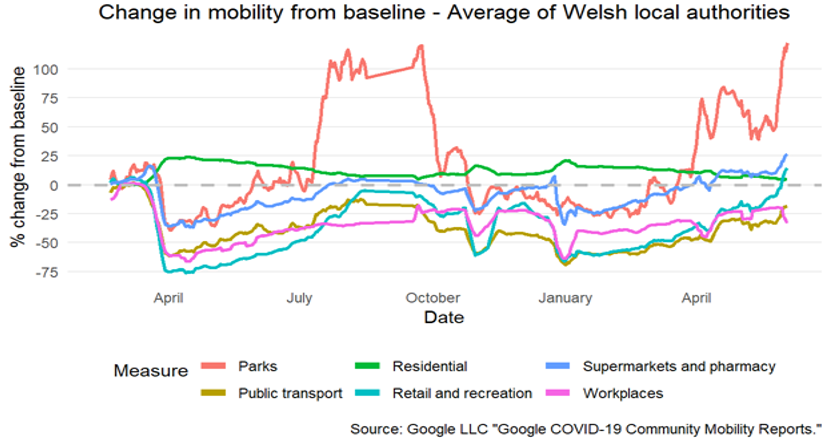
Source: Google
Adherence
The adherence data from IPSOS MORI and Public Health Wales is the same as last week, which reported reductions in some categories since the previous survey wave 4 weeks ago, most notably a large reduction in those making essential trips only and avoiding public transport. Since the previous survey, Wales moved from alert level 4 to level 2 and restrictions on movement have eased. Note self-reported adherence is affected by individuals' understanding of rules and guidance. Source: IPSOS MORI
Results from the Coronavirus (Covid-19) Infection Survey, 30 May to 5 June
Although positivity rates remain low for all four UK countries, positivity rates have increased in recent weeks. The percentage of people testing positive has increased over the last two weeks in Wales to 0.08%. However, the trend is uncertain in the most recent week.
During the most recent period, it is estimated that an average of 2,300 people in Wales had COVID-19 (95% credible interval: 800 to 4,900), equating to around 1 in 1,300 people. This compares to around 1 in 560 people in England, around 1 in 540 people in Scotland, and around 1 in 700 people in Northern Ireland.
Positivity rates (%) across UK countries up to 5 June 2021
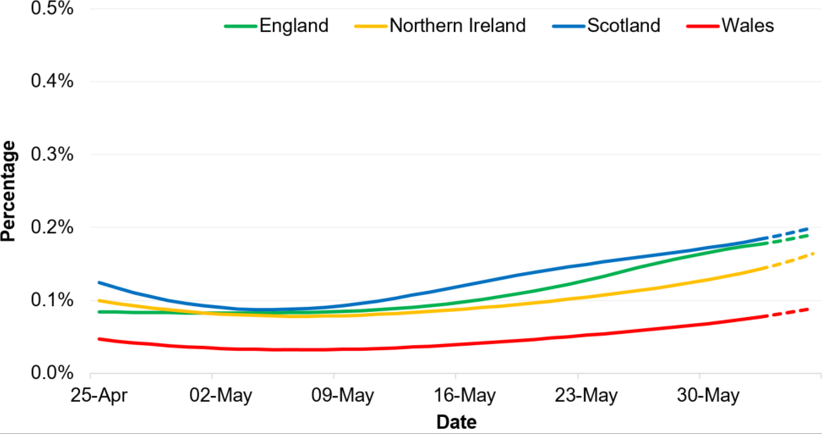
Source: Office for National Statistics COVID-19 Infection Survey
Key risks and sources
Key risks
Transmissions, incidence and prevalence
Overall transmission is slightly increasing but remains relatively low.
NHS Capacity
COVID-19 pressure on the NHS remains stabilised at a relatively low level. Some fluctuations are likely to occur, due to low numbers.
Mortality
Remains at a generally low level.
Variants
Additional cases of Delta variant (B.1.617.2, first identified in India) have been detected in Wales and are increasing, although numbers remain low in comparison to other parts of the UK where cases appear to be increasing rapidly. Local intervention will likely be required to prevent uncontrolled growth and wider community transmission in Wales.
Immunity and vaccines
3.48 million doses of COVID-19 vaccine have been given in Wales. Of the 3.48 million doses given nationally, 2.19 million were first doses and 1.29 million were second doses.
International
Traveller numbers have sharply increased compared to the previous week. Arrivals from Portugal have especially increased following its move to the Amber list. Positive cases from Green and Amber countries remain low.