Adroddiad sefyllfaol COVID-19: 29 Ebrill 2021
Diweddariad gan Gell Wybodaeth COVID-19 a'r Grŵp Ymgynghorol Diogelu Iechyd.
Ar y dudalen hon
Crynodeb yr Adroddiad ar Sefyllfa COVID-19 Cymru
Y pwyntiau allweddol i’w nodi
Mae Cymru yn trosglwyddo’n raddol i Lefel Rhybudd 3 o Lefel Rhybudd 4.
Mae trosglwyddiadau o COVID-19 yn gostwng yn gyffredinol ac maent yn gymharol isel. Mae’r amcangyfrif consensws o’r rhif atgynhyrchu ar gyfer Cymru rhwng 0.7 ac 1.0. Ffynhonnell: SPI-M/SAGE
Mae nifer yr achosion o COVID-19 yn gostwng yn gyffredinol ar draws y rhan fwyaf o Gymru. Mae canran y bobl sy’n profi’n bositif am COVID-19 hefyd wedi gostwng ychydig. Ffynhonnell: Iechyd Cyhoeddus Cymru (PHW)
Mae nifer y derbyniadau i ysbytai yn sgil COVID-19 yn parhau i ostwng ac mae marwolaethau cysylltiedig â COVID-19 yn parhau i fod ar lefel gymharol isel. Mae’r niferoedd hyn bellach yn debyg i’r rhai a nodwyd ym mis Medi 2020. Ffynhonnell: Data Gweithredol GIG Cymru
VOC-20DEC-01 (a nodwyd gyntaf yng Nghaint) yw’r amrywiolyn mwyaf cyffredin yng Nghymru o hyd. Mae PHW yn dadansoddi’r holl samplau PCR addas ac yn cynnal trosolwg o amrywiolynnau sy’n peri pryder (VOC) gan gynnwys achosion a fewnforiwyd. Ar 28 Ebrill, mae gwaith dilyniannu genomeg ar brofion COVID-19 wedi nodi 37 o achosion tebygol neu wedi’u cadarnhau o VOC-20DEC-02 (a nodwyd gyntaf yn Ne Affrica), 8 o achosion wedi’u cadarnhau o VUI-21APR-01 (a nodwyd gyntaf yn India) ac 1 achos wedi’i gadarnhau o VOC-21JAN-01 (a nodwyd gyntaf ym Mrasil). Ffynhonnell: PHW
O ran brechu, hyd at 21 Ebrill 2021, roedd cyfanswm o 2.55 miliwn o ddosau o frechlyn COVID-19 wedi’u rhoi yng Nghymru a’u cofnodi ar System Imiwneiddio Cymru COVID-19. O’r 2.55 miliwn o ddosau a roddwyd yn genedlaethol, dosau cyntaf oedd 1.81 miliwn ohonynt ac ail ddosau oedd 0.73 miliwn ohonynt. Ni fydd y niferoedd presennol sydd wedi’u brechu yn diogelu ar lefel y boblogaeth gyfan yn absenoldeb ymddygiadau diogelu eraill. Ffynhonnell: PHW
Dangosyddion allweddol
Mae’r rhan fwyaf o ddangosyddion allweddol yn parhau i ostwng, yn dilyn cyfnod lle cafwyd lefel uchel o drosglwyddiadau ym mis Rhagfyr a mis Ionawr.
| Gwerth cyfredol (24/04/21) | Newid ers yr wythnos flaenorol (17/04/21 – 24/04/21 oni nodir fel arall) | Newid ers y ffigurau a adroddwyd ar gyfer yr adolygiad Lefel Rhybudd blaenorol (17/04/21 – 24/04/21) | |||||||
|---|---|---|---|---|---|---|---|---|---|
| Canran y newid | Newid mewn gwerth | Canran y newid | Newid mewn gwerth | ||||||
| Cyfradd yr achosion a gadarnhawyd (swm treigl 7 diwrnod fesul 100k) | 12 | -20% | (-3) | -20% | (-3) | ||||
| Cyfradd yr achosion a gadarnhawyd yn y rheini sydd dros 60 (swm treigl 7 diwrnod fesul 100k) | 11 | -8% | (-1) | -8% | (-1) | ||||
| Positifedd profion (cyfartaledd treigl 7 diwrnod) | 1.30% | -19% | (-0.3 percentage points) | -19% | (-0.3 percentage points) | ||||
| Poblogaeth yr amcangyfrifir fod ganddi COVID-19 (cyffredinrwydd)1 | 0.12% | 9% | (+0.01 percentage points) | 9% | (+0.01 percentage points) | ||||
| Rhif atgynhyrchu (Rt)2 | 0.7 to 1.0 | -5% | (-0.05) | -5% | (-0.05) | ||||
| Capasiti’r GIG – Derbyniadau3 | 6 | -2% | 0 | -2% | 0 | ||||
| Marwolaethau – data ONS (swm 7 diwrnod)4 | 12 | -8% | (-1) | -8% | (-1) | ||||
| Marwolaethau – data PHW (swm 7 diwrnod) | 6 | -25% | (-2) | -25% | (-2) | ||||
- Mae data diweddaraf yr Arolwg Heintiadau COVID-19 ar gyfer y cyfnod o 10 Ebrill 2021 i 16 Ebrill 2021.
- Mae’r gwerth Rt diweddaraf fel ag yr oedd ar 20 Ebrill 2021. Seiliwyd y newidiadau a ddangosir yn y tabl ar yr amcangyfrif canolog o Rt.
- Y cyfartaledd treigl saith diwrnod hyd at y dyddiad presennol o gleifion y cadarnhawyd bod ganddynt COVID-19 – nid yw’n cynnwys cleifion yr amheuwyd bod ganddynt COVID-19 neu sy’n gwella.
- Y dyddiad diweddaraf ar gyfer data’r Swyddfa Ystadegau Gwladol (ONS) ar farwolaethau yw hyd at 16 Ebrill 2021 (yn hytrach na 24 Ebrill 2021) ar gyfer y gwerth presennol. Defnyddir data hyd at 9 Ebrill 2021 ar gyfer y newid ers yr wythnos flaenorol a defnyddir data hyd at 9 Ebrill 2021 ar gyfer y newid ers yr adolygiad Lefel Rhybudd diwethaf.
What is the current status of the epidemic?
| Local Authority | Number | % of All Wales Total | Case Incidence per 100,000 | Incidence threshold reached | Change from previous week |
|---|---|---|---|---|---|
| Newport | 42 | 11.2% | 27.2 | 25 to < 50 | 5%↑ |
| Gwynedd | 26 | 7.0% | 20.9 | 20 to < 25 | -19% ↓ |
| Swansea | 51 | 13.6% | 20.6 | 20 to < 25 | -24% ↓ |
| Wrexham | 26 | 7.0% | 19.1 | 15 to < 20 | 30%↑ |
| Neath Port Talbot | 24 | 6.4% | 16.7 | 15 to < 20 | -11% ↓ |
| Cardiff | 46 | 12.3% | 12.5 | Under 15 | -45% ↓ |
| Powys | 16 | 4.3% | 12.1 | Under 15 | -24% ↓ |
| Flintshire | 18 | 4.8% | 11.5 | Under 15 | -38% ↓ |
| Bridgend | 16 | 4.3% | 10.9 | Under 15 | 23%↑ |
| Carmarthenshire | 19 | 5.1% | 10.1 | Under 15 | 27%↑ |
| Torfaen | 9 | 2.4% | 9.6 | Under 15 | -40% ↓ |
| Blaenau Gwent | 6 | 1.6% | 8.6 | Under 15 | 500%↑ |
| Vale of Glamorgan | 11 | 2.9% | 8.2 | Under 15 | -21% ↓ |
| Caerphilly | 14 | 3.7% | 7.7 | Under 15 | 8%↑ |
| Ceredigion | 5 | 1.3% | 6.9 | Under 15 | 25%↑ |
| Rhondda Cynon Taf | 14 | 3.7% | 5.8 | Under 15 | -62% ↓ |
| Isle of Anglesey | 4 | 1.1% | 5.7 | Under 15 | -50% ↓ |
| Monmouthshire | 5 | 1.3% | 5.3 | Under 15 | 25%↑ |
| Conwy | 6 | 1.6% | 5.1 | Under 15 | -33% ↓ |
| Merthyr Tydfil | 3 | 0.8% | 5 | Under 15 | -62% ↓ |
| Pembrokeshire | 6 | 1.6% | 4.8 | Under 15 | 20%↑ |
| Denbighshire | 3 | 0.8% | 3.1 | Under 15 | -62% ↓ |
| Unknown | 4 | 1.1% | - | -20% ↓ | |
| Total | 374 | 100.0% | 11.9 | Under 15 | -22% ↓ |
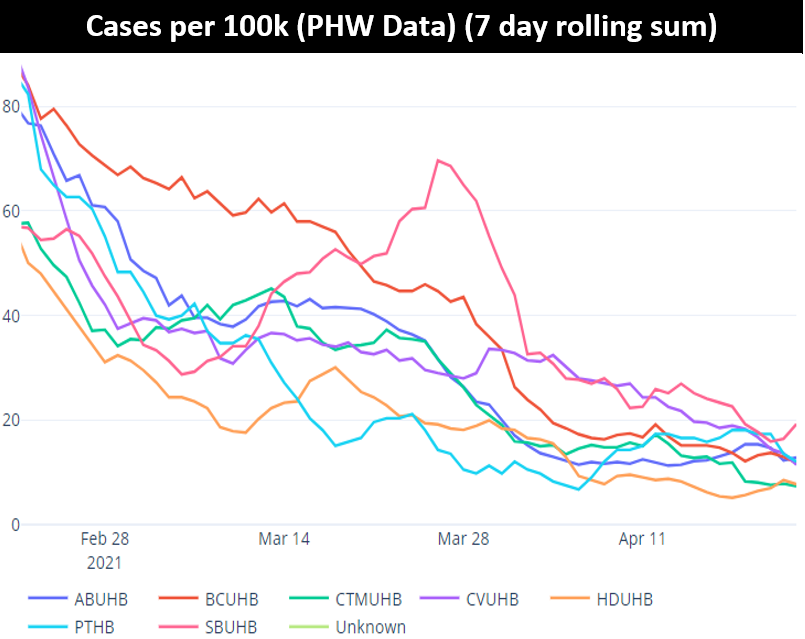
At a Wales level, on 23 April the 7-day rolling incidence of COVID-19 cases and the percentage of people testing positive for COVID-19 have decreased compared with last week.
The SAGE/ SPI-M consensus estimate of Reproduction number (Rt) is 0.7 - 1.0 (as at 20 April 2021). When we look at reproduction numbers using PHW positive test data only (see second table below) - a more timely estimate but limited by variation in testing – we see a reproduction number estimate of 0.81 for Wales. At local health board level, there is considerable variation in the reproduction number (cases only) estimate. The reproduction number (cases only) is at or above 1.0 for the Aneurin Bevan and Hywel Dda Health Boards.
7-day cumulative case incidence is decreasing across most of Wales. At a Wales level, cases per 100,000 is currently at 11.9 per 100,000 population. This is a slight decrease compared to the previous report (15.2 per 100,000 population).
There continues to be variation by local authority and age. Newport is the only local authority with a case incidence rate above the threshold of 25 cases per 100,000. The case incidence for Newport has continued to increase for the second week running.
The table below also provides estimates of doubling and halving times based on COVID-19 positive test data. In this table, halving times are positive, whilst doubling times are negative. The 95% confidence intervals are showing in brackets after the central estimate. An asterisk (*) means that there are small numbers and estimates should be treated with caution. Local health board level estimates of Rt and halving times will be unstable when incidence is low.
| Local Health Board | Rt (cases) | Halving time (days) |
|---|---|---|
| All Wales | 0.81 (0.7 to 0.9) | 40 (13 to -37) |
| Swansea Bay UHB | 0.8 (0.7 to 1.0) | 123 (8 to -10) |
| CTM UHB | 0.6 (0.5 to 0.8) | 11(5 to –28) |
| Aneurin Bevan UHB | 1.0 (0.8 to 1.2) | 36 (7 to –11) DOUBLING |
| Cardiff & Vale UHB | 0.6 (0.5 to 0.7) | 10 (5 to 87) |
| Hywel Dda UHB* | 1.3 (0.9 to 1.7) | 7537 (8 to –8) DOUBLING |
| Powys THB* | 0.9 (0.6 to 1.2) | 17 (5 to –14) DOUBLING |
| Betsi Cadwaladr UHB | 0.8 (0.7 to 1.0) | -58 (8 to –11) |
What is the situation with the NHS and social care?
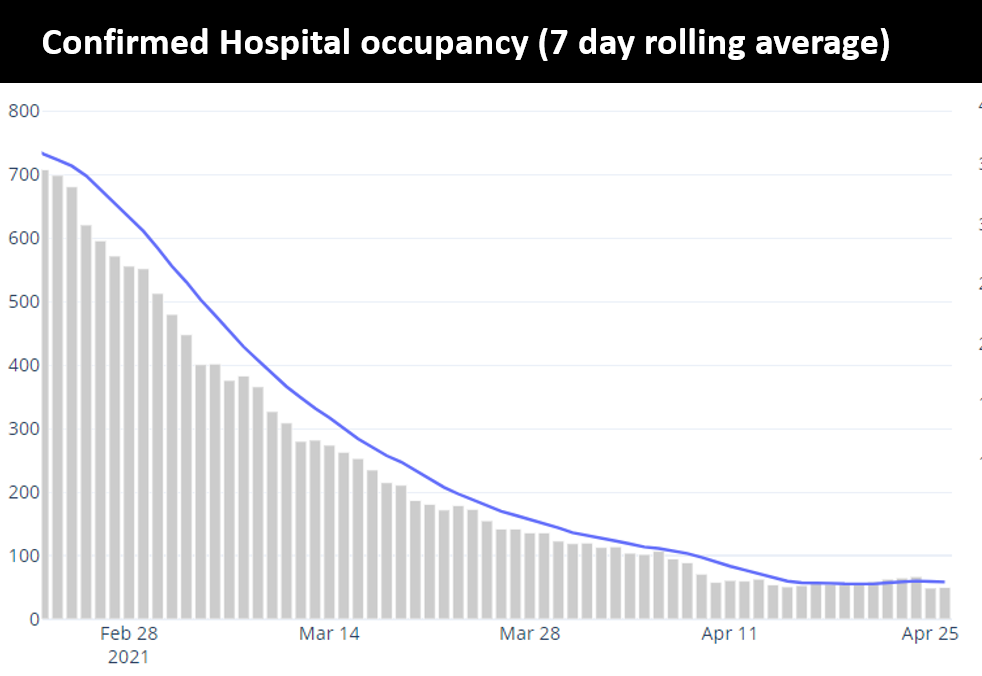
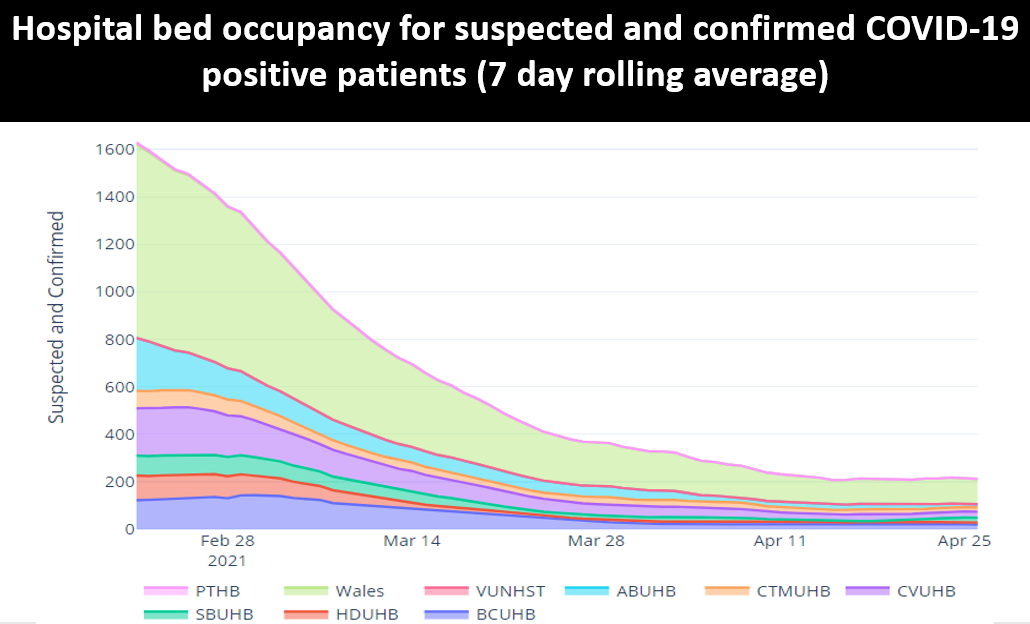
COVID-19 pressure on the NHS continues to improve and is back to the levels seen in mid September last year. As at 28 April 2021 there were 241 COVID-19 related patients (suspected, confirmed and recovering) occupying a hospital bed. Confirmed cases constitute 46 of the total, the lowest number since 17 September when there were 41.
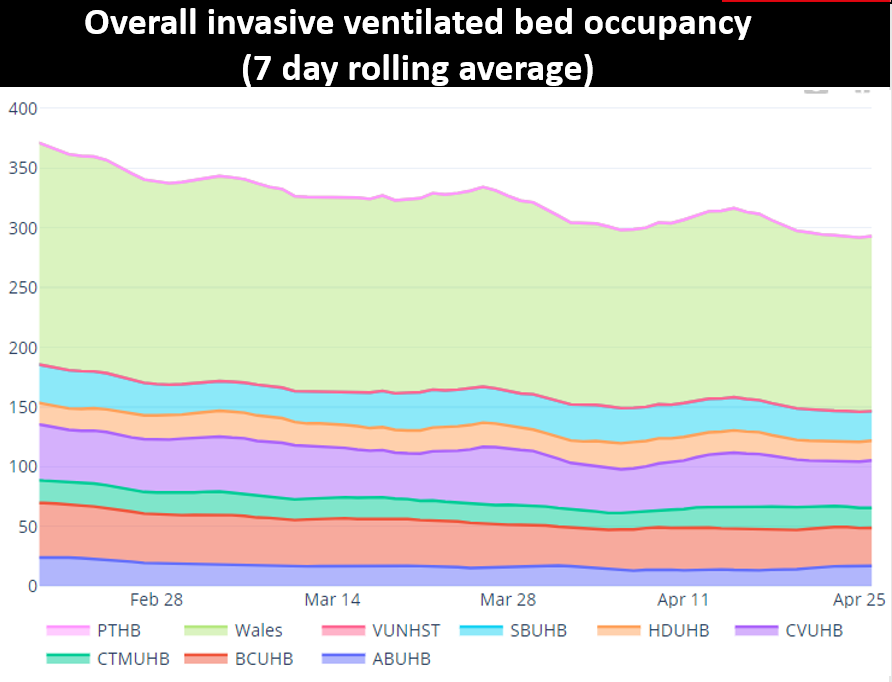
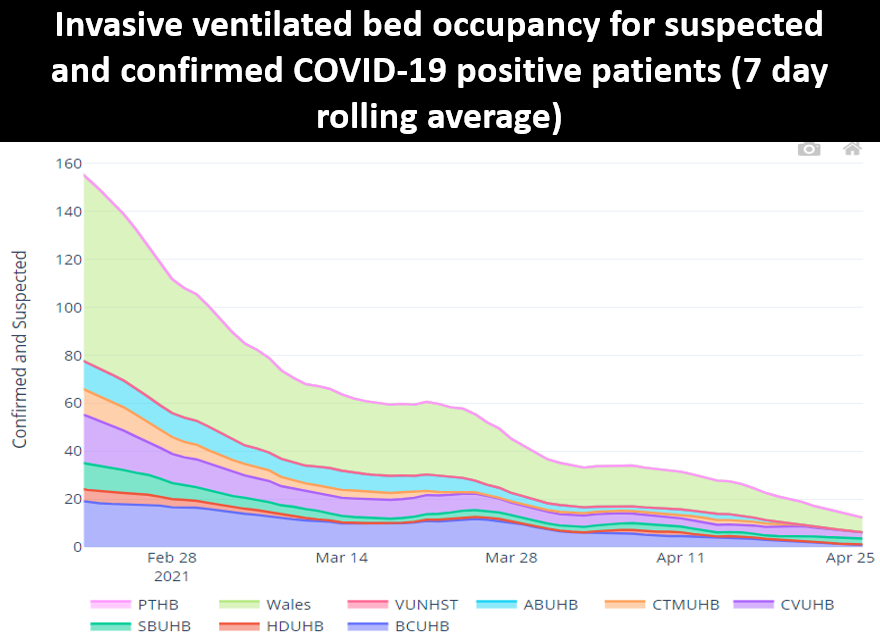
COVID-19 patients in critical care beds is currently at five, this is 159 lower than the maximum COVID-19 position of approximately 164. Confirmed cases constitute two of the total, the lowest number since 13 September when there were also two. The total number of patients in critical care for COVID-19 and non-COVID-19 stands at 163, 11 more than the historic maximum critical care capacity of approximately 152.
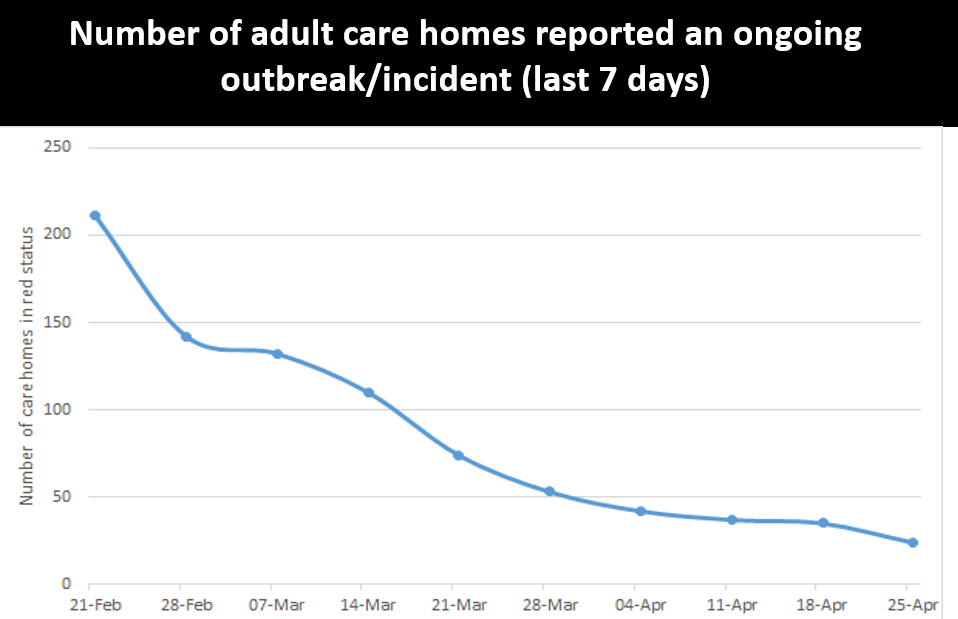
The graph below highlights care homes data, which is reported to Incident Management Teams on a weekly basis. Those noted as red status have reported an outbreak or incident in the last five days.
Up to 22 April 2021, 7 (0.7%) adult care homes in Wales notified CIW of one or more confirmed cases of COVID-19, in staff or residents, in the past 7 days. This is a decrease compared to 12 (1.1%) in the 7 days up to 15 April 2021. The number of notifications is now at the lowest since the guidance change on 17 December 2020.
What is the situation with education, children and young adults?
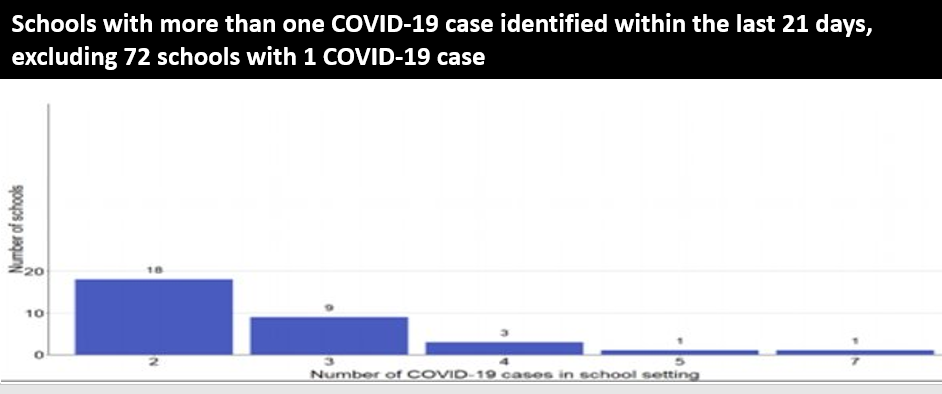
The latest national SBAR covering the week of 19 April to 25 April reported 2 new clusters in childcare settings. IMTs continue to report that infection observed in pupils and staff are commonly the result of community and social interactions outside the school setting, with the acknowledgement that the incidence associated with schools reflects wider community transmission.
At the time of writing for the National SBAR to 25 April, 5 new clusters were reported to be associated with schools over 3 health boards and 23 ongoing clusters were reported over 5 health boards. In the seven days to 25 April, 51 new confirmed cases associated with schools were reported by PHW to Welsh Government: 43* among pupils and 8* among staff. Source: National SBAR
*Please note these totals do not include data from Cwm Taf Morgannwg or Swansea Bay.
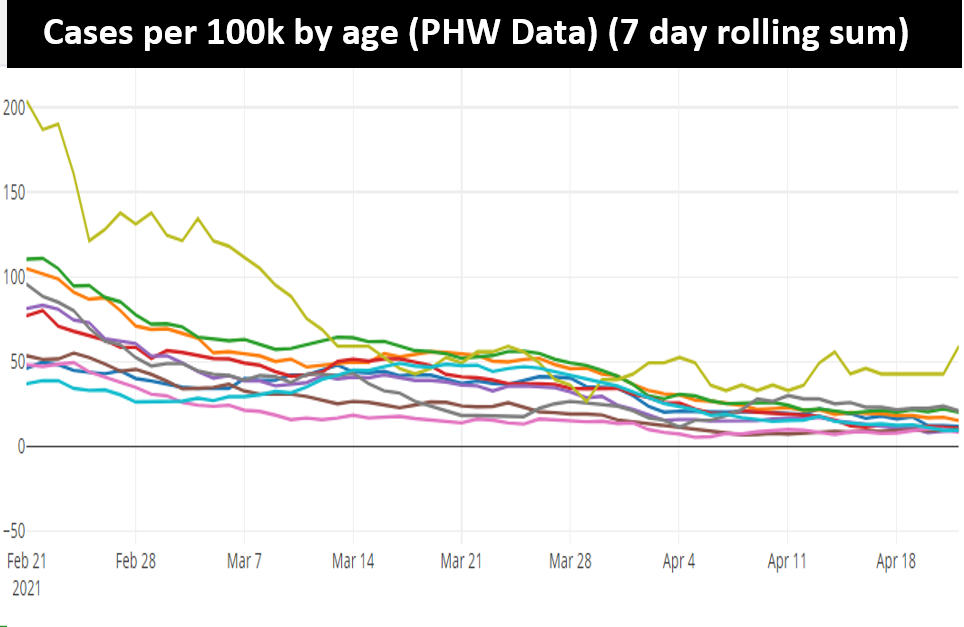
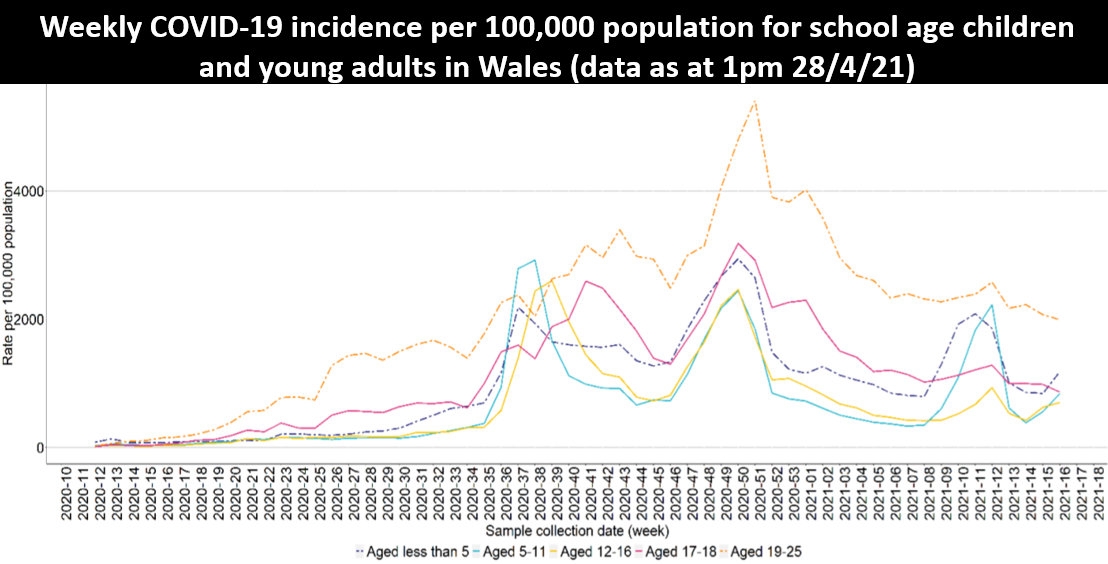
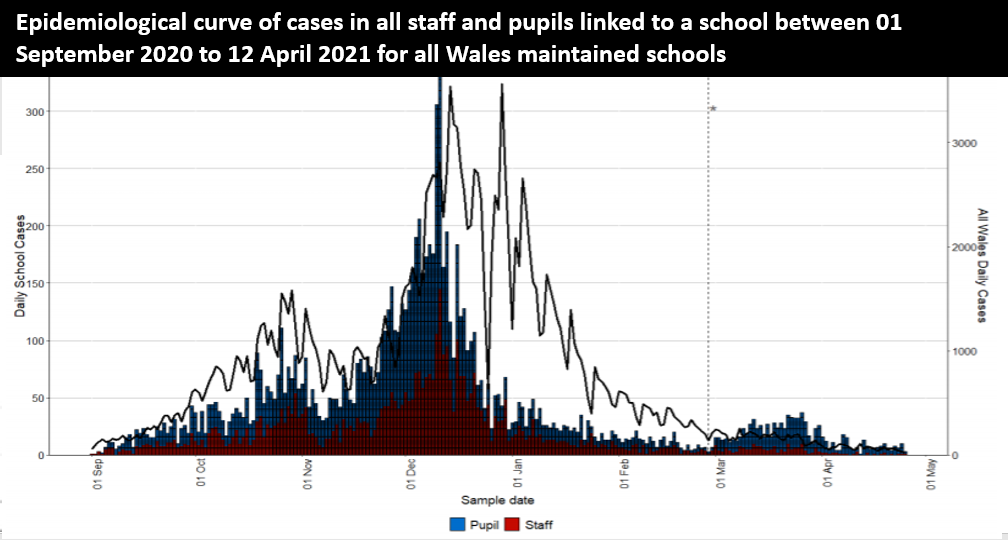
Confirmed case incidence remained stable in those aged under 20 years old in the most recent week ending 25 April.
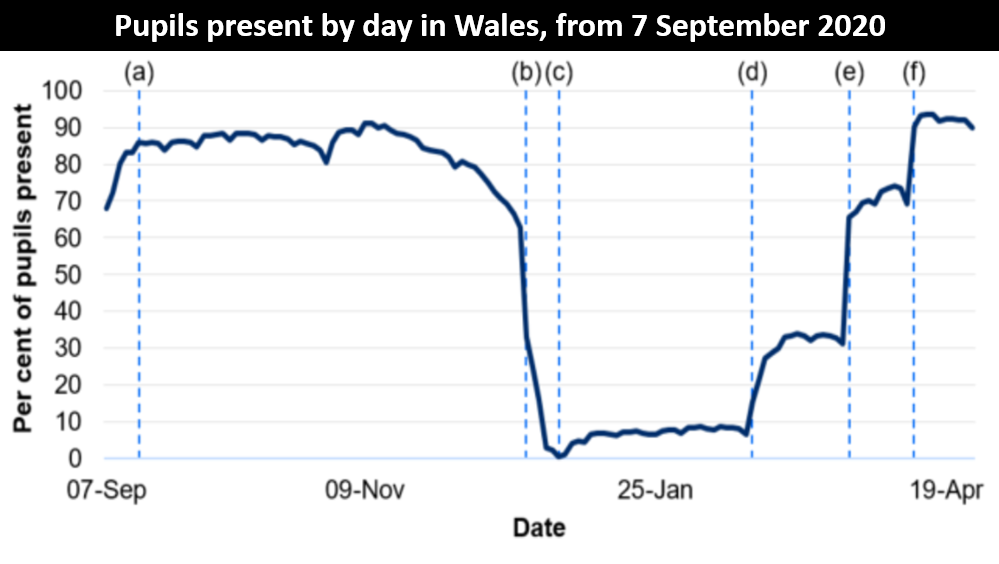
School Attendance
An average of 92% of all pupils were present in school over the week of 19 April to 23 April, the second highest rate of this academic year to date. This information is provisional and will be revised on 10 May.
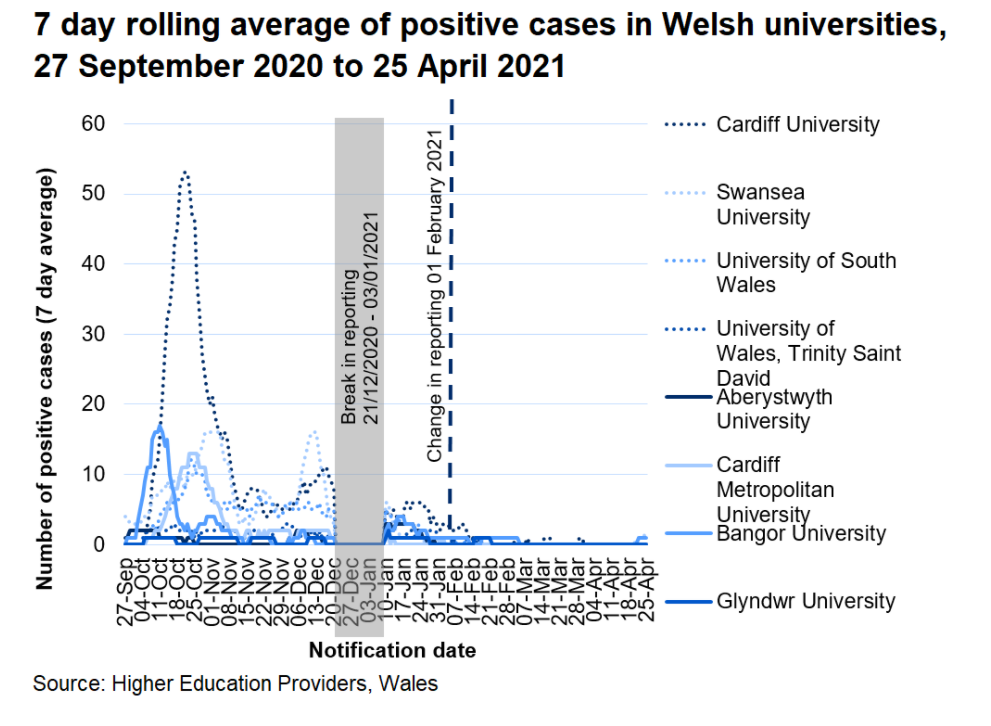
HEIs in Wales have, since January, prioritised a return to in person blended learning for those students with practical and qualification requirement that cannot be met via online learning only and where in person learning is necessary to complete learning outcomes. University facilities, such as libraries, laboratories and study spaces, have been open for those who need access.
From 12 April HEIs have fully opened for blended learning with all students invited to access online and in person learning. HEIs report cases notified to them by students and staff. From 1 February 2021 most HEIs have changed the way in which they report data, with positive cases referring only to students or staff attending campus or returning to the local area for study (with the exception of University of Wales Trinity St David's who are unable to split cases on this basis). Over the past week, the 7-day rolling average has been less than 3 positive COVID-19 cases for all HEI's.
There is currently Voluntary LFD testing of childcare staff, school staff, Further Education (FE) and Higher Education (HE) staff; FE and HE students, and older secondary school aged pupils. Detailed information on LFD test outcomes is not yet available.
Please note: due to accuracy and timeliness limitations with the capability of our surveillance systems, distinguishing exact case associations between children over 19, school staff and/or family members is currently not possible. However feedback from local health protection officers will be taken into account in future updates.
What does the situation look like going forward?
Based on the current rates observed with current restrictions:
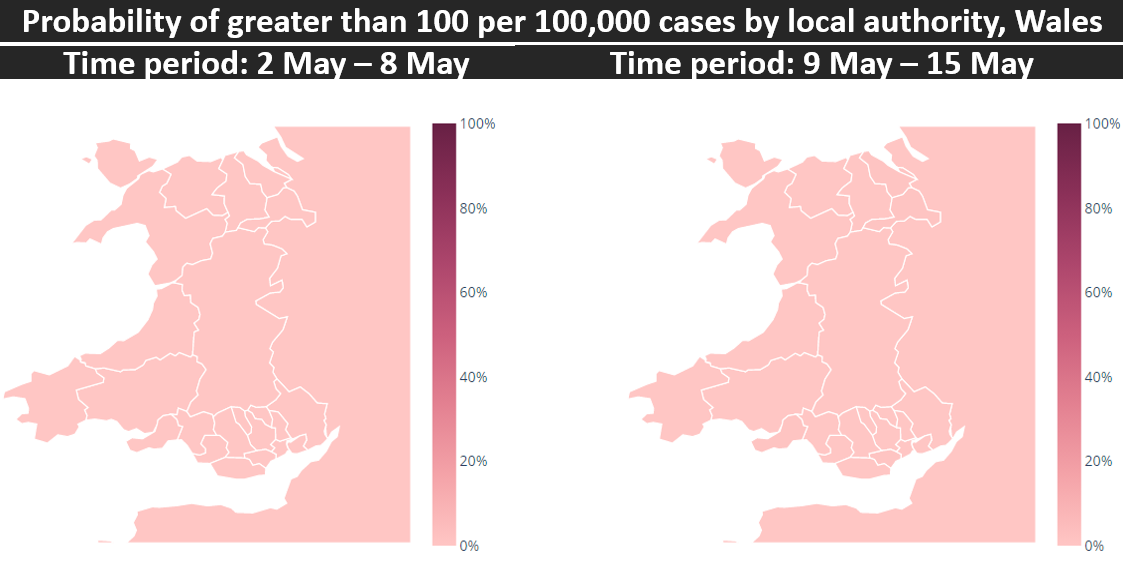
- Cases – the probability of incidence greater that 100 per 100,000 remains low for all local authorities. The figure illustrates the probability (between 0 – 100%) of incidence being greater than 100 per 100,000. Source: Imperial College London
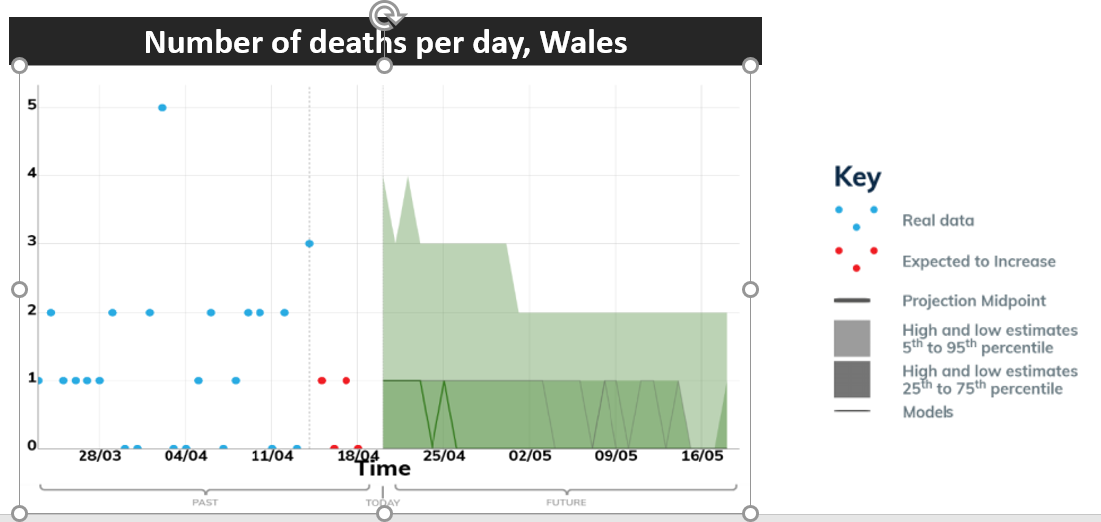
- Deaths per day – continue to see small numbers over the next four weeks. Source: Modelled medium term projections, SAGE, 20 April
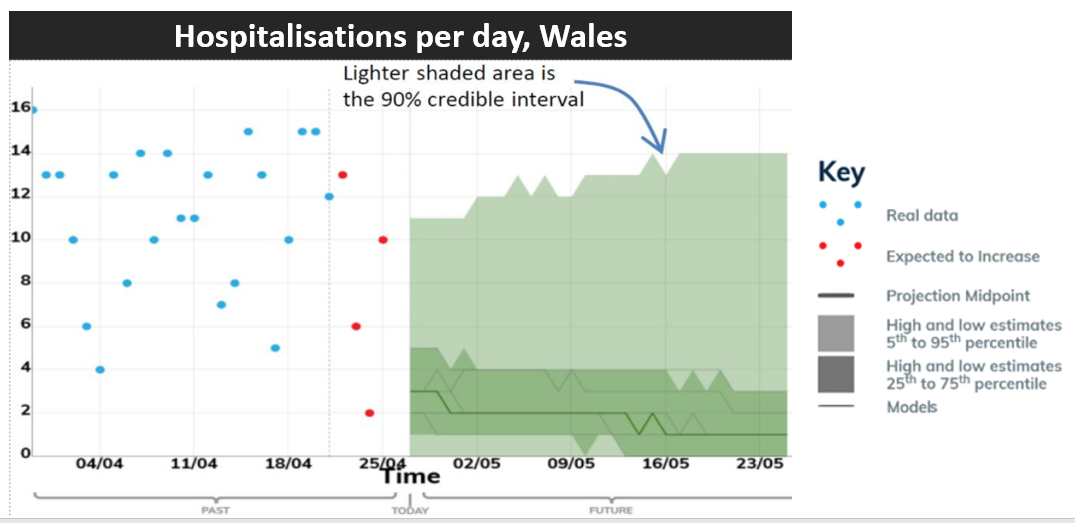
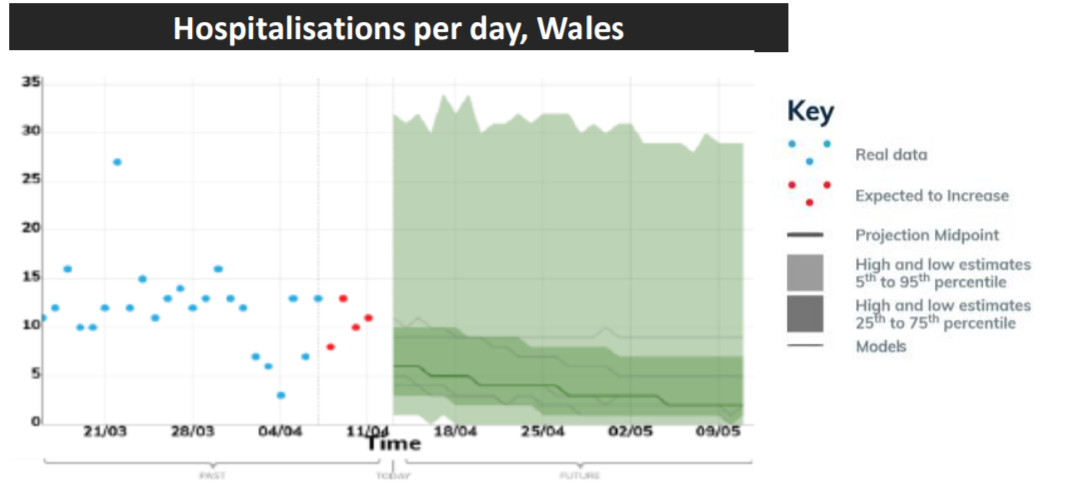
- Hospitalisations per day - continue to decrease to 1 per day over the next four weeks. Source: Modelled medium term projections, SAGE, 27 April
These projections are based on current trends and will not fully reflect the impact of policy or behavioural changes over the past two to three weeks. They are not forecasts or predictions.
Mobility data, adherence and UK comparison
Mobility has generally remained steady for the week to 23 April following the general increase in mobility observed the previous week, which was likely linked to lifting of restrictions and sunny weather.
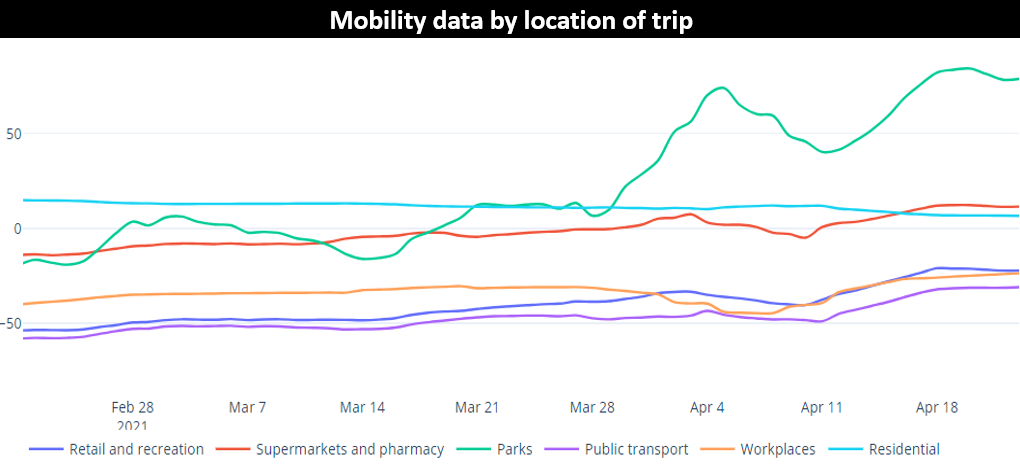
Source: Google
Adherence
Data for 26 – 30 March shows reductions in self-reported adherence to restrictions in some categories compared to the previous period 26 February – 1 March, especially in those making essential trip only, which follows the easing of restrictions from stay at home on 13 March. This is self-reported adherence and will be affected by individuals' understanding of guidance. Souce: IPSOS MORI
UK comparison
The percentage of people testing positive has stabilised in Wales in recent weeks. In Wales, the percentage of people testing positive was steady or slightly increased in the two weeks up to 16 April 2021. We estimate that 3,600 people in Wales had COVID-19 (95% credible interval: 1,700 to 6,400), compared to around 3,300 people in the two weeks up to 10 April 2021. This equates to around 1 in 840 people in Wales and compares to around 1 in 610 people in England, around 1 in 560 people in Scotland and around 1 in 660 people in Northern Ireland.
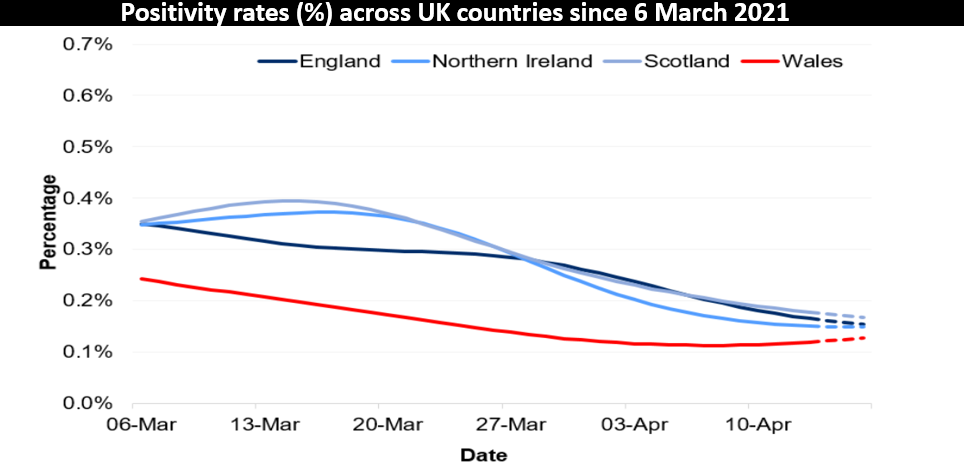
Source: Office for National Statistics COVID-19 Infection Survey
Key risks and sources
Key risks
Transmissions, incidence and prevalence
Overall transmission is generally decreasing and relatively low.
NHS Capacity
Overall COVID-19 hospital admissions continue to fall with numbers now comparable to those observed in September 2020.
Mortality
Remains at a generally low level.
Variants
VOC-20DEC-01 (the Kent variant) is the dominant variant in Wales.
Immunity and vaccines
2.55 million doses of COVID-19 vaccine were given in Wales. Of the 2.55 million doses given nationally, 1.81 million were first doses and 0.73 million were second doses.