Neidio i'r prif gynnwy

Mae'r papur hwn yn darparu senarios wedi'u modelu ar gyfer ffliw, COVID-19 a feirws syncytiol anadlol (RSV) ar gyfer tymor y gaeaf sydd i ddod.

Cyhoeddwyd gyntaf: 21 Medi 2026
Diweddarwyd ddiwethaf: 21 Medi 2026

Part 1: introduction

Introduction

Winter respiratory viruses are associated with seasonal increases in mortality and morbidity and consistently increase pressure on NHS Wales, though their impact varies each year.

Uncertainty remains due to factors such as the timing of when different viruses see peak activity and the effectiveness of seasonal vaccines.

This paper presents modelled scenarios based on historical data to support winter 2026 to 2027 planning for NHS Wales.

It estimates potential pressures on hospitals, in terms of admissions and bed occupancy, from seasonal respiratory viruses, with a focus on:

  • influenza (flu)
  • RSV
  • COVID-19

Whilst we observe COVID-19 activity all year round, there are recognised winter peaks and overlapping peaks with flu and RSV could compound demand on healthcare services.

The report also examines wider impacts of winter pressures across NHS Wales beyond hospital admissions, including:

  • ambulance calls
  • Emergency Department attendances
  • primary care activity due to respiratory illnesses
  • trends in GP consultation rates for acute respiratory infections

Important information about the modelling

As with all modelling, the scenarios in this paper are not a prediction of what will happen but estimates of what could happen.

  • we could also see similar peaks occurring at a different time in the season.
  • we aim to present a manageable number of selected example scenarios rather than every possible scenario of what might happen.
  • the modelling uses past data to estimate future projections.
  • any changes to the NHS system (For example, propensity to admit people to hospital, changes in access to primary care), particularly in the past 12 months, may not have been taken into account in the modelling.

Respiratory virus activity varies substantially between seasons, particularly for influenza, where the incidence, timing, duration and severity of outbreaks are influenced by factors such as:

  • circulating strains
  • population immunity
  • vaccine effectiveness

resulting in considerable year to year uncertainty.

This paper estimates the impact of known viruses and other determinants of health likely to increase the demand for healthcare in Wales across the 2026 to 2027 winter period.

It should be used as an indication of what we expect to see based on historical data, rather than what will happen.

This 2026 to 2027 winter modelling report has also included additional epidemiological modelling techniques. These are identified throughout the report and explained in further detail in the Annex.

Definitions and terminology

The terminology used throughout this report is defined below. For further information on data sources used for the analysis in this report, see the Annex.

Data definitions

Admissions (daily)

Definition

The daily count of new hospital inpatient episodes in which the relevant ICD-10 diagnosis code appears in any diagnostic position (not limited to the primary diagnosis), recorded at the admitting episode only (the first episode of the spell). Day cases are included.

Notes and context

See the NHS Wales Data Dictionary.

Bed occupancy (daily)

Definition

The daily count of occupied hospital beds during a specified period.

Notes and context
  • Bed occupancy is often referred to as ‘occupancy’ within this report.
  • Distinct from new daily inpatient count, it captures the ongoing in-hospital caseload.

Emergency Department attendance

Definition

A recorded visit by a patient to an Accident and Emergency department for treatment provided by that service. For this report, the focus is on attendances flagged with a respiratory diagnosis across winter.

Notes and context

GP consultation rate

Definition

The number of GP consultations for acute respiratory infections (ARI) per 100,000 registered practice population, derived from the GP Sentinel Surveillance of Infections Scheme in Wales.

Diagnosis is based on syndromic evaluation. No pathogen-specific laboratory confirmation is required, so rates may over or underestimate the true incidence of individual pathogens.

Notes and context

Two age bands are reported:

  • children (0 to 14 years old)
  • adults (15 years old and over)

ICD-10 codes

Definition

The International Classification of Diseases, 10th Revision, a standardised World Health Organization coding system used to classify diagnoses on hospital records.

Notes and context

The analysis in this report uses the following ICD-10 codes:

Influenza

  • J09
  • J10
  • J11

RSV

  • J12.1
  • J20.5
  • J21.0
  • B97.4

COVID-19

  • U07.1
  • U07.2
  • U09.9
  • U10.9

Other infections

  • J12 to J22X (excluding the RSV codes)
  • B05 to B06
  • A08.1
  • A37
  • B950
  • A400
  • A389
  • B9781

For more details, see Tables A13 and A14 in the Annex.

Terminology

Average

Definition

The arithmetic mean (sum of all values divided by the count of values), unless stated otherwise.

Notes and context

Median or mode are identified explicitly where used.

Peak

Definition

The single highest value of the 7 day rolling averages of the recorded values within a given winter period (1 September 2026 to 31 March 2027).

The peak date is the calendar date on which this maximum was observed. Where the same maximum value occurs on consecutive dates, all such dates are reported.

Notes and context

Peak dates may span multiple consecutive days.

Winter period

Definition

1 September 2026 to 31 March 2027 (inclusive). Unless stated otherwise, all analysis is restricted to this window.

Notes and context

Vaccine rollout analysis covers the full calendar year where relevant.

Background

The data and modelling presented in this report have several uses.

The respiratory winter modelling of hospital admissions presented in this report are compared to observed values (‘actuals’) on a weekly basis throughout the winter period (between September 2026 and March 2027 inclusive).

They are presented at system resilience and planning meetings to stakeholders including NHS Performance and Improvement colleagues, Public Health Wales (PHW), and decision-makers/planners in the Welsh Government and Local Health Boards.

This is to provide awareness and an early warning of increases in respiratory illnesses, particularly where the admissions may differ from what is expected, allowing for earlier and effective planning.

For instance, this may include:

  • planning for surge capacity
  • cancelling non-urgent surgical activity
  • cancelling surgery that may require critical care beds

At these meetings, as well as the winter modelling presented in this report, additional separate modelling is also provided which projects forward 2 weeks (short-term projections) to give an idea of estimated admissions over the coming fortnight.

These models are also compared to actuals on a regular basis throughout winter and are published in our communicable disease surveillance reports.

For further detail on performance of the STPs during the 2025 to 2026 winter, please see this report.

As well as this winter modelling report, we will also publish a technical report to provide users with more detail on the methodology, assumptions and limitations on the RSV and flu epidemiological compartmental models used as part of this winter modelling work.

At the time of publication, the technical reports are awaiting peer review but are published with this caveat in the interests of transparency.

The RSV compartment model passed the previous Welsh Government Annual Assurance Process and will be assessed again this year along with the flu compartment model.

Local health board users also make use of the report and the underlying data of which they have access to which goes down to health board level.

This year, health board decision makers will be able to access an interactive dashboard to consider and compare their historic data and winter scenarios with other health boards and with the overall Wales-level data.

This allows users to view data that is important and relevant to them, providing real-time access to the winter modelling produced by the Science Research Evidence (SRE) Division, Welsh Government, which can be used for live planning and response.

Additional factors to consider

Adverse weather can significantly impact health and health and care services in terms of:

  • spread of diseases
  • supply chains
  • workforce availability
  • accessibility of services due to travel disruptions

In recent months, The Met Office has warned of ‘unprecedented’ El Niño predicted for winter 2026 to 2027 in the UK.

El Niño is a naturally occurring phenomenon that happens over the Pacific Ocean roughly every 2 to 7 years, which can increase global temperatures.

A typical El Niño leads to an equatorial Pacific sea-surface temperature rise of between 1 to 2°C, with 2°C being defined as a big event.

The Met Office’s long-range El Niño forecast (Kettleborough et al 2026) are showing record values of sea-surface temperature increases of more than 3°C in the coming months.

The influence of El Niño increases the chances of wetter, stormier conditions for Northwest Europe, including the UK, in the coming autumn and early winter.

The Met Office’s long-range forecast is a prediction of what may happen.

The Met Office is monitoring and continually running new forecasts as well as working with government departments to understand the wider implications of the 2026 El Niño and will provide further updates as winter approaches.

Behavioural factors are an important determinant of winter health outcomes and associated demand on health and care services.

Population-level behaviours, including:

  • uptake of respiratory vaccinations
  • healthcare-seeking decisions
  • adherence to infection prevention measures
  • social contact patterns
  • actions relating to warmth, nutrition and self-care

can influence transmission, disease severity and service utilisation.

These behaviours are shaped by a range of interacting factors, including:

  • risk perception
  • trust
  • social norms
  • accessibility of services
  • wider socioeconomic circumstances

Consequently, behavioural responses can amplify or mitigate winter pressures and represent an important source of uncertainty within winter planning assumptions.

Consideration of behavioural drivers, barriers and likely responses to public health interventions should therefore complement epidemiological and service capacity modelling when assessing potential winter impacts and identifying opportunities to reduce avoidable demand.

Using information from Australia to estimate what we may see in Wales, the flu season may see similar figures to 2025 although there could be increased proportion of influenza B and a potential shift in the dominant form of COVID-19.

The potential increase in influenza B reinforces the role in vaccines, in particular, the usefulness of school-age campaigns to reduce predicted winter demand on health services.

See the Annex for further information.

Last year’s modelling compared with actuals

The hospital admissions modelling scenarios for flu, RSV (ages 0 to 4 years), and COVID-19 provided in the 2025 to 2026 winter modelling report have been compared with the observed data (actuals) provided by Digital Health and Care Wales (DHCW) up to the end of 31 March 2026.

Overall, the analysis suggests the scenarios tracked closely with:

  • the ‘High Season, VU = 60%’ scenarios for RSV (ages 0 to 4 years)
  • the ‘Moderate’ scenarios for COVID-19
  • the ‘Moderate’ scenarios for flu

The modelled peaks for these scenarios were extremely close to the observed admissions (actuals).

However, the observed flu season did begin earlier than expected.

Please see the Annex for further detail on last year’s 2025 to 2026 winter modelling compared to the actual number of hospital admissions which occurred.

Winter peaks

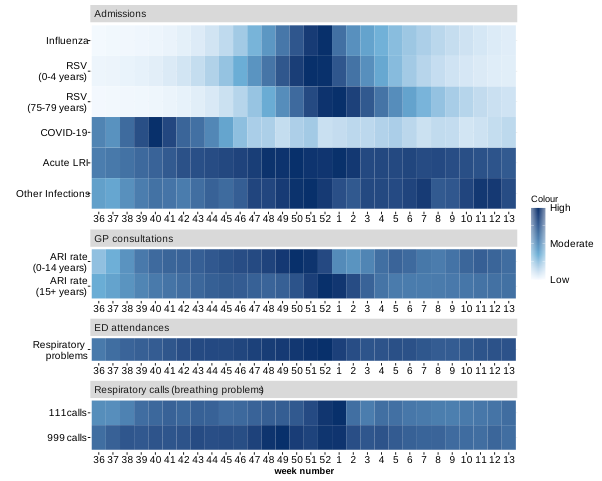
To convey winter pressures for different elements of the health care system (admissions, ED attendances and GP consultations), a heat map of the most likely scenarios (MLS) of 9 modelled indicators was created. (See Figure 1).

Most of the respiratory pressure across healthcare settings throughout the 2026 to 2027 winter is expected to occur towards late December and early January.

However, COVID-19 admissions are estimated to peak about 2 to 3 months ahead of this (See Figure 1).

COVID-19 is projected to be the earliest driver of hospital pressure during the winter of 2026 to 2027, with projected admissions peaking in week 40, well ahead of the main winter period.

The COVID-19 MLS then declines steadily and is estimated to remain low for the rest of the winter, contributing little to the peak-period pressure experienced around the end of 2026.

RSV admissions in children aged 0 to 4 years peak in week 51, while:

  • flu admissions
  • emergency department (ED) respiratory attendances
  • adult GP acute respiratory infection (ARI) consultations
  • other infections of interest

all peak in week 52.

This period represents the point of maximum system-wide pressure.

Critically, demand peaks are not staggered: primary care, emergency departments, and inpatient services all reach their respective maxima within the same week, limiting opportunities to redistribute capacity across care pathways.

This peak also coincides with the Christmas period, when staffing levels are typically at their lowest, further intensifying operational pressures.

RSV admissions in adults aged 75 years and above are estimated to peak in week 1 2027, alongside:

  • 111 respiratory calls
  • acute lower respiratory infections (not classified as being due to flu, RSV or COVID-19) referred to as ALRI from here on

ALRI, including pneumonia, acute bronchitis, and bronchiolitis (See Annex), do not show a sharp peak but sustain a high plateau from around week 48 through to week 2, providing a prolonged background burden that overlaps the influenza and RSV peaks rather than following them.

Pressure from seasonal illnesses (for example, flu, RSV) then eases gradually across weeks 3 to 13.

Figure 1: Most likely modelled scenario pressures due to admissions, ED attendances, GP consultations and respiratory calls between week 36 and 13 of Winter 2026 to 2027 [Note 1]
Image
a heatmap comparing the likely winter pressure distribution across various infections and healthcare systems in Wales.

Description of figure 1: a heatmap comparing the likely winter pressure distribution across various infections and healthcare systems in Wales.

Sources: Science Research Evidence (SRE) analysis using data provided by Digital Health and Care Wales (DHCW) and Public Health Wales (PHW).

[Note 1]: The average value for each week was calculated from daily data from the modelled most likely scenarios. ‘High’, where the darkest blue is observed, refers to the estimated 2026 to 2027 winter peak. All other colours are relative to the estimated peaks.
Part 2: headline results

Acute respiratory infections

Table 1: Headline results – acute respiratory infections

HeadingSubheadingSummary
CombinedAdmissionsThe combined MLS and RWC admissions scenario anticipate peaks on 24 December 2026 of 214 and 258 daily admissions respectively.
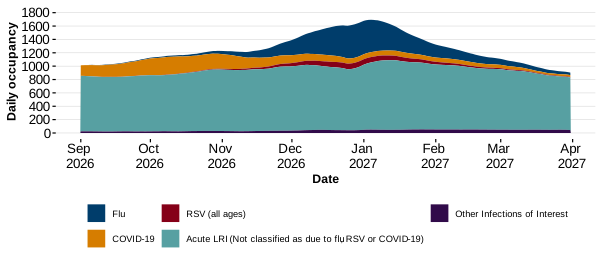
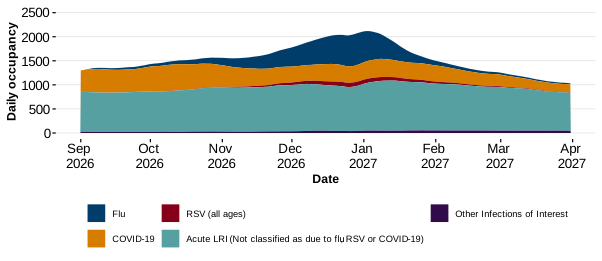
CombinedBed occupancyThe combined MLS and RWC occupancy scenarios estimate a peak of 1,694 and 2,118 beds respectively in the first week of January 2027.
FluAdmissionsDuring the 2025 to 2026 winter, there were 3,513 flu admissions with a peak of 56 which occurred in the last week of December 2025.

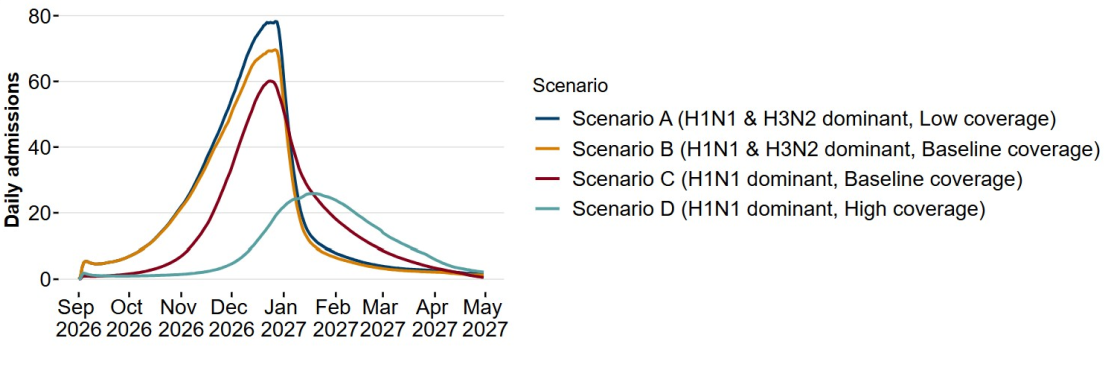
Three of the four flu scenarios estimate peaks of 78, 70 and 60 daily admissions in the last two weeks of December 2026, and a much lower peak for the high vaccine coverage scenario of 26 admissions estimated to occur mid-January 2027.
FluBed occupancyIn the 2025 to 2026 winter, flu occupancy peaked at 286 beds on 4 January 2026.

Three of the four flu scenarios estimate peaks of 660, 578 and 503 beds occupied per day in the last week of December 2026, and a much lower peak for the high vaccine coverage scenario of 220 beds estimated to occur on 22 January 2027.
RSV age 0 to 4 yearsAdmissionsDuring the 2025 to 2026 winter, there were 1,004 RSV paediatric admissions with a peak of 19 admissions in the third week of December 2025.

The scenarios estimate daily peaks of 13 to 14 RSV paediatric admissions, expected to occur around 20 December 2026.
RSV age 0 to 4 yearsBed occupancyBed occupancy due to RSV in children aged 0 to 4 years peaked at 31 beds per day between 18 to 20 December 2025.

The RSV bed occupancy modelling scenarios estimate peaks of 30-33 paediatric beds being occupied on 20 to 21 December 2026.
RSV age 75 to 79 yearsAdmissionsDuring the 2025 to 2026 winter season, there were a total of 180 RSV admissions among older adults (75-79 years) with the daily admissions peaking at 3 admissions on 15 January 2026.

The modelled scenarios estimate peaks of up to 2 daily admissions between 31 December 2026 and 2 January 2027.
RSV age 75 to 79 yearsBed occupancyBed occupancy due to RSV in older adults (75 to 79 years) peaked at 35 beds per day between 26 to 27 January 2026.

The bed occupancy modelling scenarios estimate peaks of 23 to 31 beds per day on 8 to 9 January 2027.
COVID-19AdmissionsThe number of admissions due to COVID-19 totalled 1,551 during the 2025 to 2026 winter. The peak daily admissions of 24 occurred in the first week of October 2025.

The peaks of the modelled scenarios are estimated to range from 13 to 40 daily admissions and are estimated to occur on 03 October 2026.
COVID-19Bed occupancyDuring the 2025 to 2026 winter, there was a daily maximum of 264 beds occupied due to COVID-19 on 9 October 2025.

The COVID-19 bed occupancy modelling provides a wide range of scenarios estimating peaks of 63, 264 and 543 beds on 9 to 13 October 2026.

Primary care

Table 2: Headline results – primary care

HeadingSubheadingSummary
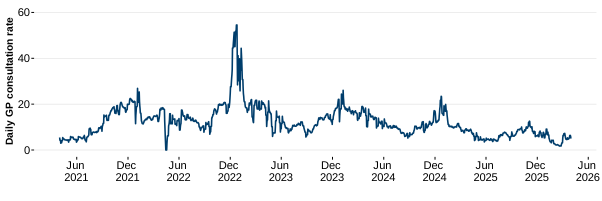
ARI GP consultation ratesGP rates -Children (age 0 to 4)ARI GP consultation rates in children (aged 0 to14 years inclusive) peaked at 70.9, 69.4 and 31.8 during the winters of 2023 to 2024, 2024 to 2025, and 2025 to 2026, respectively.

For children (aged 0 to 14 years), the ARI GP consultation rate modelling estimates a wide range of scenarios where the peaks reach are 261.5, 45.6 and 14.0 consultations per 100,000 GP population, which are estimated to occur on 31 October 2026, 01 November 2026, and 10 to 11 December 2026.
ARI GP consultation ratesGP rates -Adults (age 15 years or older)ARI GP consultation rates in adults (aged 15 years and above) peaked at 26.0, 23.4, and 12.6 during the winters of 2023 to 2024, 2024 to 2025, and 2025 to 2026, respectively.

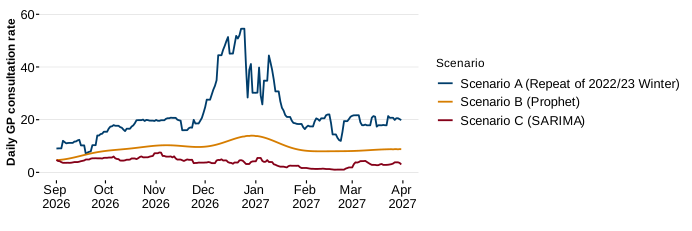
Under two of the modelling scenarios, the peaks of 54.5 and 13.9 are estimated to occur on or around the bank holidays at Christmas and New Year. The third scenario provides a lower peak of 7.6 on 3 November 2026.
111 callsRespiratory 111 calls2025 to 2026 winter shows a moderate peak of 130 calls which occurred on 1 January 2026.

The 111 calls modelling scenarios estimate peaks of 116, 147 and 169 may occur on 29 December 2026 and early January 2027.


Respiratory Emergency Department attendances and ambulance calls

Table 3: Headline results – respiratory ED attendances and ambulance calls

HeadingSubheadingSummary
Emergency departmentAttendances due to respiratory illnessIn the 2025 to 2026 winter, there were 49,320 ED attendances due to respiratory problems and attendances peaked at 307 in the first week of January 2025.

The modelling scenarios estimate peaks of 417, 301 and 261 ED attendances in last week of December 2026.
Ambulance calls999 calls due to breathing problemsIn the 2025 to 2026 winter, there were 28,760 ambulance calls due to breathing problems with a peak of 182 ambulance calls occurring on 02 January 2026.

The modelling scenarios estimate peaks of 141, 202, or 254 calls between 30 December 2026 and 2 January 2027.

Part 3: acute respiratory infections admissions and occupancy

Acute respiratory infection admissions and occupancy

This section provides historic analysis and future modelled scenarios of hospital admissions and hospital bed occupancy for the three main respiratory illnesses:

  • flu
  • RSV
  • COVID-19

As well as including modelling for each of the three main respiratory illnesses, combined modelling scenarios are also provided which take into account other viral infections too to reflect the wider impact due to infections on the healthcare system throughout the winter period.

For the three main respiratory viruses (flu, RSV and COVID-19), modelling scenarios are presented indicating a range of possible scenarios for winter 2026 to 2027.

The modelling provides at least three scenarios for each virus:

  • a lower-bound scenario
  • a mid-range scenario (sometimes considered a most likely scenario, MLS)
  • an upper-bound or reasonable worst case (RWC) scenario

COVID-19 scenarios anticipate peaks occurring in October 2026.

RSV scenarios estimate peaks between November and December 2026 while flu scenarios suggest peaks between December 2026 and January 2027.

Other infections included in the modelling

There are also infections such as pneumonia, bronchitis and bronchiolitis to consider.

To capture patients in hospital with these infections who aren’t already classed as having flu, RSV or COVID-19, we grouped those with ICD10 codes J12 to J22 (excluding the flu, RSV and COVID-19 ICD10 codes).

This grouping will be referred to as ‘acute lower respiratory infection not classified as due to flu, RSV or COVID-19’ or ‘ALRI’ from here on.

For the full list of ICD10 codes used, please see the Annex.

To assess the impact of additional infections (where the patients in hospital were not already classed as having flu, RSV or COVID-19 or ALRI), admissions attributed to:

  • Measles and Rubella (B05 to B06)
  • Norovirus (A08.1)
  • Whooping cough (A37)
  • Streptococcus A (B950, A400, and A389)
  • other viral agents as the cause of diseases classified elsewhere (B978)

were quantified.

This grouping will be referred to as ‘other infections of interest’ from here on.

For the full list of ICD10 codes used, please see the Annex.

The pressure on hospitals from ‘acute lower respiratory infection not classified as due to flu, RSV or COVID-19’ and from ‘other infections of interest’ remains similar throughout the year, whereas the pressure from flu, RSV and COVID-19 have clear peaks, which places additional strain on hospitals during winter.

Combined scenarios

To assess the collective impact of infections throughout winter, a Most Likely Scenario (MLS) and a Reasonable Worst Case (RWC) scenario were selected for flu, RSV and COVID-19.

These were then added together and combined with the three-year average of:

  • ‘acute lower respiratory infection (ALRI) not classified as due to flu, RSV or COVID-19’
  • ‘other infections of interest’

described above (based on data covering the 2023 to 2024, 2024 to 2025, and 2025 to 2026 winter seasons).

Further details of the scenarios are provided in the Annex (Tables A2 and A3).

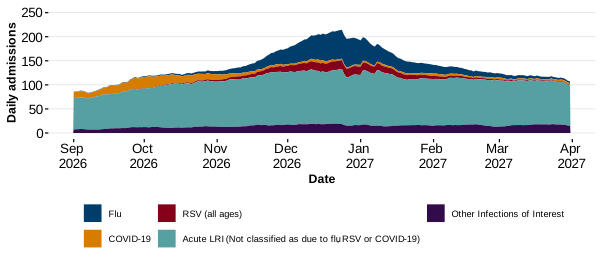
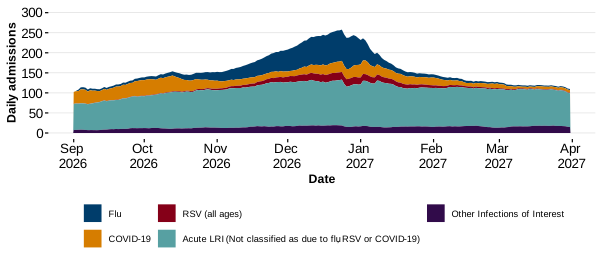
Figures 2 to 5 show the projected combined scenarios for the period from 1 September 2026 to 1 March 2027.

According to modelling projections:

  • The combined MLS and RWC admissions scenario anticipate peaks on 24 December 2026 of 214 and 258 daily admissions respectively.
  • The combined MLS occupancy estimates a peak of 1,694 beds on 4 January 2027.
  • The combined RWC occupancy estimates a peak of 2,118 beds on 3 January 2027.

Figure 2: Combined Most Likely Scenario (MLS) – Daily Hospital Admissions (including ICU admissions), between September 2026 and March 2027

Image
An area chart illustrating the combined MLS for daily hospital admissions across Wales during the 2026/27 winter season for influenza, RSV, COVID-19, ALRI not classified as due to flu, RSV or COVID-19, and other infections of interest.

Description of Figure 2: An area chart illustrating the combined MLS for daily hospital admissions across Wales during the 2026 to 2027 winter season for influenza, RSV, COVID-19, ALRI not classified as due to flu, RSV or COVID-19, and other infections of interest.

Source: SRE calculations using PEDW data provided by DHCW

Figure 3: Combined Reasonable Worst Case (RWC) scenario – Daily Hospital Admissions (including ICU admissions), between September 2026 and March 2027

Image
An area chart illustrating the combined RWC scenarios for daily hospital admissions across Wales during the 2026/27 winter season for influenza, RSV, COVID-19, ALRI not classified as due to flu, RSV or COVID-19, and other infections of interest.

Description of Figure 3: An area chart illustrating the combined RWC scenarios for daily hospital admissions across Wales during the 2026 to 2027 winter season for influenza, RSV, COVID-19, ALRI not classified as due to flu, RSV or COVID-19, and other infections of interest.

Source: SRE calculations using PEDW data provided by DHCW

Figure 4: Combined Most Likely Scenario (MLS) – Daily Occupancy (including ICU admissions), between September 2026 and March 2027

Image
An area chart illustrating the combined MLS for all daily hospital occupancy across Wales during the 2026/27 winter season for influenza, RSV, COVID-19, ALRI not classified as due to flu, RSV or COVID-19, and other infections of interest.

Source: SRE calculations using PEDW data provided by DHCW

Description of Figure 4: An area chart illustrating the combined MLS for all daily hospital occupancy across Wales during the 2026 to 2027 winter season for influenza, RSV, COVID-19, ALRI not classified as due to flu, RSV or COVID-19, and other infections of interest.

Figure 5: Combined Reasonable Worst Case (RWC) Scenario – Daily Occupancy (including ICU admissions), between September 2026 and March 2027

Image
An area chart illustrating the combined reasonable worst case (RWC) scenarios for daily hospital occupancy across Wales during the 2026/27 winter season for influenza, RSV, COVID-19, ALRI not classified as due to flu, RSV or COVID-19, and other infections of interest.

Description of Figure 5: An area chart illustrating the combined reasonable worst case (RWC) scenarios for daily hospital occupancy across Wales during the 2026 to 2027 winter season for influenza, RSV, COVID-19, ALRI not classified as due to flu, RSV or COVID-19, and other infections of interest.

Source: SRE calculations using PEDW data provided by DHCW

Influenza (flu)

To assess the impact of flu on secondary care in Wales, daily hospital admissions and bed occupancy related to flu were identified using International Classification of Diseases, Version 10 (ICD-10) codes: J09 to J11.

Admissions and bed occupancy data were smoothed using 7-day rolling averages to identify seasonal peaks and trends.

To model flu admissions and bed occupancy for winter 2026 to 2027, different approaches were used based on:

  • historical data
  • vaccine coverage
  • epidemiological modelling techniques

These approaches were used to provide a range of possible scenarios.

For further information on the modelling scenarios used, see the Annex.

For further detail on the methodology, see the supplementary technical report.

Flu admissions

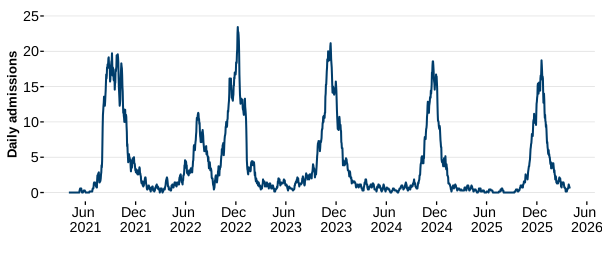
During the 2025 to 2026 winter, a total of 3,513 flu admissions were recorded – compared to:

  • 2,435 in the 2023 to 2024 winter
  • 4,484 in 2024 to 2025 winter

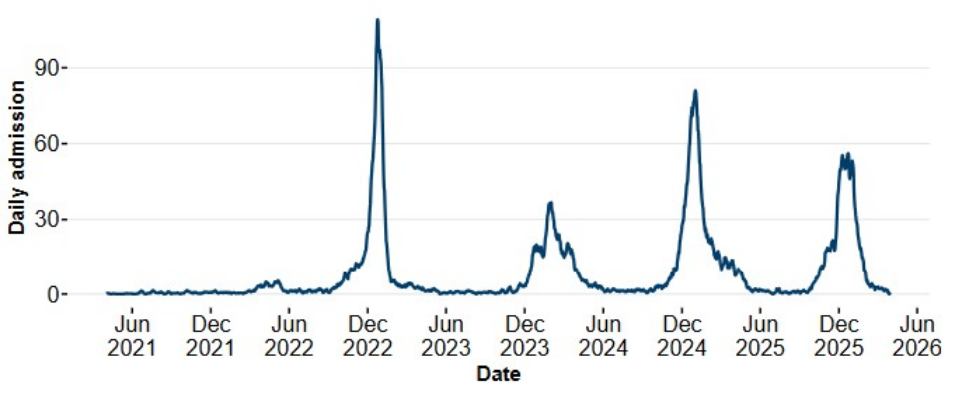
The daily admissions among all ages showed a peak of 56 in the 2025 to 2026 on the 22 and 23 December 2025, which was smaller than the size of the 2024/25 winter peak. (See Figure 6)

Scenarios A, B and C estimate peaks of:

  • 78 admissions
  • 70 admissions
  • 60 admissions

respectively in the last week of December 2026.

Scenario D estimates a peak of 26 admissions during the third week of January 2027. (See Figure 7)

Figure 6: 7 day rolling average of daily flu admissions, between April 2021 and March 2026

Image
A line chart showing the 7-day rolling average of recorded daily flu admissions.

Description of Figure 6: A line chart showing the 7 day rolling average of recorded daily flu admissions.

Source: Digital Health and Care Wales (DHCW)

Figure 7: daily flu admissions scenarios, winter 2026 to 2027

Image
A line chart illustrating various projected scenarios (Scenario A to Scenario D) for admissions due to flu during the 2026 to 2027 winter season.

Description of Figure 7: A line chart illustrating various projected scenarios (Scenario A to Scenario D) for admissions due to flu during the 2026 to 2027 winter season.

Source: SRE modelling using PEDW data provided by DHCW

Flu occupancy

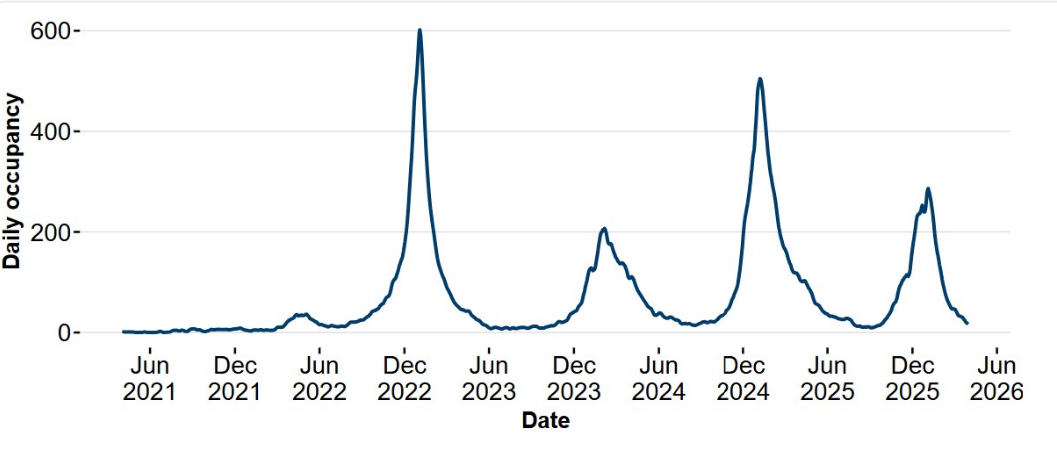
The highest peak in flu occupancy over the past five years occurred in the 2022 to 2023 winter where a maximum value of 602 beds per day was observed.

During the 2025 to 2026 winter, the occupancy due to flu peaked at 286 beds on 4 January 2026, smaller than the peak height of the winter before (2024 to 2025 winter). (See Figure 8)

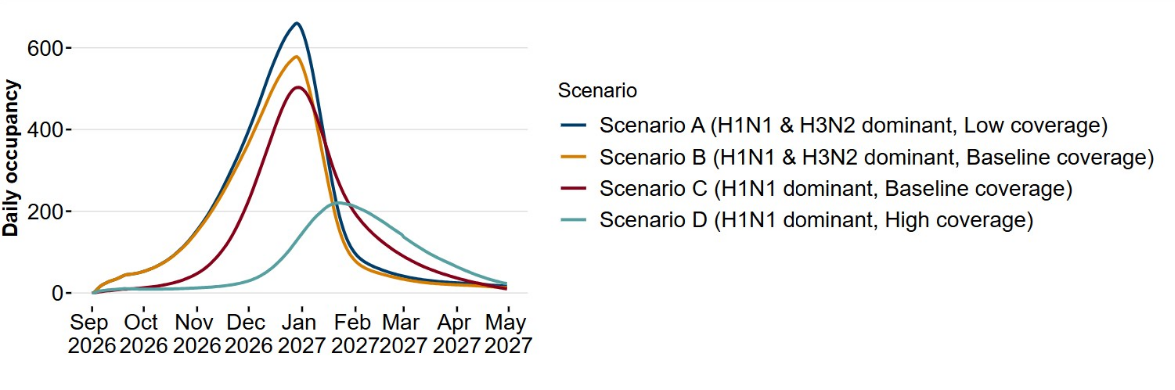
Scenario A estimates a peak occupancy of 660 beds on 29 December 2026.

Scenarios B and C estimate a peak occupancy of:

  • 578 beds
  • 503 beds

on 29 to 30 December 2026 respectively.

Scenario D estimates a peak occupancy of 220 beds on 22 January 2027. (See Figure 9)

Figure 8: 7 day rolling average of daily flu occupancy, between April 2021 and March 2026

Image
A line chart showing the 7-day moving average of hospital occupancy due to flu in Wales.

Description of Figure 8: a line chart showing the 7 day moving average of hospital occupancy due to flu in Wales.

Source: Digital Health and Care Wales (DHCW).

Figure 9: Daily flu occupancy scenarios, winter 2026 to 2027

Image
A line chart representing various projected scenarios (Scenario A to Scenario D) for flu-related hospital occupancy.

Description of Figure 9: A line chart representing various projected scenarios (Scenario A to Scenario D) for flu-related hospital occupancy.

Source: SRE calculations using PEDW data provided by DHCW

Respiratory syncytial virus (RSV)

RSV is a common respiratory virus that usually causes mild, cold-like symptoms. However, it can lead to more severe illness in infants and older adults with weakened immune systems, which may result in hospital admissions.

The RSV vaccination programme for pregnant women (providing some protection for young infants) and older people began in September 2024. The programme was expanded on 1 April 2026 to include adults aged 80 years and over and all residents in care homes.

To model RSV admissions and bed occupancy for winter 2026 to 2027, different approaches were used based on:

  • historical data
  • vaccine coverage
  • epidemiological modelling techniques

The model used was an age-stratified deterministic SEIRS compartmental transmission model, which allowed the impact of different vaccine assumptions to be assessed across age groups.

This section includes outputs from the RSV compartment model for people in Wales aged:

  • 0 to 4 years
  • 75 years and over

Further RSV modelling outputs can be found in the RSV model supplementary report.

The report also provides estimates of the percentage of admissions averted in different age groups in Wales following the introduction of the vaccination programme.

The analysis shows that the estimated percentage of admissions averted during the 2024 to 2025 and 2025 to 2026 winters was higher in age groups eligible for vaccination, or expected to gain immunity from maternal vaccination, than in age groups that were not eligible.

Similarly, the winter 2026 to 2027 modelling estimates that vaccine-eligible age groups, including infants, will have a higher percentage of admissions averted than people aged between 1 year and 75 years.

The model estimates that, after the second year of programme implementation:

  • 18.45% of admissions were averted among infants aged 1 to 6 months
  • 7.92% of admissions were averted among infants aged 7 to 12 months

The model was also used to generate projections for winter 2026 to 2027 incorporating the effects of vaccinating adults aged 80 years and over.

Using a range of vaccine uptake scenarios in this age group, the model estimates that vaccination could avert between 24.6% and 46.4% of RSV hospital admissions among adults aged 80 years and over during winter 2026 to 2027.

This is substantially higher than the estimated proportion of admissions averted in age groups aged over 1 year and under 75 years.

As with all modelling studies, the results are contingent on several assumptions, including:

  • contact patterns
  • vaccine efficacy
  • completeness of ICD-10 coding

These assumptions introduce uncertainty and should be considered when interpreting the findings.

The effects of vaccinating care home residents have not been considered.

Therefore, the model outputs should be viewed as indicative rather than definitive, and as an estimate of what might happen rather than a prediction of what will happen.

For further information on the modelling scenarios used, see the Annex.

For further detail on the methodology used, see the RSV supplementary technical report.

RSV paediatric admissions (ages 0 to 4 years)

During the 2025 to 2026 winter season, there were a total of 1,004 RSV paediatric admissions (in children aged 0 to 4 years inclusive).

This was:

  • 2% lower than the previous season
  • 33% lower than the 3-year pre-vaccination seasonal average

Daily admissions peaked at 19 in the third week of December 2025, around a month later than the previous season.

The largest reduction in total admissions was observed among infants aged 1 to 6 months.

During the 2025 to 2026 winter season, this age group accounted for 359 admissions, representing:

  • a 23% decrease compared with the 2024 to 2025 season
  • a 49% decrease compared with the 2023 to 2024 winter season

Children aged 7 to 12 months experienced 238 admissions, representing a 10% increase compared with the previous season.

The greater reductions among the youngest age groups may reflect the temporary protective effects of maternal vaccination, which is likely to last around 6 months after birth. (See Figure 10)

The RSV scenarios are generated using an epidemiological model. See the Annex for further information.

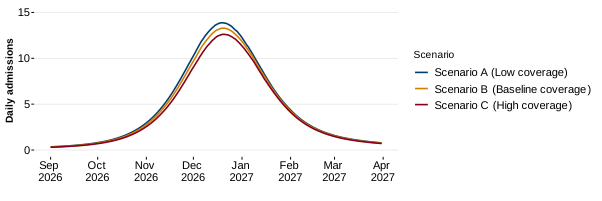
Scenario A, with low vaccine coverage, estimates a peak of 14 admissions among children aged 0 to 4 years on 20 December 2026.

Scenario B, with baseline vaccine coverage, estimates a peak of 13 admissions on 20 December 2026.

Scenario C, with high vaccine coverage, estimates a peak of 13 admissions on 20 December 2026. (See Figure 11)

The effect of vaccination is more apparent in younger age groups aged under 1 year.

The model estimates reductions of:

  • between 9% and 31% among infants aged 1 to 6 months
  • between 3% and 12% among infants aged 7 to 12 months

based on a maternal vaccine uptake range between 0% and 90%.

See the Effect of respiratory syncytial virus (RSV) vaccines on hospital admissions in Wales paper for further information.

Figure 10: 7-day rolling average of daily paediatric RSV admissions (ages 0 to 4 years), between April 2021 and March 2026

Image
a line chart showing recorded daily Respiratory Syncytial Virus (RSV) admissions among children aged 0 to 4 years.

Description of Figure 10: a line chart showing recorded daily Respiratory Syncytial Virus (RSV) admissions among children aged 0 to 4 years.

Source: Digital Health and Care Wales (DHCW).

Figure 11: Daily paediatric RSV admissions (ages 0 to 4 years) scenarios, between September 2026 and March 2027

Image
A line chart representing projected scenarios for RSV admissions among children aged 0 to 4 years, factoring in vaccination uptake varied between 20% above and below the observed coverage.

Description of Figure 11: A line chart representing projected scenarios for RSV admissions among children aged 0 to 4 years, factoring in vaccination uptake varied between 20% above and below the observed coverage.

Source: SRE calculations using PEDW data provided by DHCW

RSV paediatric bed occupancy (ages 0 to 4 years)

Bed occupancy due to RSV in children aged 0 to 4 years peaked at 31 beds per day on 18 and 20 December 2025, higher than the previous year’s peak of 29 beds per day on 30 November 2024. (See Figure 12)

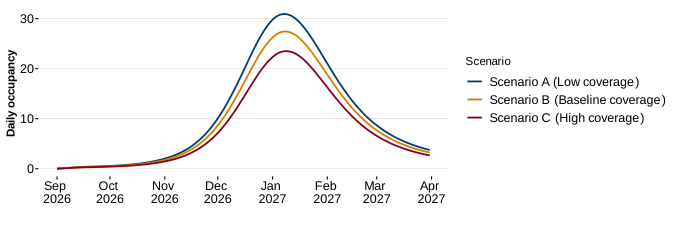
Scenario A with low vaccine coverage estimates a peak occupancy of 33 beds on 20 December 2026.

Scenario B with baseline vaccine coverage estimates a peak occupancy of 32 beds on 21 December 2026.

Scenario C with high vaccine coverage estimates a peak occupancy of 30 beds on 21 December 2026. (See Figure 13)

Figure 12: 7 day rolling average of daily paediatric RSV occupancy (ages 0 to 4 years), between April 2021 and March 2026

Image
a line chart of RSV-related bed occupancy among children aged 0 to 4 years.

Description of Figure 12: a line chart of RSV-related bed occupancy among children aged 0 to 4 years.

Source: Digital Health and Care Wales (DHCW).

Figure 13: Daily paediatric RSV occupancy (ages 0 to 4 years) scenarios, between September 2026 and March 2027

Image
A line chart representing projected scenarios for RSV occupancy among children aged 0 to 4 years.

Description of Figure 13: A line chart representing projected scenarios for RSV occupancy among children aged 0 to 4 years.

Source: SRE calculations using PEDW data provided by DHCW

RSV admissions in older adults (ages 75 years and above)

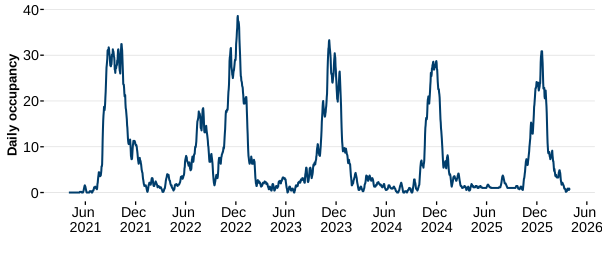
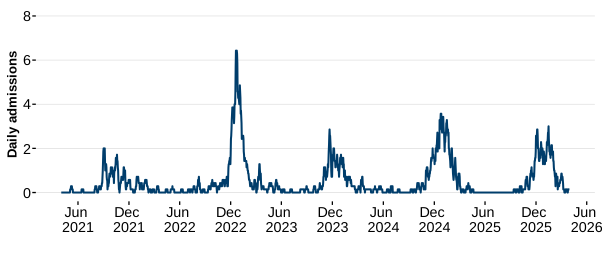
During the 2025 to 2026 winter season, there were a total of 180 RSV admissions among adults aged 75 years and above with the daily admissions peaking at 3 admissions on 15 January 2026.

The total admissions numbers in ages 75 years or older decreased by 21% compared to the 2024/25 season.

Care should be taken with interpretation of RSV admissions modelling in 75 to 79 year olds due to low numbers. (Figure 14)

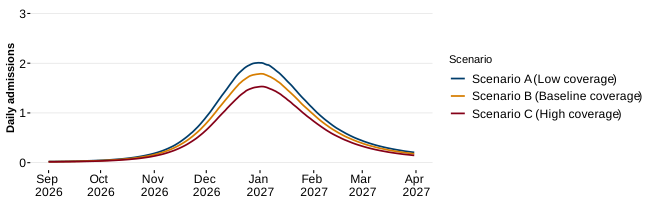
Scenario A with low vaccine coverage estimates a peak of 2 daily admissions for (75+ year olds) on 31 December 2026.

Scenario B with baseline vaccine coverage estimates a peak of 1.8 admissions on 2 January 2027.

Scenario C with high vaccine coverage estimates a peak of 1.5 admissions 2 January 2027. (Figure 15)

Figure 14: 7 day rolling average of daily RSV admissions in older adults (ages 75 years and above), between April 2021 and March 2026

Image
A line chart of RSV-related bed admissions among older adults aged 75 years and above in Wales.

Description of Figure 14: a line chart of RSV-related bed admissions among older adults aged 75 years and above in Wales.

Source: Digital Health and Care Wales (DHCW).

Figure 15: Daily RSV admissions scenarios in older adults (ages 75 years and above), between September 2026 and March 2027

Image
A line chart representing three projected scenarios for RSV admissions among older adults aged 75 years and above.

Description of Figure 15: A line chart representing three projected scenarios for RSV admissions among older adults aged 75 years and above.

Source: SRE calculations using PEDW data provided by DHCW

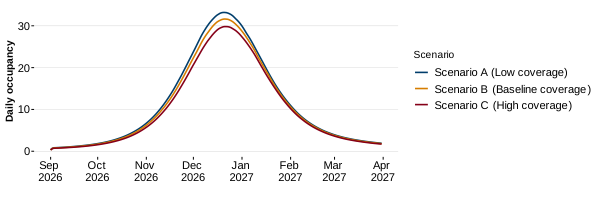
with baseline vaccine coverage estimates a peak occupancy of 27 beds on 8 January 2027. Scenario C with high vaccine coverage estimates a peak occupancy of 23 beds on 9 January 2027. (See Figure 17)

RSV bed occupancy in older adults (ages 75 years and above)

Bed occupancy due to RSV in older adults aged 75 years and above peaked at 35 beds per day on 26 and 27 January 2026, lower than the previous year’s peak of 56 beds per day between 23 January to 25 January 2025. (See Figure 16)

Scenario A with low vaccine coverage estimates a peak occupancy of 31 beds for those aged 75 years and above on 8 January 2027.

Scenario B with baseline vaccine coverage estimates a peak occupancy of 27 beds on 8 January 2027.

Scenario C with high vaccine coverage estimates a peak occupancy of 23 beds on 9 January 2027. (See Figure 17)

Image
a line chart of RSV-related bed occupancy among older adults aged 75 years and above.

Description of Figure 16: a line chart of RSV-related bed occupancy among older adults aged 75 years and above.

Source: Digital Health and Care Wales (DHCW).

Figure 17: Daily RSV occupancy scenarios in older adults (ages 75 years and above), between September 2026 and March 2027

Image
A line chart representing projected scenarios for RSV occupancy among older adults aged 75 years and above.

Description of Figure 17: A line chart representing projected scenarios for RSV occupancy among older adults aged 75 years and above.

Source: SRE calculations using PEDW data provided by DHCW

COVID-19

COVID-19 Admissions

In May 2023, the World Health Organization (WHO) announced that COVID-19 is no longer classified as a global health emergency.

However, the WHO also emphasised that the risk of virus evolution remains, with new variants emerging.

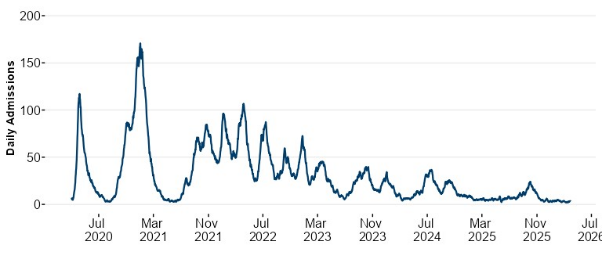
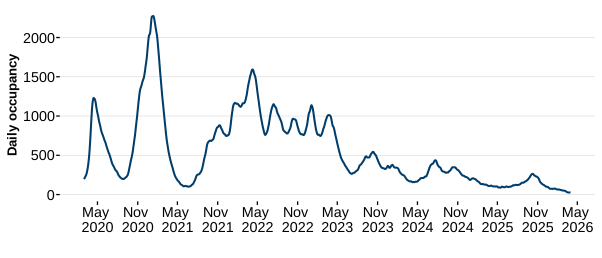
In recent years, Covid-19 admission cases have declined to low levels.

COVID-19 admissions during winter have been at their lowest levels since the pandemic.

In Wales, admissions due to COVID-19 showed a decreasing trend, totalling:

  • 1,551 in the winter of 2025 to 2026
  • 2,314 in winter 2024 to 2025

Daily admissions peaked at 24 in the first week of October 2025, after which the admissions continued to decline. (See Figure 18)

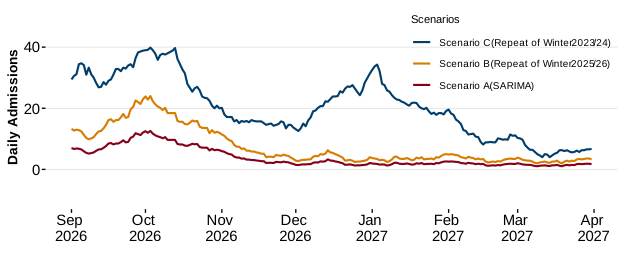
All three scenarios peak on 3 October, with:

  • Scenario C (Repeat of 2023 to 2024) projecting 40 admissions
  • Scenario B (Repeat of Winter 2025 to 2026) projecting 24 admissions
  • Scenario A (SARIMA) projecting 13 admissions

(See Figure 19)

Figure 18: 7-day rolling average of daily COVID-19 admissions, between March 2020 and March 2026

Image
A line chart of COVID-19 related admissions showing a declining wave pattern; a very large initial peak in spring 2020, a large peak in early 2021, followed by progressively smaller and more frequent peaks each subsequent winter, falling consistently to the 2025 to 2026 winter.

Description of Figure 18: A line chart of COVID-19 related admissions showing a declining wave pattern; a very large initial peak in spring 2020, a large peak in early 2021, followed by progressively smaller and more frequent peaks each subsequent winter, falling consistently to the 2025 to 2026 winter.

Source: Digital Health and Care Wales (DHCW).

Figure 19: daily COVID-19 admissions scenarios – winter 2026 to 2027

Image
A line chart representing three projected daily COVID-19 admissions scenarios for Winter 2026 to 2027

Description of Figure 19: A line chart representing three projected daily COVID-19 admissions scenarios for Winter 2026 to 2027.

Source: SRE calculations using PEDW data provided by DHCW

COVID-19 Occupancy

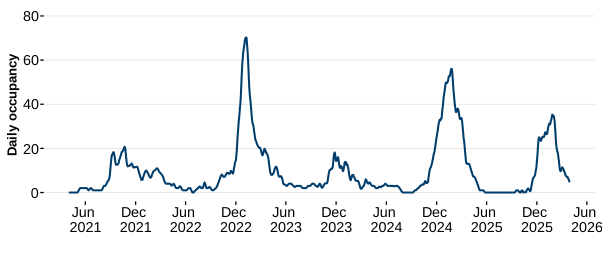
COVID-19 occupancy during the 2025 to 2026 winter was at the lowest levels since the pandemic began.

In Wales, occupancy due to COVID-19 showed a similar decreasing trend to admissions, totalling:

  • 264 occupied bed-days in the winter of 2025 to 2026
  • 348 in the winter 2024 to 2025

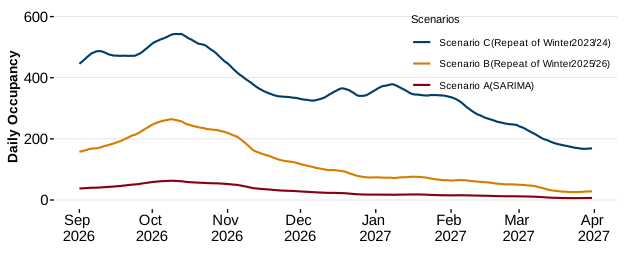
Additionally, the daily occupancy peaked at 264 (occupied beds) on 09 October 2025, after which occupancy continued to show a decreasing trend. (See Figure 20).

The COVID-19 modelling covers a wide range of bed occupancy scenarios.

  • Scenario C (Repeat of Winter 2023 to 2024) estimates a maximum occupancy of 543 beds required on 13 October.
  • Scenario B (Repeat of Winter 2025 to 2026) projects a peak occupancy of 264 beds on 9th October.
  • Scenario A (SARIMA) projects a peak occupancy of 63 beds on 9th October.

(See Figure 21)

Figure 20: 7-day rolling average of daily COVID-19 occupancy, between March 2020 and March 2026

Image
a line chart showing the 7-day rolling average of daily COVID-19 occupancy.

Description of figure 20: a line chart showing the 7-day rolling average of daily COVID-19 occupancy.

Source: Digital Health and Care Wales (DHCW).

Figure 21: daily COVID-19 occupancy scenarios – winter 2026 to 2027

Image
A line chart representing three projected daily COVID-19 bed occupancy scenarios for Winter 2026 to 2027

Description of figure 21: A line chart representing three projected daily COVID-19 bed occupancy scenarios for Winter 2026 to 2027

Source: SRE calculations using PEDW data provided by DHCW

Part 4: primary care (ARI GP Consultations and 111 calls)

GP ARI consultation rate

Acute respiratory infection (ARI) refers to a sudden onset of one or more respiratory symptoms, where clinical judgement determines the illness is caused by a viral infection such as COVID-19, flu, or RSV.

GP consultations data related to acute respiratory infections are provided by Public Health Wales.

The GP consultation rate data relies on syndromic evaluation of patients, without conducting specific pathological tests for confirmation.

Therefore, it is likely that GP consultations might over or underestimate the incidence of infectious diseases.

GP consultations (as with 111 calls, which are covered later in Part 4) provide an early signal of respiratory pressure in the community, typically rising ahead of hospital admissions and offering a lead indicator for out of hours, minor injuries and emergency department demand.

The peak daily ARI consultation rates are estimated to occur on or around the bank holidays at Christmas and New Year.

Potential closures in GP surgeries may put additional pressure on out of hours services, minor injuries services and emergency departments, and the modelled peaks should be interpreted alongside the 111 calls scenarios when planning surge cover for that fortnight.

ARI GP consultation rates in children (ages 0 to 14 years)

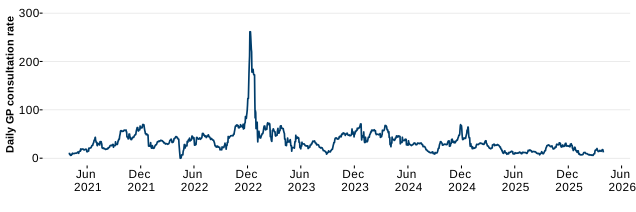
Consultation rates in children show a pronounced winter seasonality, rising from October, peaking in December and declining through February and March in all years for the past 5 years.

The amplitude of the winter peak has fallen in each successive year since winter 2022 to 2023. (Figure 22)

Children’s rates peaked at:

  • 70.9 GP consultations per 100,000 population during winter 2023 to 2024
  • 69.4 GP consultations per 100,000 population during winter 2024 to 2025
  • 31.8 GP consultations per 100,000 population during winter 2025 to 2026

In the 2025 to 2026 winter, children had fewer GP consultations due to ARI than in the 2024 to 2025 winter, with a daily average rate of 17.9 consultations per 100,000 population compared to 31.7 the previous winter. (See Figure 22)

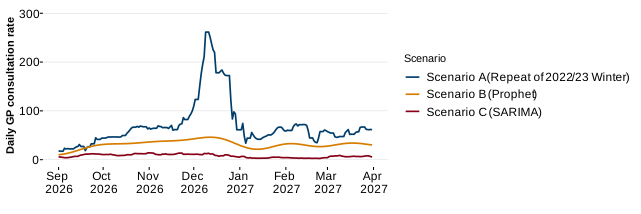
The projected peak GP consultation rates for children under the modelled Scenarios A, B and C are:

  • 261.5 consultations per 100,000 GP population, occurring on 11 December 2026
  • 45.6 consultations per 100,000 GP population, occurring on 12 December 2026
  • 14.0 consultations per 100,000 GP population, occurring on 31 October 2026 to 1 November 2026

(See Figure 23)

Figure 22: 7 day rolling average of daily ARI GP consultation rate in children (ages 0 to 14 years), between April 2021 and March 2026

Image
a line chart showing the 7-day rolling average of daily GP consultation rates in children.

Description of figure 22: a line chart showing the 7-day rolling average of daily GP consultation rates in children.

Source: Public Health Wales

Figure 23: Daily ARI GP consultation rate scenarios in children (ages 0 to 14 years) – between September 2026 and March 2027

Image
A line chart representing projected daily GP consultation rates (children), for Winter 2026 to 2027.

Description of Figure 23: A line chart representing projected daily GP consultation rates (children), for Winter 2026 to 2027.

Source: SRE calculations using data provided by PHW

Figure 24: 7 day rolling average of daily ARI GP consultation rate in ages 15 years and above, between April 2021 and March 2026

Image
A line chart showing the 7-day rolling average of daily GP consultation rates in Adults.

Description of Figure 24: a line chart showing the 7-day rolling average of daily GP consultation rates in Adults.

Source: Public Health Wales

Figure 25: Daily ARI GP consultation rate scenarios in ages 15 years and above – between September 2026 and March 2027

Image
A line chart representing different projected daily GP consultation rates (Adults), for Winter 2026 to 2027

Description of Figure 25: A line chart representing different projected daily GP consultation rates (Adults), for Winter 2026/27.

Source: SRE calculations using data provided by PHW

a { text-decoration: none; color: #464feb; } tr th, tr td { border: 1px solid #e6e6e6; } tr th { background-color: #f5f5f5; }

GP ARI consultation rate

Acute respiratory infection (ARI) refers to a sudden onset of one or more respiratory symptoms, where clinical judgement determines the illness is caused by a viral infection such as COVID-19, flu, or RSV.

GP consultations data related to acute respiratory infections are provided by Public Health Wales.

The GP consultation rate data relies on syndromic evaluation of patients, without conducting specific pathological tests for confirmation.

Therefore, it is likely that GP consultations might over or underestimate the incidence of infectious diseases.

GP consultations (as with 111 calls, which are covered later in Part 4) provide an early signal of respiratory pressure in the community, typically rising ahead of hospital admissions and offering a lead indicator for out of hours, minor injuries and emergency department demand.

The peak daily ARI consultation rates are estimated to occur on or around the bank holidays at Christmas and New Year.

Potential closures in GP surgeries may put additional pressure on out of hours services, minor injuries services and emergency departments, and the modelled peaks should be interpreted alongside the 111 calls scenarios when planning surge cover for that fortnight.

Implications across both age groups

Because these are rates (per 100,000 GP population) rather than counts, the higher rates observed in children does not mean that children account for more consultations overall.

Adults make up the larger share of actual appointments, simply because there are far more of them in the population.

Children record materially higher consultation rates (per 100,000 GP population) than adults in every winter of the observed series and under every modelled scenario.

Both groups show year-on-year decline since 2023 to 2024, and both are modelled to peak within the same fortnight.

Because adults form the large majority of the registered population, however, the absolute volume of ARI GP consultations remains higher in adults despite the lower ARI GP consultation rate.

111 calls

NHS Wales 111 call data provides an important early indicator of respiratory illness burden in the community, often preceding increases in emergency department attendances and hospital admissions by several days.

Calls to 111 due to breathing problems (includes the following causes: Breathing Difficulty, Breathing Difficulty or Wheezing and Breathing Problems excluding chest pains) are monitored throughout the winter period as part of the wider respiratory surveillance framework in Wales.

This section presents historical trends in daily 111 calls that are answered at a Wales level and modelled scenarios for the 2026 to 2027 winter period.

It is important to note that 111 call data reflect community-level demand and is not directly comparable to hospital-based metrics; a single caller may contact 111 multiple times, and not all calls result in onward referral to emergency or secondary care.

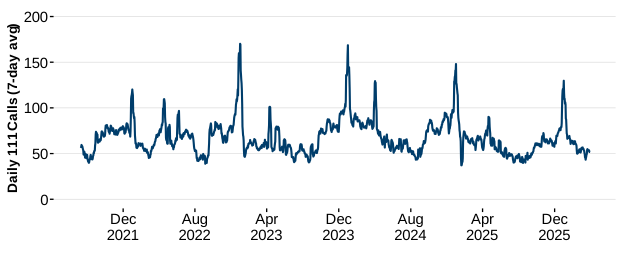
The highest recorded daily volumes reached 170 calls answered in winter 2022 to 2023 during peak winter periods.

Outside of winter, call volumes generally stabilise at a baseline of around 50 to 75 calls per day (based on data from July 2021 to March 2026), reflecting the lower burden of respiratory illness during summer months.

The most recent 2025/26 winter showed a moderate peak (130 calls per day on 1 January 2026) broadly consistent with previous non-pandemic winters, suggesting a continued return to more typical seasonal patterns following the elevated activity of earlier post-pandemic years.

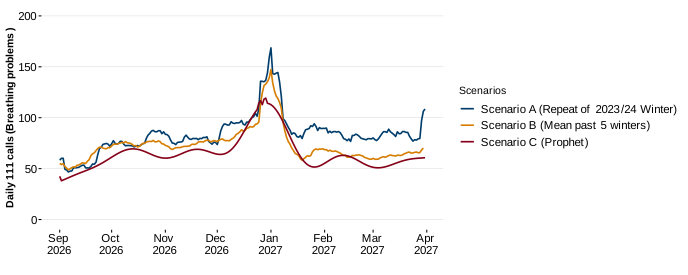
Figure 26 presents three modelled scenarios for daily 111 calls due to respiratory problems across Wales for the 2026 to 2027 winter season.

  • Scenario A, based on a repeat of the 2023 to 2024 winter, represents the higher-burden projection and estimates a peak of 169 calls per day in early January 2027.
  • Scenario B, derived from the mean of the past five winters, projects a moderate trajectory with a peak of around 147 calls per day over a similar timeframe.
  • Scenario C, generated using the Prophet forecasting method, produces the most conservative projection with a peak of 116 calls per day.

All three scenarios anticipate the highest call volumes occurring around the first week of January 2027, consistent with the historical patterns observed in Figure 26.

The spread between scenarios reflects inherent uncertainty in season severity and the influence of factors such as circulating pathogen mix, public behaviour, and vaccination uptake all of which are difficult to predict in advance.

These projections should be interpreted alongside hospital admissions and emergency department (ED) attendance scenarios when informing winter service planning.

Figure 26: 7-day rolling average of daily 111 calls due to respiratory problems between April 2021 and March 2026

Image
A 7-day rolling average of daily 111 calls attributed to respiratory problems across Wales from April 2021 to March 2026. Call volumes display a clear and consistent seasonal pattern, with peaks occurring predominantly during the winter months of December and January each year.

Description of Figure 26: A 7-day rolling average of daily 111 calls attributed to respiratory problems across Wales from April 2021 to March 2026. Call volumes display a clear and consistent seasonal pattern, with peaks occurring predominantly during the winter months of December and January each year.

Source: Welsh Ambulance Service University NHS Trust (WAST)

Figure 27: 111 calls due to respiratory problems scenarios– between September 2026 and March 2027

Image
A line chart representing three modelled scenarios of daily 111 calls relating to breathing problems for Winter 2026 to 2027.

Description of Figure 27: A line chart representing three modelled scenarios of daily 111 calls relating to breathing problems for Winter 2026 to 2027.

Source: SRE calculations using data provided by WAST

Part 5: emergency department attendances and ambulance calls

Emergency department attendance

The ED attendances are defined as the daily number of unplanned visits to a hospital Emergency Department (ED), Minor Injury Unit (MIU), or equivalent urgent care setting for respiratory illness.

In the 2025 to 2026 winter, there were:

  • 49,320 ED attendances due to respiratory problems
  • 51,841 attendances in 2024 to 2025
  • 50,508 attendances in 2023 to 2024

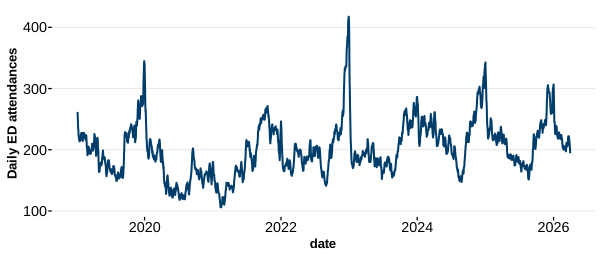
Attendances peaked at 307 in the first week of January 2025, broadly in line with the timing seen in previous seasons. (See Figure 28)

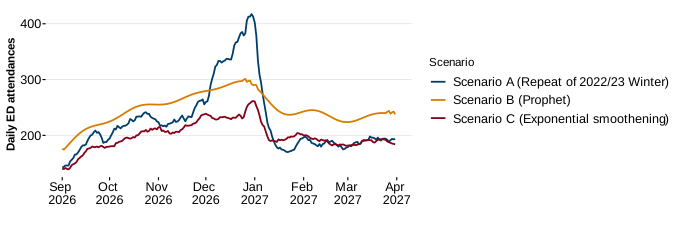
Modelled ED attendance scenarios for 2026 to 2027 winter period using three different scenarios shows that:

  • the expected highest peak will occur on 30 December 2026 with an expected peak of 417 attendances
  • one scenario projects a peak of 301 on 26 December 2026
  • one scenario projects a peak of 262 attendances on 31 December 2026

(See Figure 29)

Figure 28: 7-day rolling average of daily ED attendances due to respiratory problems, between January 2019 and March 2026

Image
A 7-day rolling average of daily ED attendances attributed to respiratory problems across Wales, between January 2019 and March 2026.

Description of Figure 28: A 7-day rolling average of daily ED attendances attributed to respiratory problems across Wales, between January 2019 and March 2026.

Source: Digital Health and Care Wales (DHCW)

Figure 29: Daily ED attendances due to respiratory problems scenarios – between September 2026 and March 2027

Image
A line chart with three scenarios representing projected daily emergency department attendances (due to respiratory problems), during Winter 2026 to 2027.

Description of Figure 29: A line chart with three scenarios representing projected daily emergency department attendances (due to respiratory problems), during Winter 2026 to 2027.

Source: SRE calculations using data provided by DHCW


Ambulance calls due to breathing problems

NHS Wales 999 (ambulance) call data provides a further indicator of respiratory illness burden in the community, capturing the more acute end of demand than the NHS 111 service.

Calls to 999 due to breathing problems are monitored throughout the winter period as part of the wider respiratory surveillance framework in Wales.

This section presents historical trends in daily 999 call volumes at Wales level and modelled scenarios for the 2026 to 2027 winter period.

As with 111 calls, it is important to note that 999 call data reflect community-level demand and are not directly comparable to hospital-based metrics; a single caller may contact the service more than once, and not all calls result in conveyance to hospital or onward referral to secondary care.

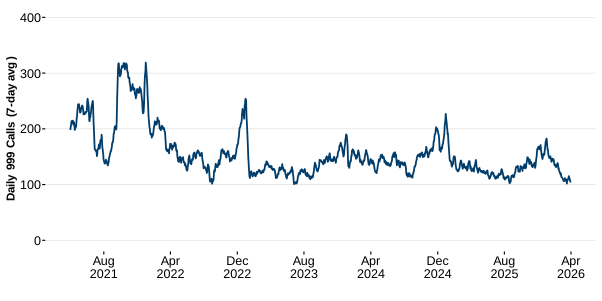
Figure 30 shows the 7-day rolling average of daily 999 calls attributed to respiratory problems across Wales from April 2021 to March 2026.

Call volumes display a seasonal pattern, with peaks occurring predominantly during the winter months of December and January each year.

The most pronounced peak in the series occurred in the winter of 2021 to 2022, reaching approximately 319 daily 999 calls, since when successive winter peaks have been progressively lower, consistent with the downward trend seen across the other respiratory indicators.

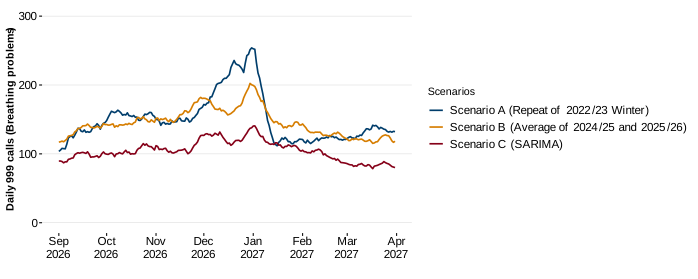
Figure 31 shows the three scenarios for the period September 2026 to March 2027.

  • Under Scenario A, daily 999 calls are projected to peak at approximately 254 calls per day in late December 2026, the highest of the three scenarios.
  • Scenario B projects a peak of approximately 202 calls per day.
  • Scenario C projects a peak of approximately 141 calls per day.

Scenarios B and C both continue the recent downward trend.

As with the 111 call series, all three scenarios concentrate their peak demand around the turn of the year, coinciding with the Christmas and New Year period.

Figure 30: 7-day rolling average of daily 999 calls (Ambulance calls) due to respiratory problems between April 2021 and March 2026

Image
a line chart showing the 7-day rolling average of daily 999 calls.

Description of figure 30: a line chart showing the 7-day rolling average of daily 999 calls.

Source: Welsh Ambulance Service University NHS Trust (WAST)

Figure 31: Number of 999 calls (Ambulance calls) due to respiratory problems scenarios– between September 2026 and March 2027

Image
A line chart representing different projected daily 999 calls relating to breathing problems scenarios for Winter 2026 to 2027.

Description of figure 31: A line chart representing different projected daily 999 calls relating to breathing problems scenarios for Winter 2026 to 2027.

Source: SRE calculations using data provided by WAST

Part 6: conclusion

The upcoming 2026 to 2027 winter season is expected to see a rise in respiratory viruses compared with the summer months, as is typical each year.

This leads to higher demand on primary care (GP consultations) and secondary care services (admissions, ED attendances).

The scenarios in this report give an insight into how these viruses may impact the demand for healthcare in Wales and help in planning for a surge in capacity that might be needed to accommodate these excess winter pressures.

Population-level behaviours such as uptake of vaccinations can amplify or mitigate winter pressures and represent an important source of uncertainty within winter planning assumptions.

Consideration of behavioural drivers, barriers and likely responses to public health interventions should therefore complement epidemiological and service capacity modelling when assessing potential winter impacts and identifying opportunities to reduce avoidable demand.

The modelling in this report estimates the greatest impact from respiratory illnesses on health care services in late December/early January this winter.

Over the winter months (1 September 2026 to 31 March 2027), there will be continued surveillance of respiratory admissions due acute respiratory viruses.

The winter modelling scenarios presented in this report will be utilised alongside short-term projections, which will be updated as additional data are collected throughout the winter and presented in regular surveillance reports.

Collectively, these models will serve as useful tools to support decision-making in healthcare planning across Wales.

Part 7: annex

Retrospective analysis of scenarios

The admissions projections published in the Science Research Evidence: winter modelling 2025 to 2026 were compared with the recent admissions data received for the 2025 to 2026 winter period from DHCW to assess the performance of the models.

Overall, the analysis suggests the scenarios tracked closely with:

  • the ‘High Season, VU = 60%’ scenarios for RSV
  • the ‘Moderate’ scenarios for COVID-19 and flu

The modelled peaks for these scenarios were extremely close to the observed admissions (‘Actuals’).

However, the observed flu season did begin earlier than expected.

Figure A1: Comparison of daily influenza admissions scenarios vs actuals in Wales between September 2025 and March 2026

Image
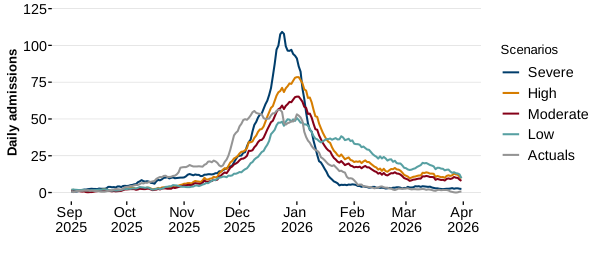
The Influenza admissions Severe scenario estimated a peak of 109 admissions in the last week of December while the High, Moderate and Low scenarios estimated a peak of 78, 65 and 51 admissions respectively during the first week of January 2026. The actual admissions showed an early rise compared to previous seasons and a peak of 56 admissions in the third week of December (22-23 December 2025).

Source: Digital Health and Care Wales and SRE calculations

The Influenza admissions Severe scenario estimated a peak of 109 admissions in the last week of December while the High, Moderate and Low scenarios estimated a peak of 78, 65 and 51 admissions respectively during the first week of January 2026. The actual admissions showed an early rise compared to previous seasons and a peak of 56 admissions in the third week of December (22 to 23 December 2025).

Figure A2: Comparison of paediatric (ages 0 to 4 years) daily RSV admissions scenarios vs actuals between September 2025 and March 2026

Image
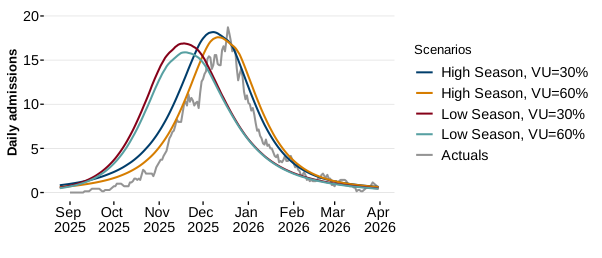
RSV admissions scenarios for ages 0-4 years indicated a projected peak of 16-18 admissions between 18 November and 11 December 2025. The actuals peak showed 19 admissions on 18 December 2025.

RSV admissions scenarios for ages 0 to 4 years old indicated a projected peak of 16 to 18 admissions between 18 November and 11 December 2025. The actuals peak showed 19 admissions on 18 December 2025.

Figure A3: Comparison of daily RSV admissions in older adults (ages 75 to 79 years) scenarios vs actuals between September 2025 and March 2026

Image
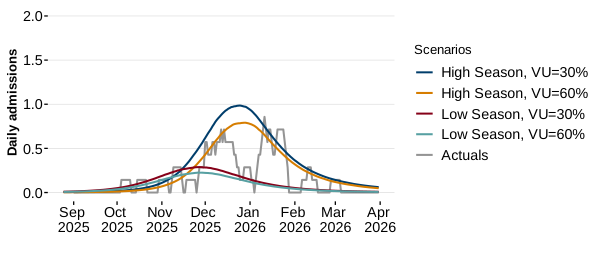
RSV admissions scenarios for ages 75-79 years indicated a projected peak of 1 admission late December 2025. The actuals peaked at 3 daily admissions on 15 January 2026.

RSV admissions scenarios for ages 75 to 79 years indicated a projected peak of 1 admission late December 2025. The actuals peaked at 3 daily admissions on 15 January 2026.

Figure A4: Comparison of COVID-19 daily admissions scenarios vs actuals between September 2025 and March 2026

Image
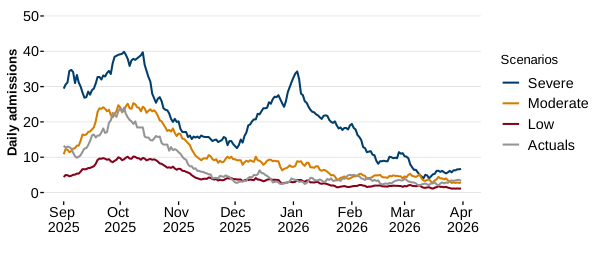
The Severe COVID-19 admissions scenario projected a peak of 40 admissions on 3 October, while the Moderate and Low scenarios projected peaks of 25 and 10 admissions, respectively, on 8 October 2025. Actual admissions showed a peak at of 24 admissions on 3 October 2025, before declining steadily throughout the winter.

The Severe COVID-19 admissions scenario projected a peak of 40 admissions on 3 October, while the Moderate and Low scenarios projected peaks of 25 and 10 admissions, respectively, on 8 October 2025. Actual admissions showed a peak at of 24 admissions on 3 October 2025, before declining steadily throughout the winter.

Figure A5: Comparison of combined daily admissions scenarios vs actuals between September 2025 and March 2026

Image
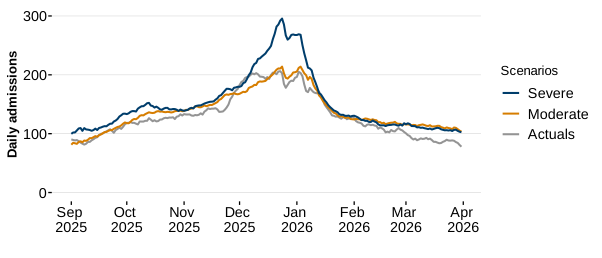
The combined scenarios assess the collective impact of influenza, RSV, COVID-19 and other viral infections. The Severe scenario projected a peak of 296 admissions on 24 December 2025, while the Moderate scenario projected a peak of 214 admissions on the same date. The actuals tracked closely with the Moderate scenario peaking at 209 admissions on 24 December 2025.

The combined scenarios assess the collective impact of influenza, RSV, COVID-19 and other viral infections. The Severe scenario projected a peak of 296 admissions on 24 December 2025, while the Moderate scenario projected a peak of 214 admissions on the same date. The actuals tracked closely with the Moderate scenario peaking at 209 admissions on 24 December 2025.

Data Sources

Table A1

Data sourceDefinitionData Provider
PEDW dataset (hospital admissions)

The primary source for hospital admissions and bed occupancy data, derived from the Patient Episode Database for Wales (PEDW). ICD-10-coded; includes day cases. Subject to coding lag of several months, meaning 2025 to 2026 figures may be underestimated at the time of publication.

In this report, the analysis uses: hospital admissions for flu, RSV, COVID-19 or other infections (See Tables A10-A13 for ICD-10 codes used in any diagnosis position) between 1 April 2018 and 31 March 2026.

DHCW (Digital Health and Care Wales)
ICNET (hospital admissions)

Public Health Wales laboratory-confirmed multiplex PCR testing data. Inpatients only; excludes day cases. Used as the observed data (‘actuals’) comparator during the live winter period due to lower data lag than PEDW.

In this report, the analysis uses: hospital admissions for flu, RSV, COVID-19 or other infections with a confirmed lab test between 1 April 2018 and 31 March 2026.

Public Health Wales (PHW)
GP Sentinel Surveillance

A monitoring programme covering a subset of GP practices in Wales, reporting ARI consultation rates weekly. Results are standardised per 100,000 practice population. Not a census, individual practices report voluntarily, and rates should be interpreted as indicators rather than precise prevalence estimates.

In this report, the analysis uses: Daily GP consultation rates due to all acute respiratory infections between 1 April 2018 and 31 March 2026 for those aged 0 to 14 years and those aged 15 years and above.

Public Health Wales
111 callsDaily number of 111 calls, breathing difficulties, and cardiac or respiratory arrest that were answered between 1 July 2021 and 31 March 2026Welsh Ambulance Service University Trust (WAST)
Emergency Department (ED) attendancesIn this report, the analysis uses daily ED attendances due to respiratory problems.DHCW (Digital Health and Care Wales)
Ambulance (999) callsDaily number of verified incidents due to breathing problems between 1 April 2021 and 31 March 2026.Welsh Ambulance Service University Trust (WAST)
Flu virology (testing) dataDaily number of samples (in a sentinel and hospital setting) between 1 April 2018 and 31 March 2026 for Flu A (H3N2), Flu A (H1N1), Flu B, Influenza A (untyped)Public Health Wales

Descriptions of Modelling Scenarios used throughout the report

Combined ARI admissions and occupancy scenarios descriptions (Figures 2 to 5)

Table A2: details of scenarios used in the creation of combined MLS admissions and occupancy scenarios.

InfectionScenario and seasonDescription
InfluenzaScenario C (2024 to 2025 winter, baseline vaccine coverage)Model fit to 2024 to 2025 winter season (which was H1N1 dominant) with baseline vaccine uptake assumptions
RSVScenario B (Baseline coverage)Model fit to data between 1 April 2023 and 31 March 2026, with baseline vaccine uptake assumptions in pregnant women and older adults
COVID-19Scenario B (Repeat of Winter 2025 to 2026)Repeat data from the 2025 to 2026 winter season
Other infectionsThree-year averageAverage of 2023 to 2024, 2024 to 2025, and 2025 to 2026 winter season

Table A3: details of scenarios used in the creation of combined reasonable worst case (RWC) admissions and occupancy scenarios.

InfectionScenarioDescription
InfluenzaScenario A (2022 to 2023 winter, low vaccine coverage)Model fit to 2022 to 2023 winter season (when both H1N1 and H3N2 were dominant) with baseline vaccine uptake assumptions
RSVScenario A (Low coverage)Model fit to data between 1 April 2023 and 31 March 2026, with low vaccine uptake assumptions in pregnant women and older adults
COVID-19Scenario A (Repeat of Winter 2023/24)Repeat data from the 2023 to 2024 season
Other infectionsThree-year averageAverage of 2023 to 2024, 2024 to 2025, and 2025 to 2026 winter season

Flu admissions and occupancy scenarios descriptions (Figures 6 to 9)

A flu compartmental transmission model was constructed to generate projections of medium-term flu hospital admissions in Wales. 

The model was calibrated using historical admissions data from previous seasons and used to simulate various scenarios that incorporate different assumptions about vaccine uptake. 

An age‑stratified deterministic compartmental transmission model with a fixed population size and non-random age-specific mixing was used to simulate transmission and associated hospital admissions in Wales. 

The model structure was based on a modified SEIR framework and is designed to capture both infection dynamics and vaccination effects across heterogeneous age groups. Further information can be found in the flu compartment model technical report.

Table A4: Descriptions for in flu admission and occupancy scenarios

Scenario nameScenarioDescription
Scenario ARepeat of 2022 to 2023 data, low vaccine coverage2022 to 2023 winter season (when both H1N1 and H3N2 were dominant) with low vaccine uptake assumptions (20% lower than observed uptake)
Scenario BRepeat of 2022 to 2023 data, baseline vaccine coverage2022 to 2023 winter season (when both H1N1 and H3N2 were dominant) with baseline vaccine uptake assumptions (observed vaccine uptake)
Scenario CRepeat of 2024 to 2025 data, baseline vaccine coverage2024 to 2025 winter season (when H1N1 was dominant) with baseline vaccine uptake assumptions (observed vaccine uptake)
Scenario DRepeat of 2023 to 2024 data, high vaccine coverage2023 to 2024 winter season (when H1N1 was dominant) with high vaccine uptake assumptions (20% higher than observed vaccine uptake)


Scenario nameScenarioDescription
Scenario ASARIMAModel fit to SARIMA modelling
Scenario BRepeat of 2025 to 2026 dataModel fit to 2025 to 2026 winter season
Scenario CRepeat of 2023 to 2024 dataModel fit to 2023 to 2024 winter season

Descriptions of RSV scenarios

To generate admissions and occupancy scenarios, the previously published compartment transmission model was updated and calibrated to three seasons of admissions data (2023 to 2024, 2024 to 2025 and 2025 to 2026 winters, two of which included seasons after the vaccination campaign started). 

An update was published by the Welsh Government in February 2026 stating that the RSV vaccination programme was to be expanded.

The effects of vaccinating adults over the age of 80 were also included from April 2026 assuming they will show similar uptake rates as ages 75 to 79 during the first year of vaccination.

The vaccine uptake rates among target groups (pregnant women and older adults) were varied between 20% above and below the observed coverage and the scenarios were created.

RSV admissions and occupancy scenarios descriptions (Figures 10 to 17)

Table A5: Descriptions of RSV admission and occupancy scenarios

Scenario nameScenarioDescription
Scenario ALow vaccine coverageModel fit to data between 1 April 2023 and 31 March 2026. Vaccine uptake rate assumed to be 20% higher than baseline vaccine coverage
Scenario BBaseline vaccine coverageModel fit to data between 1 April 2023 and 31 March 2026. Baseline vaccine coverage assumes a repeat of from the uptake rates during 2025/26.
Scenario CHigh vaccine coverageModel fit to data between 1 April 2023 and 31 March 2026. Vaccine uptake rate assumed to be 20% higher than baseline vaccine coverage

Descriptions of COVID-19 Scenarios (Figures 18 to 21)

Statistical modelling techniques were used to project future COVID-19 admission and occupancy scenarios for the winter of 2026 to 2027.

Scenarios C and B correspond to repeats of data from the 2023 to 2024 and 2024 to 2025 winters. respectively, whilst Scenario A is based on SARIMA modelling.

Table A6: Description of COVID-19 admission and occupancy scenarios

Scenario nameScenarioDescription
Scenario ASARIMAModel fit to SARIMA modelling
Scenario BRepeat of 2025 to 2026 dataModel fit to 2025 to 2026 winter season
Scenario CRepeat of 2023 to 2024 dataModel fit to 2023 to 2024 winter season

GP consultation rate scenarios descriptions (Figures 22 to 25)

To make the data comparable between GP practices of different sizes, consultation numbers are standardised: that is, adjusted so that a large practice and a small one can be placed side by side fairly.

This is done by dividing the number of consultations by the practice population, the number of patients registered with those practices, and scaling the result to a common denominator.

The resulting measure is the consultation rate, expressed as consultations per 100,000 registered patients.

Rates are reported separately for 2 age categories:

  • children (ages 0 to 14)
  • adults (15 years and above)

Expressing the data in this way also allows the 2 age groups to be compared directly, despite there being far more adults than children in the population.

To create scenarios for GP consultation rates, the following statistical techniques were used.

The same 3 techniques are applied to both groups, allowing the children’s and adults scenarios to be read on a common basis.

Table A7: Descriptions of GP consultation rate scenarios

Scenario nameScenarioDescription
Scenario ARepeat of 2022 to 2023 dataModel fit to 2022 to 2023 winter season
Scenario BProphetModel fit to Prophet modelling using data from September 2023 to March 2026
Scenario CSARIMAModel fit to SARIMA modelling using data from September 2023 to March 2026

Scenario A applies the observed 2022/23 winter profile, the highest in the available series, to the 2026 to 2027 period and represents a reasonable worst case.

Scenarios B and C are statistical forecasts fitted to the full September 2023 to March 2026 series and reflect a continuation of the recent downward trend.

The three scenarios are not predictions of what will happen; they describe a plausible range within which the coming winter is likely to fall and are intended to support planning across that range.

Note that, the consultation rate between 15 April 2022 and 18 April 2022 is not available.

Stepped values have been imputed for those days, stepping from the 14 April 2022 average to the 19 April 2022 average.

111 call scenarios descriptions (Figures 26 and 27)

Table 8a: Descriptions of 111 calls due to respiratory problems

Scenario nameScenarioDescription
Scenario ARepeat of 2023 to 2024 dataModel fit to 2023 to 2024 winter season
Scenario BMean of past five wintersModel fit to past five winters (2021 to 2022 to 2025 to 2026)
Scenario CProphetModel fit to Prophet modelling

ED attendance scenarios descriptions (Figures 28 and 29)

Table A8: Descriptions of ED attendance scenarios 

Scenario nameScenario                Description
Scenario ARepeat of 2022 to 2023 dataModel fit to 2022 to 2o23 winter season
Scenario BProphetModel fit to Prophet modelling
Scenario CExponential smoothening Model fit to Exponential smoothening

Ambulance (999 calls) scenarios descriptions (Figures 30 and 31)

Descriptions of Ambulance (999 calls) Scenarios (Figures 30 and 31)

The three scenarios are not predictions of what will happen, rather they describe a plausible range within which the coming winter is likely to fall and are intended to support planning across that range.

Table A9: Descriptions of ambulance calls due to breathing problems scenarios

Scenario nameScenarioDescription
Scenario ARepeat of 2022 to 2023 dataModel fit to 2022 to 2023 winter season
Scenario BAverage of 2024 to 2025 and 2025 and 2026 dataModel fit to average of 2024 to 2025 and 2025 to 2026 winter seasons
Scenario CSARIMAModel fit to SARIMA modelling using data from April 2022 to March 2026

ICD-10 codes used

This report uses the same pathogen-specific ICD-10 codes as used in the previous 2025 to 2026 winter modelling report.

These codes are narrower than those used in previous winter modelling reports (from before the 2025 to 2026 winter modelling report), to improve concordance with the ICNET multiplex testing dataset (which uses PCR testing to confirm the causative pathogen).

Pneumonia (J12 to J18) and acute bronchitis/bronchiolitis (J20 to J22, excluding RSV codes), previously included under influenza, are now categorised under 'Other infections'.

The following ICD-10 codes along with their description are included in the following tables (Table A10 toA13)):

Table A10: Descriptions of ICD-10 Codes used for flu

ICD-10 codeDescription
J09.X1flu due to identified novel flu A virus with pneumonia
J09.X2flu due to identified novel flu A virus with other respiratory manifestations
J09.X3flu due to identified novel flu A virus with gastrointestinal manifestations
J09.X9flu due to identified novel flu A virus with other manifestations
J10.00flu due to other identified flu virus with unspecified type of pneumonia
J10.01flu due to other identified flu virus with the same other identified flu virus pneumonia
J10.08flu due to other identified flu virus with other specified pneumonia
J10.1flu due to other identified flu virus with other respiratory manifestations
J10.2flu due to other identified flu virus with gastrointestinal manifestations
J11.00flu due to unidentified flu virus with unspecified type of pneumonia
J11.08flu due to unidentified flu virus with other specified pneumonia
J11.1flu due to unidentified flu virus with other respiratory manifestations
J11.2flu due to unidentified flu virus with gastrointestinal manifestations

Table A11: Descriptions of ICD-10 Codes used for RSV

ICD-10 codeDescription
J12.1Respiratory syncytial virus pneumonia
J20.5Acute bronchitis due to respiratory syncytial virus
J21.0Acute bronchiolitis due to respiratory syncytial virus
B97.4Respiratory syncytial virus as the cause of diseases classified elsewhere

Table A12: Descriptions of ICD-10 Codes used for COVID-19

ICD-10 codeDescription
U07.1COVID-19, virus identified.
U07.2COVID-19, virus not identified.
U09.9Post COVID-19 condition, unspecified
U10.9Multisystem inflammatory syndrome associated with COVID-19, unspecified

Table A13: Descriptions of ICD-10 Codes used for ‘Acute LRI not classified as due to flu, RSV or COVID-19 (in the combined scenarios modelling)

ICD-10 codeDescription
J12.0 Adenoviral pneumonia 
J12.2 Parainfluenza virus pneumonia 
J12.3 Human metapneumovirus pneumonia 
J12.8 Other viral pneumonia 
J12.9 Viral pneumonia, unspecified 
J13 Pneumonia due to Streptococcus pneumoniae 
J14 Pneumonia due to Haemophilus influenzae 
J15 Bacterial pneumonia, not elsewhere classified 
J16.0 Chlamydial pneumonia 
J16.8 Pneumonia due to other specified infectious organisms 
J17 Pneumonia in diseases classified elsewhere 
J18 Pneumonia, unspecified organism 
J20.0 Acute bronchitis due to Mycoplasma pneumoniae 
J20.1 Acute bronchitis due to Haemophilus influenzae 
J20.2 Acute bronchitis due to streptococcus 
J20.3 Acute bronchitis due to coxsackievirus  
J20.4 Acute bronchitis due to parainfluenza virus 
J20.6 Acute bronchitis due to rhinovirus 
J20.7 Acute bronchitis due to echovirus 
J20.8 Acute bronchitis due to other specified organisms 
J20.9 Acute bronchitis, unspecified 
J21.1 Acute bronchiolitis due to human metapneumovirus 
J21.8 Acute bronchiolitis due to other specified organisms 
J21.9 Acute bronchiolitis, unspecified 
J22 Unspecified acute lower respiratory infection 

Table A14: Descriptions of ICD-10 Codes used for ‘Other infections of interest’ (in the combined scenarios modelling)

ICD-10 codeDescription
B05 Measles 
B06 Rubella (German measles) 
A08.1 Acute gastroenteropathy due to Norovirus 
A37 Whooping cough 
B95.0 Streptococcus, group A, as the cause of diseases classified elsewhere 
A40.0 Sepsis due to Streptococcus, group A 
A38.9 Scarlet fever, uncomplicated. 
B97.8Other viral agents as the cause of diseases classified elsewhere


Part 8: UK and international comparison

UK comparisons

RSV

During the 2025 to 2026 winter, RSV activity in England started early October 2025 and peaked around mid to late December, which was later than the 2024 to 2025 winter peak in England.

In Wales, a similar pattern was observed with RSV activity starting the week commencing 10 October and peaking early to mid-December 2025.

Sources

Flu

During the 2025 to 2026 winter, the influenza-like illness (ILI) GP consultations rate for each UK nation peaked during December before decreasing during January (with a temporary increase in mid-January).

In England, the ILI rate for the 2025 to 2026 winter was similar than that observed in the 2024 to 2025 season up to week 38, and higher than that observed in the 2024/25 season between week 39 and week 51.

In the 2025 to 2026 season, the ILI rates were above the MEM baseline threshold levels for 12 weeks compared with 14 weeks in the 2024 to 2025 season.

In Wales, the GP ILI consultation rate crossed the baseline threshold of 9.6 per 100,000 population in week 46 2025 (week commencing 10 November 2025) and initially peaked in week 50 2025 (week commencing 8 December 2025) at 25.1 per 100,000 followed by a subsequent peak in week 2 2026 (week commencing 5 January 2026) at 26.3 per 100,000.

The GP ILI consultation rate returned below the baseline threshold in week 4 2026 (week commencing 19 January 2026).

The cumulative consultation rate between week 40 and week 14 was:

  • 275.5 per 100,000 in 2025 to 2026
  • 353.3 per 100,000 in 2024 to 2025
  • 182.0 per 100,000 in 2023 to 2024

Northern Ireland had a higher peak ILI GP consultation rate of 57.5 GP consultations per 100,000 than in the winter of 2024 to 2025.

In Scotland the cumulative GP ILI consultation rate for the 2025 to 2026 season (up to week 14) was:

  • 282 per 100,000 in 2025 to 2026
  • 295 per 100,000 in 2024 to 2025
  • 181 per 100,000 in 2023 to 2024

Direct comparisons can not be made between the nations due to the differing methodologies in data collections.

Hospital admissions due to flu reached high levels (according to the MEM thresholds) in England in 2025 to 2026 with a peak of 10.79 weekly admissions per 100,000 (in week 49, 2025).

Scotland and Northern Ireland reached peaks of 19 and 18.1 weekly hospital admissions per 100,000 population respectively in weeks 49 and 49 2025 respectively.

Wales peaked at 190 weekly admissions in week 51 equating to around 5.96 per 100,000 population.

Different data collection methods were used for each nation, so these admission rates are not directly comparable between countries.

The peak hospital admissions in each UK nation is lower than the peak of the winter prior (2024 to 2025), and the peak was earlier in the season.

Flu test positivity peaked at:

  • around 21.4% (Respiratory Datamart) for England
  • 18.6% for Wales
  • 33.4% for Northern Ireland
  • 27.5% for Scotland

For all nations the peak positivity rate was lower than for the 2024 to 2025 season but the peak arrived a few weeks earlier than in 2024 to 2025.

Different testing methods were used in each UK nation, so the flu test positivity percentages are not directly comparable between the UK countries.

Sources

International comparisons

A rapid review of epidemiological data from the southern hemisphere was conducted to help provide additional insight into the upcoming winter season in Wales.

Australia

In Australia, from January to July 2026, there have been 59,779 influenza cases, 74.3% fewer than the 232,805 cases notified over the same period in 2025.

Overall, influenza activity remains lower than at this time in previous years.

Current trends may suggest a return to a more typical pre-pandemic seasonal pattern (for example, 2015 to 2019), characterised by an increase in influenza cases from June and peaking later in winter (around August).

However, it is too early to confirm this.

Throughout 2026, influenza A (unsubtyped) has been the dominant reported influenza subtype across all age groups.

Influenza A(H3N2) notifications have been reported across all age groups, though most notably in children aged 0 to 4 years old.

Influenza B notifications have fluctuated across all age groups during 2026.

However, a small increase has been observed among the 20 to 64 year age group in weeks 27 to 30.

Influenza-like illness notification rates per 1,000 consultations reached their highest level of 2026 at the end of July.

The notification rate remains lower than observed at the same time in 2023 to 2025 and the historical five-year average.

Patients admitted to sentinel hospitals with influenza have mostly been admitted with influenza A (89.4%; 720/805), while 9.4% (76/805) were admitted with influenza B.

In recent severity reporting periods, influenza A(H3N2) admissions have increased, particularly among the 6 month to 4 year and 5 to 16 years age groups.

This is consistent with recent increases in influenza A(H3N2) notifications in the 0 to 4 years age group and rising influenza activity among children reported by community-based surveillance systems in Australia.

COVID-19 has been the leading cause of acute respiratory infection related mortality across the majority of 2020 to 2025; however, between August 2025 and January 2026 the number of deaths in Australia per month involving influenza (both due to and with) were well above usual levels, exceeding COVID-19 deaths.

Since February 2026, deaths in Australia involving COVID-19 have again been higher than those involving influenza.

Source

World Health Organisation (WHO) surveillance

The WHO currently has 4 Variants under Monitoring (VUMs) as of August 2026.

These variants are:

  • BA.3.2
  • XFG.1
  • PQ.16.1.1
  • NB.1.8.1

XFG.1 is currently the variant that is most prevalent globally.

The newest VUM, however, is PQ.16.1.1 which was designated a VUM on 27 July 2026.

WHO state that PQ.16.1.1 is a NB.1.8.1-descendent SARS-CoV-2 lineage, with increasing proportions globally, driven largely by detections in the Western Pacific Region, particularly Singapore.

Considering the available evidence, the additional public health risk posed by PQ.16.1.1 is evaluated as low at the global level.

Its mutation profile may confer additional immune escape, although direct phenotypic evidence is currently limited.

Available surveillance does not indicate increased clinical severity compared with other circulating variants, and existing vaccines are expected to continue providing protection against severe disease.

Sources

Conclusions based on International picture

Using the international picture to estimate what we may see in Wales, the flu season may see similar figures to 2025 although there could be increased proportion of influenza B and a potential shift in the dominant form of COVID-19.