
Presgripsiynau gofal sylfaenol: Ebrill 2025 i Fawrth 2026
Mae'r datganiad hwn yn darparu ystadegau ar eitemau a ragnodwyd gan ymarferwyr gofal sylfaenol yng Nghymru ac a ddosbarthwyd yn y gymuned (fel arfer mewn fferyllfeydd cymunedol) yn y DU ar gyfer Ebrill 2025 i Fawrth 2026. Saesneg yn unig.
Ar y dudalen hon
Introduction
New statistics on items prescribed and dispensed in the community in Wales referring to the financial year April 2025 to March 2026 unless otherwise stated.
The focus of this release is ‘general practice prescriptions’. This counts the number of items and net ingredient costs of items prescribed through general practices in Wales and dispensed in the community (usually through community pharmacies) anywhere in the UK.
Secondary analysis is provided for items prescribed independently by other primary care practitioners, and for items dispensed in the community in Wales, which were prescribed anywhere in the UK. Guidance on which measures to use is included in the 'Which data to use' section.
'Items’ refer to each different medicine or appliance listed on a prescription regardless of quantity or volume. Only items which are dispensed are counted.
Main points
- All primary care practitioners in Wales prescribed just over 85.5 million items that were dispensed in the community, anywhere in the UK, in the financial year 2025 to 2026.
- Of these, 84.4 million items were prescribed through general practices, an annual decrease of 1.4%. This is the first decrease since the financial year 2020 to 2021.
- While there was a decrease in the latest year, there has been a steady long-term upward trend with 5.5% more items prescribed through general practices over the last decade.
- Total net ingredient costs have increased more sharply than items prescribed over the longer-term. Total net ingredient costs were just over £720 million, 25.0% higher than a decade ago.
- The net ingredient cost per patient registered with a GP in Wales was £217.81, £1.63 higher than the previous year and £31.62 higher than ten years ago.
- Six out of 10 (59.9%) of items prescribed through general practices in Wales were to treat conditions affecting either the cardiovascular, central nervous, or endocrine systems.
- Pharmacists working in community pharmacies independently prescribed 199,000 items, an increase of 31.6%; dental practitioners prescribed 179,000 items, an annual decrease of 9.2%; and optometrists prescribed 49,000 items, an increase of 56.7%.
- More prescription items per population were dispensed in Wales than any of the other UK countries. However, cost per item was the lowest and the cost per population was the second lowest of all 4 countries.
General practice prescriptions
Statistics in this section are based on items prescribed by staff working in Welsh general practices, that are later dispensed in the community, anywhere in the UK. This includes all items prescribed by:
- GPs
- nurses
- pharmacists
- other qualified prescribers employed directly in general practices
It also includes a relatively small number of items (less than 0.5% of the total) prescribed in non-primary care contractor settings including:
- specialist continence services
- prisons
- police stations
It does not include items prescribed:
- by practitioners working in NHS dental practices, pharmacies or optometry practices (shown separately in figure 8)
- in hospitals
- through any non-NHS service
Figure 1: general practice prescription items, between financial years 2016 to 2017 and 2025 to 2026
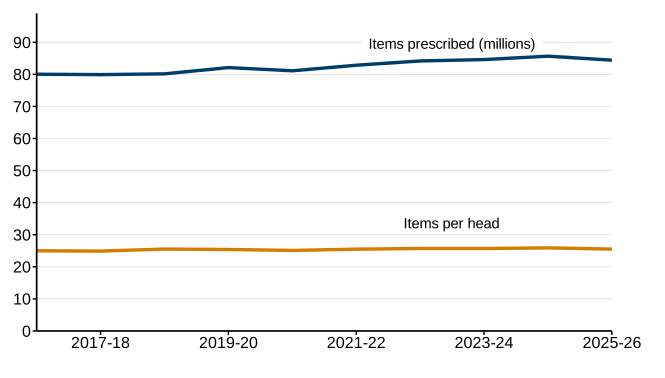
Description of figure 1: line chart showing the number of general practice items prescribed and dispensed decreased in the most recent year, which is in contrast to the long-term upward trend. The number of items per head has remained broadly stable over the last ten years with small annual fluctuations.
Source: Pharmacy and Dispensing Systems, NHS Wales Shared Services Partnership
Prescriptions summary data by year on StatsWales
In 2024 to 2025, 84.4 million items were prescribed through general practices in Wales and dispensed in the community, anywhere in the UK. This was 1.4% lower than in the previous financial year.
This is equivalent to 25.5 items per patient registered with a GP in Wales, a slight decrease of 0.4 from the previous year.
While there was a decrease in the most recent year, the longer-term trend shows a broadly steady increase with a 1.9% increase over the last 5 years and a 5.5% increase over the last 10 years.
Figure 2: general practice prescriptions net ingredient cost, between financial years 2016 to 2017 and 2024 to 2025 [Note 1]
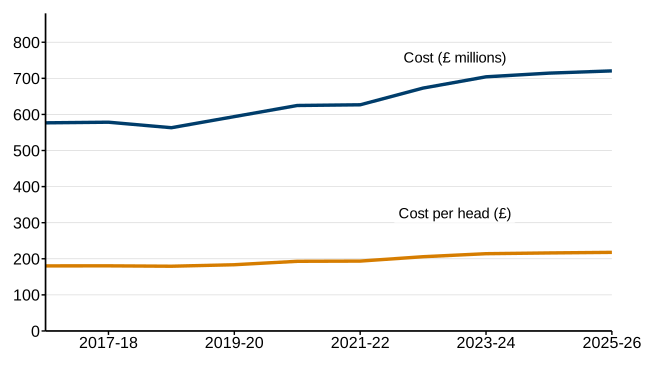
Description of figure 2: line chart showing the net ingredient cost of all items prescribed through general practices and dispensed in the community has been on an upward trend since 2018 to 2019. Net ingredient cost per head has increased over the same period at a slightly lower rate.
Source: Pharmacy and Dispensing Systems, NHS Wales Shared Services Partnership
[Note 1] Net ingredient costs for all years are not adjusted for inflation, as drug prices are subject to various controls including the Pharmaceutical Price Regulation Scheme.
Prescriptions summary data by year on StatsWales
The total net ingredient cost of all items prescribed through general practices in Wales and dispensed in the community, anywhere in the UK, was over £720 million. This was an annual increase of £6.2 million (or 0.9%).
This is equivalent to £217.81 per patient registered with a GP in Wales, an annual increase of £1.63 per patient.
In the 3 years before the financial year 2018 to 2019, the total net ingredient cost had been on a slight downward trend, but it has increased in every year since. The net ingredient cost has increased by 15.0% over the last 5 years and by 25.0% over the last 10 years.
Figure 3: general practice prescriptions average net ingredient costs per item, between the financial years 2016 to 2017 and 2025 to 2026
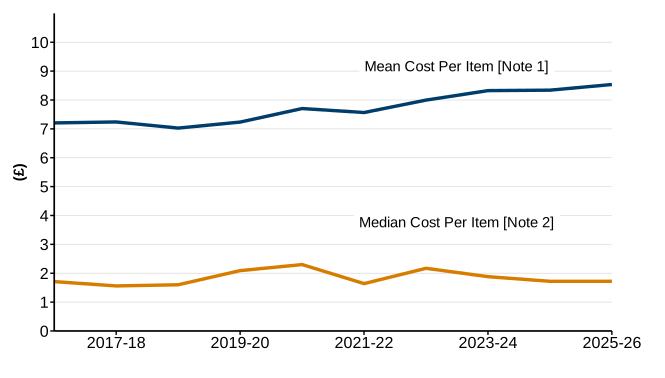
Description of figure 3: line chart showing the mean cost per item prescribed through general practices in Wales and dispensed in the community in the UK has increased annually for the last 8 years. The median cost per item has decreased slightly in recent years but has remained close to £1.80 over the last 10 years.
Source: Pharmacy and Dispensing Systems, NHS Wales Shared Services Partnership
[Note 1] Mean cost per item is calculated by dividing the net ingredient cost for all items prescribed in the financial year by the number of items prescribed in the financial year.
[Note 2] Median cost per item, refers to middle value of the cost per item prescribed in the March of each year only. Data for a single month is used for practical purposes given the volume of prescription items issued. The median may vary for other months during the year.
Mean and median cost per item prescribed on StatsWales
The mean net ingredient cost per item was £8.54. This was £0.20 higher than in the previous year and £1.04 higher than 10 years ago.
The median cost per item in March 2026 was £1.72. This is the same as in March 2025, but £0.13 lower than 10 years ago.
The median cost per item is much lower than the mean cost per item as there were a relatively low number of items with a very high net ingredient cost. These high-cost items will have a greater impact on the mean than the median. The median measure is likely to be a better reflection of the cost of the most commonly prescribed items.
British National Formulary (BNF) chapters
The British National Formulary (BNF) is a pharmaceutical reference book containing information and advice on prescribing. Every item prescribed is categorized by its BNF:
- chapter (for example, central nervous system)
- section (for example, analgesics)
- sub-paragraph (for example, non-opioid analgesics and compound preparations)
- chemical name (for example, paracetamol)
Data for all categories are provided on StatsWales in Cost and number of items prescribed through general practices and dispensed in the community by year, drug, chemical, BNF chapter, section and sub-paragraph and an interactive dashboard that will be available on the publication page for this release.
Figure 4: general practice prescription items and net ingredient cost by BNF chapter, between the financial years 2016 to 2017 and 2025 to 2026
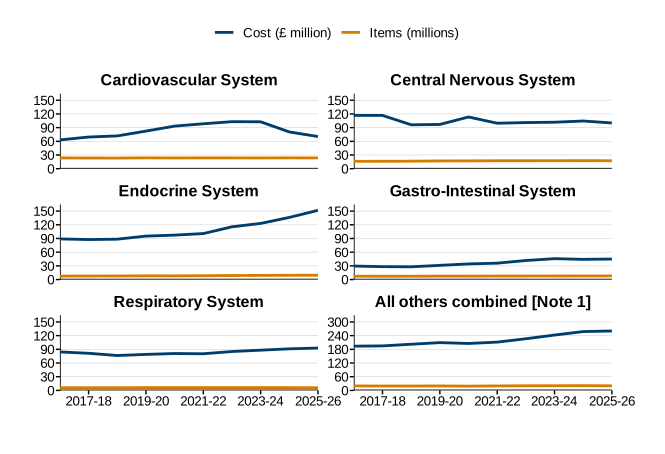
Description of figure 4: line charts showing mixed trends for both items and costs in the five largest BNF chapters. There were large increases for endocrine and gastro-intestinal system items and costs over the last 10 years, while the number of cardiovascular items has remained stable but with costs decreasing in recent years.
Source: Pharmacy and Dispensing Systems, NHS Wales Shared Services Partnership
[Note 1] The chart for ‘All others combined’ includes data for the remaining 18 BNF chapters combined, and its vertical axis is on a different scale to the other charts in this figure.
Prescription items and cost by area, GP cluster, BNF chapter and year on StatsWales
23.6 million items (28.0% of all items) were prescribed and dispensed for treatment of the cardiovascular system, equal to 7.1 items per patient registered with a GP in Wales. This was the most from any single BNF chapter.
The number of cardiovascular items prescribed has remained broadly stable over the last 10 years. However, the cost has increased by 11.7% over the same period but has recently fallen and was 12.4% lower than last year.
17.5 million items (20.7% of all items) were prescribed and dispensed for the treatment of the central nervous system. The number of items prescribed has increased by 8.2% over the last decade, but the cost has decreased by 14.2%.
The chapter with the highest net ingredient costs was endocrine system (£151.7 million), which accounted for a fifth (21.0%) of the total cost of all items prescribed but only 11.3% of the number of items. The cost of endocrine items prescribed increased by 70.3% over the last decade, while the number of items increased by 24.6%.
The BNF chapters with the highest average cost per item were:
- stoma appliances (£74.99)
- malignant diseases and immunosuppression (£29.37)
- incontinence appliances (£27.49)
The chapters with the lowest cost per item were:
- cardiovascular system (£2.99)
- musculoskeletal and joint diseases (£5.12)
- gastro-intestinal system (£5.66)
Most common items prescribed
This section focusses on the most common items (chemical names) prescribed through general practices in Wales and dispensed anywhere in the community in the UK, in the latest financial year.
Figure 5: the 10 most prescribed items through general practices in Wales and dispensed in the community in the UK, for the financial year 2025 to 2026
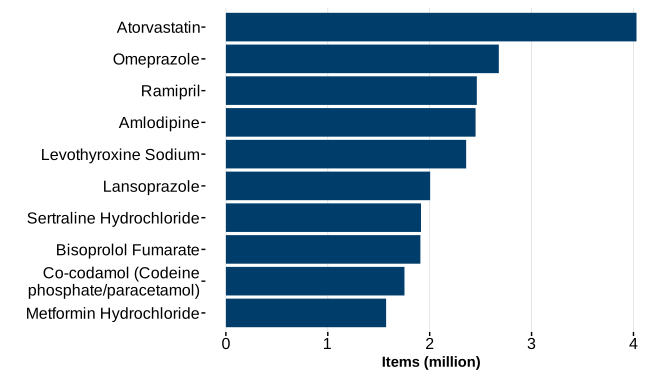
Description of figure 5: bar chart showing the 10 most common items varied from Atorvastatin (4.0 million items) to Metformin Hydrochloride (1.6 million items).
Source: Pharmacy and Dispensing Systems, NHS Wales Shared Services Partnership
Atorvastatin (a lipid-regulating medicine) was prescribed just more than 4 million times and was the most prescribed item in this financial year. This is equivalent to one in every 21 (or 4.8%) of all items prescribed.
The 10 most common items accounted for just more than a quarter (27.4%) of all items prescribed. All items were among the 10 most prescribed items in the previous year.
Prescriptions for 8 of the 10 most common items decreased from the previous year. The largest decreases were for Omeprazole (3.4%) and Levothyroxine Sodium (2.5%).
The number of items prescribed increased from the previous year for Atorvastatin (4.0%) and Sertraline hydrochloride (0.7%).
Items prescribed by general practice staff role
While most items are prescribed by general practitioners (GPs), other registered staff employed in general practices can prescribe items independently.
Figure 6: items prescribed by GPs, between the financial years 2019 to 2021 and 2025 to 2026
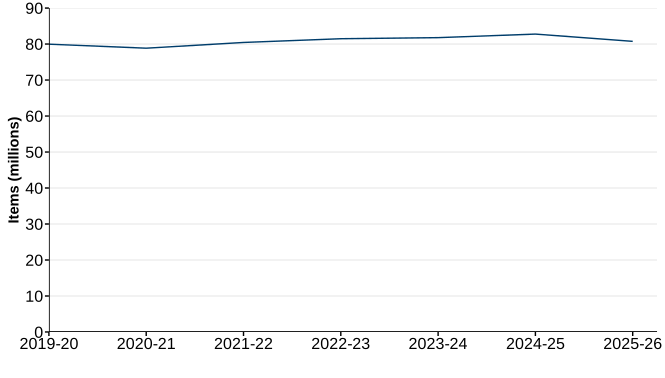
Description of figure 6: line chart showing 80.7 million items were prescribed by general practitioners in the latest year. This was a decrease of 2.4% from the previous years, following 4 consecutive years of increases.
Source: Pharmacy and Dispensing Systems, NHS Wales Shared Services Partnership
Items prescribed by practitioner type on StatsWales
Figure 7: items prescribed by wider staff in general practices, between financial years 2019 to 2020 and 2025 to 2026
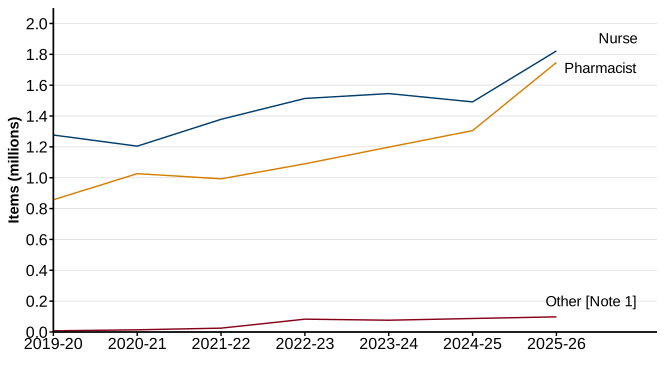
Description of figure 7: line chart showing that the number of items prescribed by non-GP staff in general practices has increased by 41.6% over the last six years, with just more than 3.5 million items prescribed by nurses and pharmacists combined in the latest year.
Source: Pharmacy and Dispensing Systems, NHS Wales Shared Services Partnership
[Note 1] Includes paramedics, physiotherapists, and other qualified prescribers providing direct patient care.
Items prescribed by practitioner type on StatsWales
Since data by prescriber type were first available (financial year 2019 to 2020), the majority of items prescribed in general practice were from GPs. However, as a proportion of all items prescribed in general practices, items prescribed by GPs has decreased from 97.4% to 95.7% over the six-year period.
Just more than 1.8 million items were prescribed by nurses, an increase of 22.2% from the previous year. In total, 2.2% of all items prescribed in general practices in Wales and dispensed in the UK were prescribed by nurses.
A record high number of items (just over 1.7 million) were prescribed by pharmacists working in general practices, an increase of 33.8% from the previous year. In total, 2.1% of all items prescribed through general practices in Wales and dispensed in the UK were issued by pharmacists.
Just more than 98,000 items were prescribed by other staff in general practice.
Figure 8: items independently prescribed by primary care practitioners not in general practice, between financial years 2020 to 2021 and 2025 to 2026
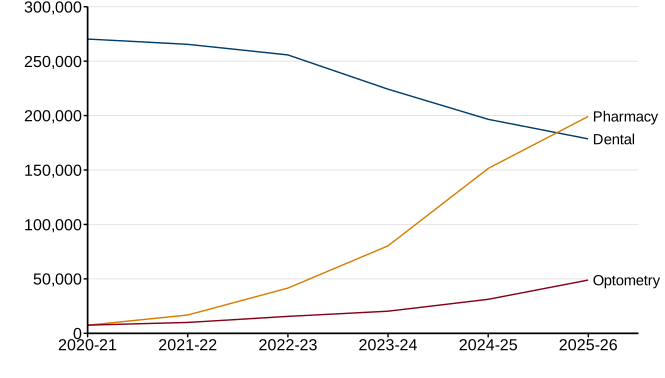
Description of figure 8: line chart showing that for the first time, more items were prescribed by pharmacists in community pharmacy settings than by NHS dentists in the latest year. Over the last 6 years, independent prescribing has increased markedly in pharmacies and in optometries, while it has decreased in NHS dental practices.
Source: Pharmacy and Dispensing Systems, NHS Wales Shared Services Partnership
Items prescribed by practitioner type on StatsWales
Just more than 199,000 items were prescribed through community pharmacies, a 31.6% increase from the previous year. This is the first year in which the number has exceeded those prescribed by NHS dental practices and reflects changes in community pharmacy services in recent years.
Just fewer than 179,000 items were prescribed through NHS dental practices. This was a 9.2% decrease from the previous year and a continuation of the longer-term downward trend.
Just fewer than 49,000 items were prescribed through optometry practices, 56.7% more than in the previous year. The marked recent growth reflects recent eye care service changes in Wales following the inclusion of the Independent Prescribing Optometry Service as part of the Welsh General Ophthalmic Service (WGOS 5).
While not a primary care service, 555 items were prescribed by paramedics directly through the Welsh Ambulance Services NHS Trust. While this was a very small number of items compared to other practitioners, it was an increase of 69.7% from the previous year.
Emergency medicine supply
In certain emergency circumstances, such as patients losing medication or patients unexpectedly running out of medication, community pharmacists can provide a limited quantity of medicines without a prescription. These are counted separately to items prescribed directly by community pharmacists and are therefore not included in figure 9.
At the time of publication (16 July 2026), emergency medicines supply data for the financial year 2025 to 2026 were not available. This section will be updated as soon as new data become available.
Figure 9: medicines provided through emergency medicine supply, between the financial years 2017 to 2018 and 2024 to 2025
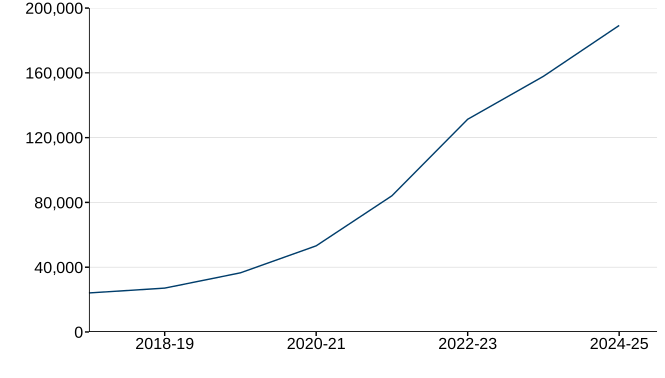
Description of figure 9: line chart showing a large increase in the number of emergency medicines supplied in every year since data was first available in financial year 2017 to 2018.
Source: Choose Pharmacy System, Digital Health and Care Wales
Items supplied through the emergency medicines supply on StatsWales
Prescription volumes
In October 2022, the All Wales Medicines Strategy Group recommended that longer prescribing intervals, where clinically appropriate, would benefit patients and healthcare providers. For example, if a patient is usually prescribed medication in 28-day intervals, they could instead be prescribed 56-day intervals. This would reduce administration time and costs for healthcare providers and reduce the frequency of medication collection for the patient.
Over time, this change should result in fewer items being prescribed to some patients to treat certain conditions. However, the volume of the item per prescription would increase.
As the same items can be prescribed in various forms (liquid/tablets/powder) and in different volumes, it is not possible to measure the volume of items prescribed accurately. However, a sample of 54 medications, known as the ‘28-day basket’ of medications can be used as an approximation of prescription volume. These 54 medications are usually taken as once-daily doses, therefore the total quantity doses divided by the number of times the item is prescribed can give an indication of the average number of days of treatment prescribed.
Figure 10: average prescription volume for medications in the ‘28-day basket’ medications per month, March 2020 to March 2026
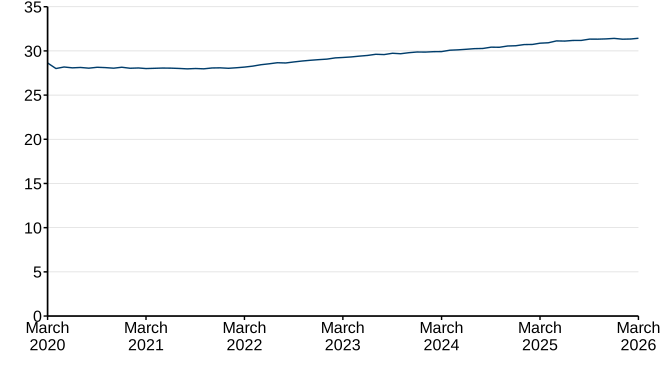
Description of figure 10: line chart showing that prescription volumes have increased incrementally in most months since the longer prescribing intervals policy was recommended in October 2022.
Source: Pharmacy and Dispensing Systems, NHS Wales Shared Services Partnership
In March 2026, there was an average of 31.4 doses per prescription in the ‘28-day basket’ of medications. This was 0.6 doses per prescription (or 1.8%) higher than a year ago, and 3.3 doses (or 11.6%) higher than in March 2022 (the last March before the policy change).
Analysis by local health board
The demographics of local health board areas are different and therefore their clinical needs are different. For example, data for patients registered at general practices in Wales (StatsWales) October 2025 show that 22.0% of the patients were aged 65 or over in Wales, but this ranged between 28.8% in Powys to 16.9% in Cardiff and Vale.
To account for the different age profiles, health board analysis is provided by prescribing unit, rather than by health board population. Prescribing units are calculated by giving a greater weight (by a factor of 3) to the population aged 65 or over. This adjustment is made as older patients typically require more medications. By making this adjustment for age profiles, the differences in the number of items prescribed between health boards are more likely to reflect differing health needs and/or differences in local prescribing culture.
The number and cost of items prescribed by cluster and health board, categorised by BNF chapter is published separately on StatsWales.
Figure 11: prescription items and costs analyses by health board prescribing unit, financial year 2025 to 2026 [Note 1] [Note 2]
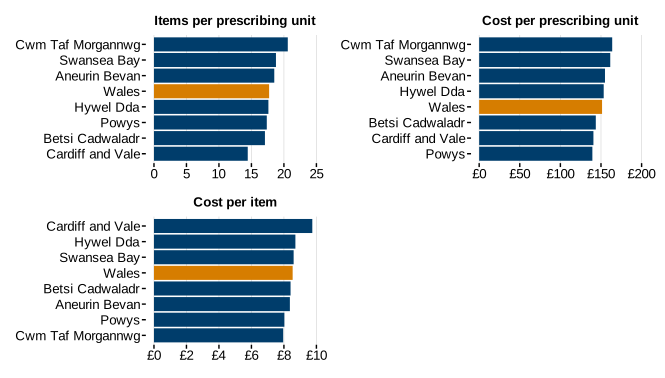
Description of figure 11: bar chart showing that the number of items prescribed per prescribing unit ranged from 14.4 in Cardiff and Vale to 20.6 in Cwm Taf Morgannwg, while the costs per prescribing unit ranged from £139.37 in Powys to £163.80 in Cwm Taf Morgannwg. The average cost per item ranged from £7.95 in Cwm Taf Morgannwg to £9.75 in Cardiff and Vale.
Source: Pharmacy and Dispensing Systems, NHS Wales Shared Services Partnership
[Note 1] These charts are presented next to each other for context. The horizontal axis for each is based on a different scale.
[Note 2] Prescribing unit populations refer to the mid-point of the financial year (October 2025).
Prescription items and costs by local health board prescribing unit on StatsWales
There were large variations in the number of items prescribed and dispensed between each health board. There were 29.9% fewer items prescribed per prescribing unit in Cardiff and Vale than in Cwm Taf Morgannwg.
Similarly, there were variations between the net ingredient costs for items prescribed in each health board with the cost per prescribing unit £23.12 (or 14.9%) lower in Powys than in Cwm Taf Morgannwg.
However, there was less variation in the cost per items prescribed, per prescribing unit, with 6 of the 7 health boards within £0.58 of the Wales average. The highest cost per item, per prescribing unit was in Cardiff and Vale, 14.2% higher than the Wales average.
The statistics suggest fewer items per prescribing unit were required in Cardiff and Vale health board, but a higher proportion of the items prescribed were more expensive items than in other health boards. Conversely, more items per prescribing unit were required in Cwm Taf Morgannwg, but a higher proportion of the items prescribed were relatively less expensive items than in other health boards.
Prescribing by cluster deprivation
Using Welsh Index of Multiple Deprivation (WIMD) and GP practice population data (StatsWales) it is possible to calculate an approximate measure of deprivation at general practice and GP collaborative/cluster level (Public Health Wales).
Clusters are allocated to a cluster deprivation quintile based on the percentage of patients that live in the most deprived 20% of areas in WIMD 2025. The quintile with the highest percentage of people living in deprived areas is quintile 1. The quintile with the least is quintile 5. For this release, the deprivation quintiles are based on GP cluster deprivation on 8 April 2026. This reference date was chosen as it was the first cluster deprivation data since WIMD 2025 was published.
Full details of the methodology used are available in the statistical article General practice and primary care cluster population and workforce by deprivation: at 31 December 2021.
Prescriptions data in this analysis only include general practices operating under a General Medical Services (GMS) contract as these are part of clusters. In practice, this includes all NHS general practices and excludes non-general practice settings such as specialist continence services, prisons and police stations.
Figure 12: number of items prescribed per patient registered with a GP by cluster deprivation quintile, financial year 2025 to 2026
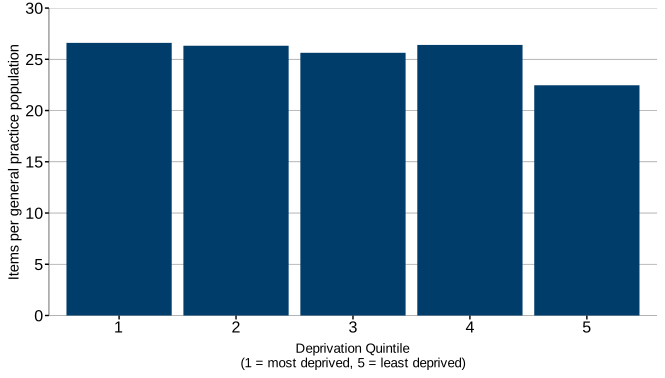
Description of figure 12: bar chart showing the number of items prescribed by deprivation quintile ranged from 27.6 items per patient in the most deprived quintile to 22.5 items per patient in the least deprived quintile.
Sources: Pharmacy and Dispensing Systems, NHS Wales Shared Services Partnership; Welsh Index of Multiple Deprivation (WIMD), Welsh Government
Prescription items and costs by cluster deprivation quintiles on StatsWales
Figure 13: net ingredient cost per item prescribed by cluster deprivation quintile, for the financial year 2025 to 2026
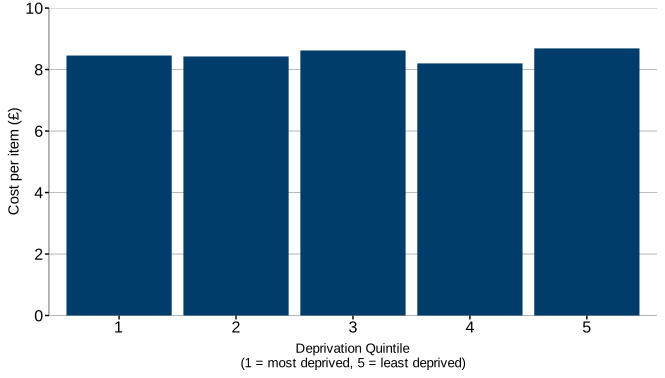
Description of figure 13: bar chart showing there was small variations in the net ingredient costs per item prescribed by deprivation quintile. These ranged from £8.20 in the second least deprived quintile, to £8.69 per item in the least deprived quintile.
Sources: Pharmacy and Dispensing Systems, NHS Wales Shared Services Partnership; Welsh Index of Multiple Deprivation (WIMD), Welsh Government
Prescription items and costs by cluster deprivation quintiles on StatsWales
The differences in the number of items prescribed per head in cluster deprivation quintiles 1 to 4 was small (less than 1 item different). However, there were markedly fewer items prescribed per head in the least deprived quintile (15.6% fewer than in the most deprived quintile).
The net ingredient cost per item prescribed only differed slightly between deprivation quintiles and the cost per item in the most deprived quintile was 23p lower than in the least deprived quintile. The largest difference between all quintiles was between the least and second least deprived quintiles, with a difference of 49p.
This suggests while fewer items are prescribed to people living in less deprived areas, the cost of items prescribed is less affected by deprivation.
UK comparisons
This section compares the number of items dispensed and their net ingredient costs across the four UK countries.
The data in this section are based on the measure ‘prescription items dispensed in the community’. These data are based on the location of the community pharmacy where items were dispensed, rather than by the location of the prescriber. Therefore, statistics for Wales in this section will differ from those presented in the other sections in the release. Prescriptions dispensed in the community is a broadly consistent measure available across all 4 countries.
For consistency between countries, the latest available Office for National Statistics (ONS) mid-year population estimates (2024) are used in this section, rather than patients registered to a general practice.
The latest data for Wales and England refer to the financial year 2025 to 2026. For Scotland the financial year 2024 to 2025, and for Northern Ireland the calendar year 2025. All Northern Ireland data refer to the calendar year. England data refer to the calendar year for years 2016 to 2019 and financial years from the financial year 2020 to 2021 onwards. Scotland data refer to the financial years between 2016 to 2017 and 2024 to 2025.
Figure 14: prescription items dispensed in the community per population, UK countries, between the financial year 2016 to 2017 and the latest available year [Note 1] [Note 2]
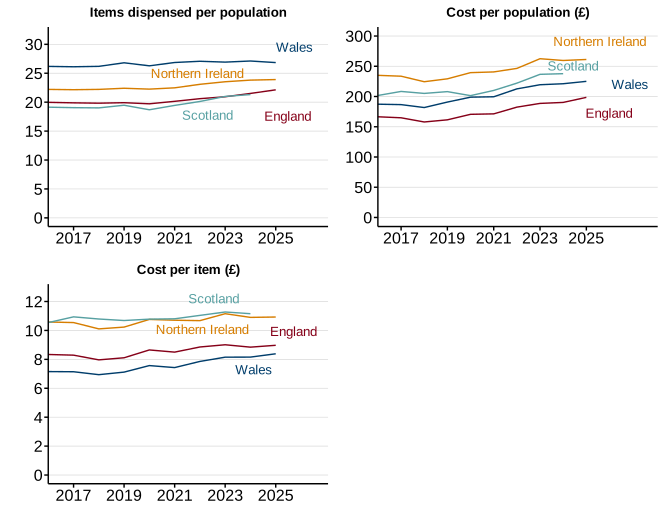
Description of figure 14: line charts showing variation in items and costs between the four nations. Wales has consistently the most items dispensed per head but the second lowest cost per population and lowest cost per item over the ten-year period.
[Note 1] These charts are presented next to each other to provide additional context. The vertical axis for each is based on a different scale.
[Note 2] Items per head for Scotland and England nearly the same value from 2022 onwards which make their lines indistinguishable.
Sources: Pharmacy and Dispensing Systems, NHS Wales Shared Services Partnership (Wales), NHS Business Services Authority (England); Public Health Scotland (Scotland) and Business Services Organisation (Northern Ireland).
There is variation in prescribing between countries, which is likely to be explained by different:
- prescribing policies
- population health needs
- local prescribing cultures
Comparing the latest time period available for each country, 5.5 more items per population were dispensed in Welsh community pharmacies compared with Scottish community pharmacies. However, the total net ingredient cost of those items was £12.71 lower per person in Wales than in Scotland.
The net ingredient cost per prescription item was £8.38 in Wales, the lowest of all UK countries. This was £2.77 cheaper than in Scotland, £2.54 cheaper than Northern Ireland and £0.59 cheaper than in England.
This means that while more items are dispensed in Wales, the items cost less than those dispensed in other countries. This may be explained by several factors including:
- lower volumes per item prescribed in Wales compared with other countries
- different types of items prescribed in each country
- the availability of certain items in each country
This is particularly a factor in for Wales as certain more expensive stoma appliances are only available for dispensing in specialist settings located in England.
Hospital medicines data (official statistics in development)
Data on the cost of medicines purchased in Welsh hospitals complement primary care prescribing data and help provide a fuller picture of prescribing and medicine services in Wales. These are official statistics in development as this is the first time this source has been used for official statistics, and quality assurance processes are in development.
Hospital prescribing data are sourced from pharmacy stock systems and measure the value of medicines issued in hospitals in Wales. The data show medicines issued, some of which may not have been given to patients in same reference period.
Only costs are reported, as the publication of medicine volumes alongside costs could disclose commercially sensitive information.
The data include the actual price paid by NHS hospitals including discounts applied at the point of purchase. This excludes any rebates paid in accordance with commercial agreements between the NHS and suppliers. It also excludes any payments made by manufacturers under the UK statutory and voluntary price regulation schemes which operated in the relevant period.
Figure 15: the 10 medicines with the highest total cost purchased by hospitals in Wales, for the financial year 2025 to 2026
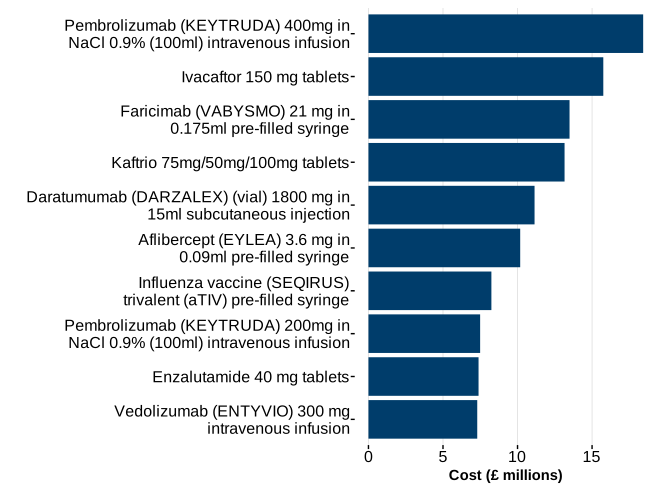
Description of figure 15: bar chart showing that the ten medicines purchased by hospitals with the highest cost ranged from Pembrolizumab 400mg intravenous infusion (£18.4 million) to Vedolizumab 300 mg intravenous infusion (£7.3 million).
Source: Hospital Pharmacy Stock Measuring System, Digital Health and Care Wales
The total spend on medicines purchased by hospitals was £602.6 million, a 6.6% increase from the previous financial year.
Overall, over 9,000 different medicines were purchased, and the 10 with the highest cost accounted for 16.4% of the total medicine spend.
£18.4 million was spent on Pembrolizumab 400mg in NaCl 0.9% (100ml) intravenous infusion (most commonly used as an immunotherapy treatment for cancer), the highest cost of all medicines. The next highest costs were:
- Ivacaftor 150mg tablets (used to treat cystic fibrosis)
- Faricimab 21mg in 0.175ml pre-filled syringe (used for treating age-related macular degeneration and other eye ailments)
- Kaftrio 75mg/50mg/100mg tablets (a combination medicine also used for treating cystic fibrosis)
Quality and methodology information
Detailed quality and methodology information is published in the accompanying quality report.
Unless otherwise stated, statistics referring to items prescribed through general practices also include a relatively small number of items dispensed in the community which had been prescribed in a community setting that was not a formal general practice, pharmacy, dental practice or optometry practice, but had been allocated a prescribing code (W code) by the local health board. These include settings such as specialist continence services, prisons, police stations and public health services. In the financial year 2025 to 2026, items from these settings accounted for less than 0.5% of all items prescribed.
NHS Shared Service Partnership also publish data on items prescribed through general practices every month, based on the same data which are presented in this publication.
An interactive data tool that allows users to search data on BNF chapters, sections, and sub paragraphs, based on general practice prescriptions is published alongside this release. Data for the financial year 2025 to 2026 will be updated in this tool as soon as practicable after the publication date.
Data for England ('Prescription Cost Analysis - England' (NHS Business Services Authority)), Scotland ('Dispenser payments and prescription cost analysis' (Public Health Scotland)) and Northern Ireland ('Prescription Cost Analysis' (Business Services Organisation)) are published on each country’s respective websites.
Complementary data on general practice workforce, general practice populations (StatsWales), deprivation at general practice level and community pharmacies are also published by the Welsh Government.
Which data to use
84.4 million items were prescribed through general practices in Wales and dispensed in the UK. This compares with 85.5 million items prescribed by anywhere in the UK and dispensed in the community in Wales. A comparison table for both measures by BNF chapter is published on StatsWales.
In general, when analysing prescriptions data for Wales, items prescribed through general practices (labelled ‘items prescribed by GPs’ on the StatsWales data table) should be used as the primary source. This is because these data show what is being prescribed to people registered with Welsh general practices, and this activity is monitored and influenced by health board policy. These data include items that are prescribed by GPs, nurses, pharmacists, paramedics, physios and any other licensed prescribers who work in general practices. The items prescribed in Welsh general practices can be dispensed in any community dispensary in the UK (usually community pharmacies).
‘Items dispensed in the community’ should be used for more specific purposes where users are interested only in the items dispensed in Wales, and if direct comparisons are being made between different UK countries. While the number of items prescribed through general practice is close to the number of items prescribed and dispensed in Wales, it does not exactly match for several reasons.
Reasons why general practice prescriptions and items dispensed in the community figures differ
- Items prescribed in Wales but dispensed elsewhere in the UK (including the Isle of Man) are counted in general practice prescriptions but not ‘prescriptions dispensed in the community’. This is particularly common for specialist items such as stomas and incontinence appliances which are often dispensed by appliance contractors, many of which are not located in Wales.
- Items prescribed in another UK country (including the Isle of Man) but dispensed in Wales are not included in general practice prescriptions, but are included in ‘prescriptions dispensed in the community’
- Items which were prescribed by hospital practitioners, which are subsequently dispensed in a community pharmacy, will not be included in general practice prescriptions, but they would be included in ‘prescriptions dispensed in the community’
Note that both ‘general practice prescriptions’ and ‘prescriptions dispensed in the community’ capture prescriptions which are dispensed by dispensing doctors, appliance contractors and community (high street) pharmacies. Neither source contains data for items prescribed and dispensed in hospitals.
Statement of compliance with the Code of Practice for Statistics
Our statistical practice is regulated by the Office for Statistics Regulation (OSR). OSR sets the standards of trustworthiness, quality and value in the Code of Practice for Statistics that all producers of official statistics should adhere to.
All of our statistics are produced and published in accordance with a number of statements and protocols to enhance trustworthiness, quality and value. These are set out in the Welsh Government’s Statement of Compliance.
These official statistics in development demonstrate the standards expected around trustworthiness, quality and public value in the following ways.
Trustworthiness
The published statistics are compiled by professional analysts using the latest available data and applying methods using their professional judgement and analytical skillset.
These statistics are pre-announced on the Statistics and Research area of the Welsh Government website. Access to the data during processing is restricted to those involved in the production of the statistics, quality assurance and for operational purposes. Pre-release access is restricted to eligible recipients in line with the Code of Practice for Statistics.
Quality
Statistics published by Welsh Government adhere to the Statistical Quality Management Strategy which supplements the Quality pillar of the Code of Practice for Statistics and the European Statistical System principles of quality for statistical outputs.
Value
The purpose of this statistical release is to provide an annual review of prescribing activity in primary care in Wales, with more specific underlying data published in spreadsheets, on open data StatsWales tables and a dashboard. These products allow all users access to the data and analysis they require, from high level summaries to individual chemical name data.
In 2026, we added a new section on hospital medicines spend to further enhance the evidence base for prescriptions and medicines in Wales.
Well-being of Future Generations Act (WFG)
The Well-being of Future Generations Act 2015 is about improving the social, economic, environmental and cultural wellbeing of Wales. The Act puts in place seven wellbeing goals for Wales. These are for a more equal, prosperous, resilient, healthier and globally responsible Wales, with cohesive communities and a vibrant culture and thriving Welsh language. Under section (10)(1) of the Act, the Welsh Ministers must (a) publish indicators (“national indicators”) that must be applied for the purpose of measuring progress towards the achievement of the wellbeing goals, and (b) lay a copy of the national indicators before Senedd Cymru. Under section 10(8) of the Well-being of Future Generations Act, where the Welsh Ministers revise the national indicators, they must as soon as reasonably practicable (a) publish the indicators as revised and (b) lay a copy of them before the Senedd. These national indicators were laid before the Senedd in 2021. The indicators laid on 14 December 2021 replace the set laid on 16 March 2016.
Information on the indicators, along with narratives for each of the wellbeing goals and associated technical information is available in the Wellbeing of Wales report.
Further information on the Well-being of Future Generations (Wales) Act 2015.
The statistics included in this release could also provide supporting narrative to the national indicators and be used by public services boards in relation to their local wellbeing assessments and local wellbeing plans.
Contact details
NHS workforce and primary care statistics
Email: stats.healthinfo@gov.wales
Media: 0300 025 8099
SFR 58/2026