
Gwyddoniaeth Ymchwil Tystiolaeth: modelu'r gaeaf 2026 i 2027 - Part 3: acute respiratory infections admissions and occupancy
Mae'r papur hwn yn darparu senarios wedi'u modelu ar gyfer ffliw, COVID-19 a feirws syncytiol anadlol (RSV) ar gyfer tymor y gaeaf sydd i ddod.
Ar y dudalen hon
Acute respiratory infection admissions and occupancy
This section provides historic analysis and future modelled scenarios of hospital admissions and hospital bed occupancy for the three main respiratory illnesses:
- flu
- RSV
- COVID-19
As well as including modelling for each of the three main respiratory illnesses, combined modelling scenarios are also provided which take into account other viral infections too to reflect the wider impact due to infections on the healthcare system throughout the winter period.
For the three main respiratory viruses (flu, RSV and COVID-19), modelling scenarios are presented indicating a range of possible scenarios for winter 2026 to 2027.
The modelling provides at least three scenarios for each virus:
- a lower-bound scenario
- a mid-range scenario (sometimes considered a most likely scenario, MLS)
- an upper-bound or reasonable worst case (RWC) scenario
COVID-19 scenarios anticipate peaks occurring in October 2026.
RSV scenarios estimate peaks between November and December 2026 while flu scenarios suggest peaks between December 2026 and January 2027.
Other infections included in the modelling
There are also infections such as pneumonia, bronchitis and bronchiolitis to consider.
To capture patients in hospital with these infections who aren’t already classed as having flu, RSV or COVID-19, we grouped those with ICD10 codes J12 to J22 (excluding the flu, RSV and COVID-19 ICD10 codes).
This grouping will be referred to as ‘acute lower respiratory infection not classified as due to flu, RSV or COVID-19’ or ‘ALRI’ from here on.
For the full list of ICD10 codes used, please see the Annex.
To assess the impact of additional infections (where the patients in hospital were not already classed as having flu, RSV or COVID-19 or ALRI), admissions attributed to:
- Measles and Rubella (B05 to B06)
- Norovirus (A08.1)
- Whooping cough (A37)
- Streptococcus A (B950, A400, and A389)
- other viral agents as the cause of diseases classified elsewhere (B978)
were quantified.
This grouping will be referred to as ‘other infections of interest’ from here on.
For the full list of ICD10 codes used, please see the Annex.
The pressure on hospitals from ‘acute lower respiratory infection not classified as due to flu, RSV or COVID-19’ and from ‘other infections of interest’ remains similar throughout the year, whereas the pressure from flu, RSV and COVID-19 have clear peaks, which places additional strain on hospitals during winter.
Combined scenarios
To assess the collective impact of infections throughout winter, a Most Likely Scenario (MLS) and a Reasonable Worst Case (RWC) scenario were selected for flu, RSV and COVID-19.
These were then added together and combined with the three-year average of:
- ‘acute lower respiratory infection (ALRI) not classified as due to flu, RSV or COVID-19’
- ‘other infections of interest’
described above (based on data covering the 2023 to 2024, 2024 to 2025, and 2025 to 2026 winter seasons).
Further details of the scenarios are provided in the Annex (Tables A2 and A3).
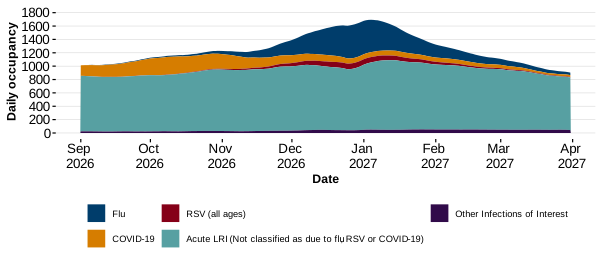
Figures 2 to 5 show the projected combined scenarios for the period from 1 September 2026 to 1 March 2027.
According to modelling projections:
- The combined MLS and RWC admissions scenario anticipate peaks on 24 December 2026 of 214 and 258 daily admissions respectively.
- The combined MLS occupancy estimates a peak of 1,694 beds on 4 January 2027.
- The combined RWC occupancy estimates a peak of 2,118 beds on 3 January 2027.
Figure 2: Combined Most Likely Scenario (MLS) – Daily Hospital Admissions (including ICU admissions), between September 2026 and March 2027
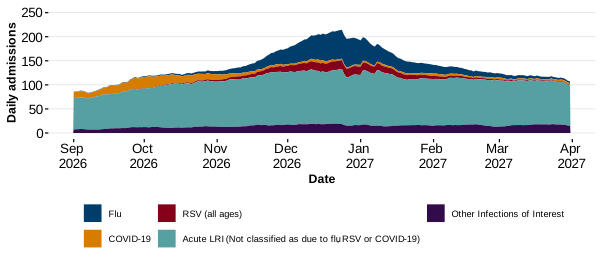
Description of Figure 2: An area chart illustrating the combined MLS for daily hospital admissions across Wales during the 2026 to 2027 winter season for influenza, RSV, COVID-19, ALRI not classified as due to flu, RSV or COVID-19, and other infections of interest.
Source: SRE calculations using PEDW data provided by DHCW
Figure 3: Combined Reasonable Worst Case (RWC) scenario – Daily Hospital Admissions (including ICU admissions), between September 2026 and March 2027
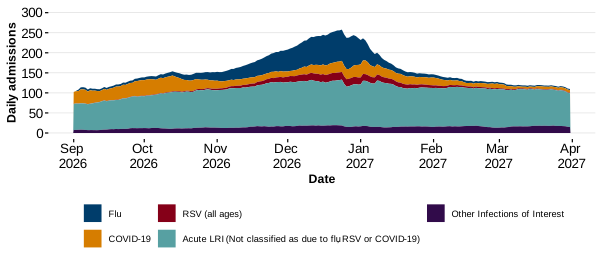
Description of Figure 3: An area chart illustrating the combined RWC scenarios for daily hospital admissions across Wales during the 2026 to 2027 winter season for influenza, RSV, COVID-19, ALRI not classified as due to flu, RSV or COVID-19, and other infections of interest.
Source: SRE calculations using PEDW data provided by DHCW
Figure 4: Combined Most Likely Scenario (MLS) – Daily Occupancy (including ICU admissions), between September 2026 and March 2027
Source: SRE calculations using PEDW data provided by DHCW
Description of Figure 4: An area chart illustrating the combined MLS for all daily hospital occupancy across Wales during the 2026 to 2027 winter season for influenza, RSV, COVID-19, ALRI not classified as due to flu, RSV or COVID-19, and other infections of interest.
Figure 5: Combined Reasonable Worst Case (RWC) Scenario – Daily Occupancy (including ICU admissions), between September 2026 and March 2027
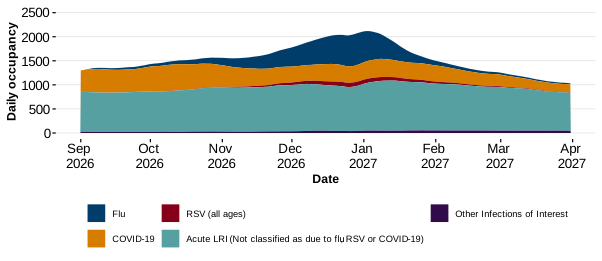
Description of Figure 5: An area chart illustrating the combined reasonable worst case (RWC) scenarios for daily hospital occupancy across Wales during the 2026 to 2027 winter season for influenza, RSV, COVID-19, ALRI not classified as due to flu, RSV or COVID-19, and other infections of interest.
Source: SRE calculations using PEDW data provided by DHCW
Influenza (flu)
To assess the impact of flu on secondary care in Wales, daily hospital admissions and bed occupancy related to flu were identified using International Classification of Diseases, Version 10 (ICD-10) codes: J09 to J11.
Admissions and bed occupancy data were smoothed using 7-day rolling averages to identify seasonal peaks and trends.
To model flu admissions and bed occupancy for winter 2026 to 2027, different approaches were used based on:
- historical data
- vaccine coverage
- epidemiological modelling techniques
These approaches were used to provide a range of possible scenarios.
For further information on the modelling scenarios used, see the Annex.
For further detail on the methodology, see the supplementary technical report.
Flu admissions
During the 2025 to 2026 winter, a total of 3,513 flu admissions were recorded – compared to:
- 2,435 in the 2023 to 2024 winter
- 4,484 in 2024 to 2025 winter
The daily admissions among all ages showed a peak of 56 in the 2025 to 2026 on the 22 and 23 December 2025, which was smaller than the size of the 2024/25 winter peak. (See Figure 6)
Scenarios A, B and C estimate peaks of:
- 78 admissions
- 70 admissions
- 60 admissions
respectively in the last week of December 2026.
Scenario D estimates a peak of 26 admissions during the third week of January 2027. (See Figure 7)
Figure 6: 7 day rolling average of daily flu admissions, between April 2021 and March 2026
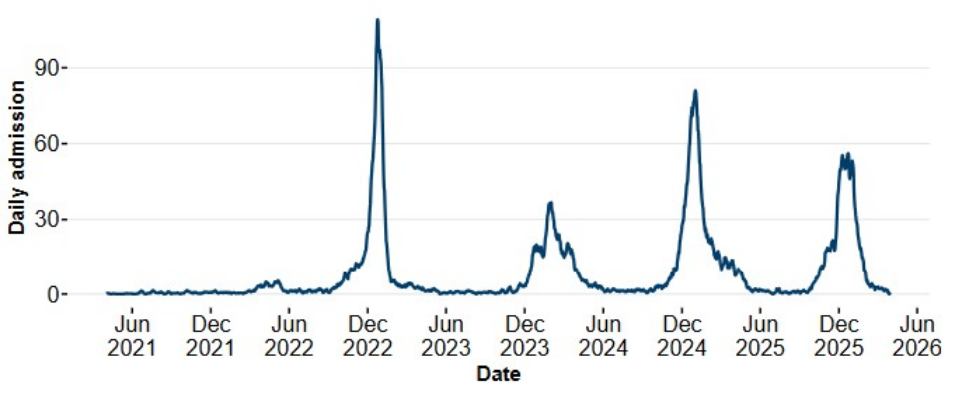
Description of Figure 6: A line chart showing the 7 day rolling average of recorded daily flu admissions.
Source: Digital Health and Care Wales (DHCW)
Figure 7: daily flu admissions scenarios, winter 2026 to 2027
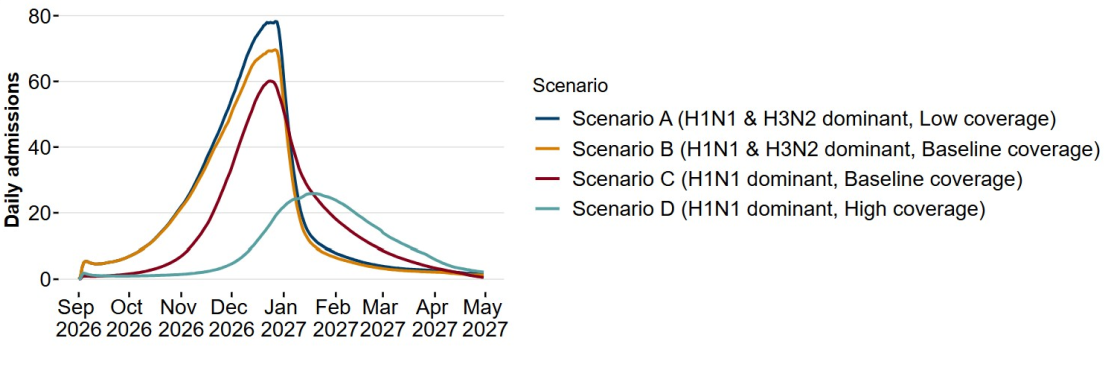
Description of Figure 7: A line chart illustrating various projected scenarios (Scenario A to Scenario D) for admissions due to flu during the 2026 to 2027 winter season.
Source: SRE modelling using PEDW data provided by DHCW
Flu occupancy
The highest peak in flu occupancy over the past five years occurred in the 2022 to 2023 winter where a maximum value of 602 beds per day was observed.
During the 2025 to 2026 winter, the occupancy due to flu peaked at 286 beds on 4 January 2026, smaller than the peak height of the winter before (2024 to 2025 winter). (See Figure 8)
Scenario A estimates a peak occupancy of 660 beds on 29 December 2026.
Scenarios B and C estimate a peak occupancy of:
- 578 beds
- 503 beds
on 29 to 30 December 2026 respectively.
Scenario D estimates a peak occupancy of 220 beds on 22 January 2027. (See Figure 9)
Figure 8: 7 day rolling average of daily flu occupancy, between April 2021 and March 2026
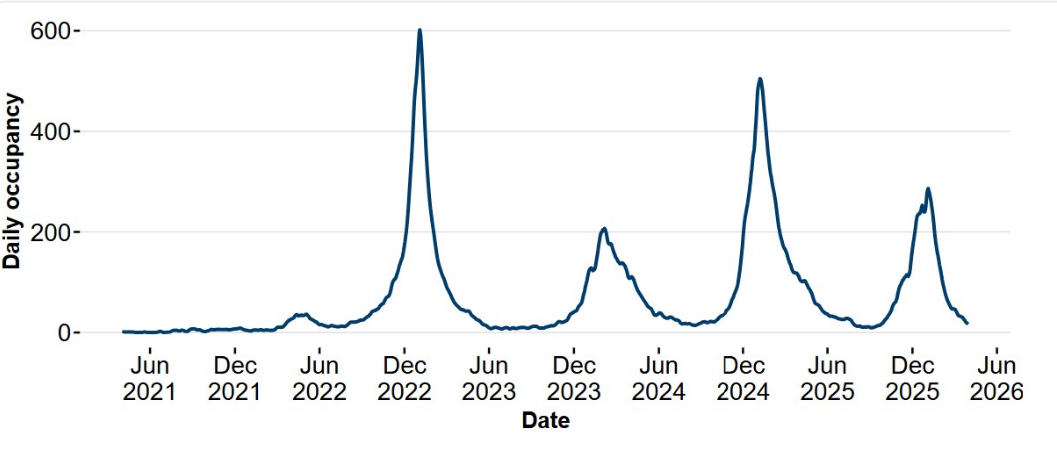
Description of Figure 8: a line chart showing the 7 day moving average of hospital occupancy due to flu in Wales.
Source: Digital Health and Care Wales (DHCW).
Figure 9: Daily flu occupancy scenarios, winter 2026 to 2027
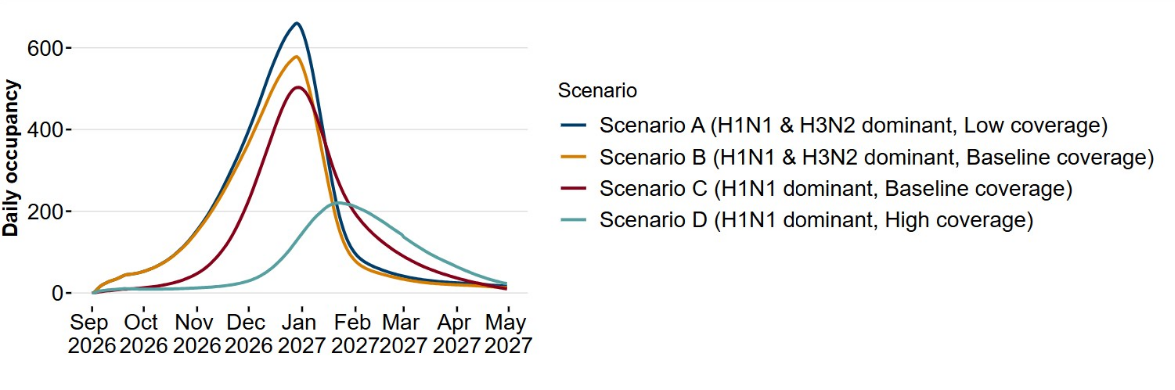
Description of Figure 9: A line chart representing various projected scenarios (Scenario A to Scenario D) for flu-related hospital occupancy.
Source: SRE calculations using PEDW data provided by DHCW
Respiratory syncytial virus (RSV)
RSV is a common respiratory virus that usually causes mild, cold-like symptoms. However, it can lead to more severe illness in infants and older adults with weakened immune systems, which may result in hospital admissions.
The RSV vaccination programme for pregnant women (providing some protection for young infants) and older people began in September 2024. The programme was expanded on 1 April 2026 to include adults aged 80 years and over and all residents in care homes.
To model RSV admissions and bed occupancy for winter 2026 to 2027, different approaches were used based on:
- historical data
- vaccine coverage
- epidemiological modelling techniques
The model used was an age-stratified deterministic SEIRS compartmental transmission model, which allowed the impact of different vaccine assumptions to be assessed across age groups.
This section includes outputs from the RSV compartment model for people in Wales aged:
- 0 to 4 years
- 75 years and over
Further RSV modelling outputs can be found in the RSV model supplementary report.
The report also provides estimates of the percentage of admissions averted in different age groups in Wales following the introduction of the vaccination programme.
The analysis shows that the estimated percentage of admissions averted during the 2024 to 2025 and 2025 to 2026 winters was higher in age groups eligible for vaccination, or expected to gain immunity from maternal vaccination, than in age groups that were not eligible.
Similarly, the winter 2026 to 2027 modelling estimates that vaccine-eligible age groups, including infants, will have a higher percentage of admissions averted than people aged between 1 year and 75 years.
The model estimates that, after the second year of programme implementation:
- 18.45% of admissions were averted among infants aged 1 to 6 months
- 7.92% of admissions were averted among infants aged 7 to 12 months
The model was also used to generate projections for winter 2026 to 2027 incorporating the effects of vaccinating adults aged 80 years and over.
Using a range of vaccine uptake scenarios in this age group, the model estimates that vaccination could avert between 24.6% and 46.4% of RSV hospital admissions among adults aged 80 years and over during winter 2026 to 2027.
This is substantially higher than the estimated proportion of admissions averted in age groups aged over 1 year and under 75 years.
As with all modelling studies, the results are contingent on several assumptions, including:
- contact patterns
- vaccine efficacy
- completeness of ICD-10 coding
These assumptions introduce uncertainty and should be considered when interpreting the findings.
The effects of vaccinating care home residents have not been considered.
Therefore, the model outputs should be viewed as indicative rather than definitive, and as an estimate of what might happen rather than a prediction of what will happen.
For further information on the modelling scenarios used, see the Annex.
For further detail on the methodology used, see the RSV supplementary technical report.
RSV paediatric admissions (ages 0 to 4 years)
During the 2025 to 2026 winter season, there were a total of 1,004 RSV paediatric admissions (in children aged 0 to 4 years inclusive).
This was:
- 2% lower than the previous season
- 33% lower than the 3-year pre-vaccination seasonal average
Daily admissions peaked at 19 in the third week of December 2025, around a month later than the previous season.
The largest reduction in total admissions was observed among infants aged 1 to 6 months.
During the 2025 to 2026 winter season, this age group accounted for 359 admissions, representing:
- a 23% decrease compared with the 2024 to 2025 season
- a 49% decrease compared with the 2023 to 2024 winter season
Children aged 7 to 12 months experienced 238 admissions, representing a 10% increase compared with the previous season.
The greater reductions among the youngest age groups may reflect the temporary protective effects of maternal vaccination, which is likely to last around 6 months after birth. (See Figure 10)
The RSV scenarios are generated using an epidemiological model. See the Annex for further information.
Scenario A, with low vaccine coverage, estimates a peak of 14 admissions among children aged 0 to 4 years on 20 December 2026.
Scenario B, with baseline vaccine coverage, estimates a peak of 13 admissions on 20 December 2026.
Scenario C, with high vaccine coverage, estimates a peak of 13 admissions on 20 December 2026. (See Figure 11)
The effect of vaccination is more apparent in younger age groups aged under 1 year.
The model estimates reductions of:
- between 9% and 31% among infants aged 1 to 6 months
- between 3% and 12% among infants aged 7 to 12 months
based on a maternal vaccine uptake range between 0% and 90%.
See the Effect of respiratory syncytial virus (RSV) vaccines on hospital admissions in Wales paper for further information.
Figure 10: 7-day rolling average of daily paediatric RSV admissions (ages 0 to 4 years), between April 2021 and March 2026
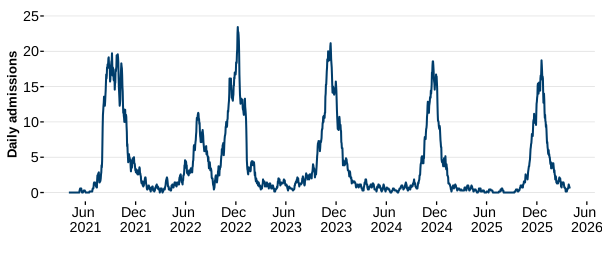
Description of Figure 10: a line chart showing recorded daily Respiratory Syncytial Virus (RSV) admissions among children aged 0 to 4 years.
Source: Digital Health and Care Wales (DHCW).
Figure 11: Daily paediatric RSV admissions (ages 0 to 4 years) scenarios, between September 2026 and March 2027
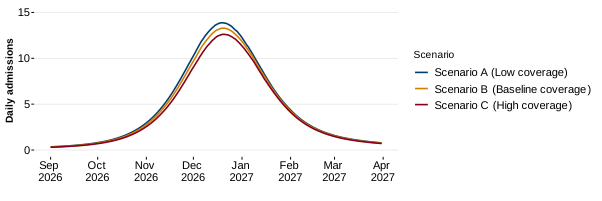
Description of Figure 11: A line chart representing projected scenarios for RSV admissions among children aged 0 to 4 years, factoring in vaccination uptake varied between 20% above and below the observed coverage.
Source: SRE calculations using PEDW data provided by DHCW
RSV paediatric bed occupancy (ages 0 to 4 years)
Bed occupancy due to RSV in children aged 0 to 4 years peaked at 31 beds per day on 18 and 20 December 2025, higher than the previous year’s peak of 29 beds per day on 30 November 2024. (See Figure 12)
Scenario A with low vaccine coverage estimates a peak occupancy of 33 beds on 20 December 2026.
Scenario B with baseline vaccine coverage estimates a peak occupancy of 32 beds on 21 December 2026.
Scenario C with high vaccine coverage estimates a peak occupancy of 30 beds on 21 December 2026. (See Figure 13)
Figure 12: 7 day rolling average of daily paediatric RSV occupancy (ages 0 to 4 years), between April 2021 and March 2026
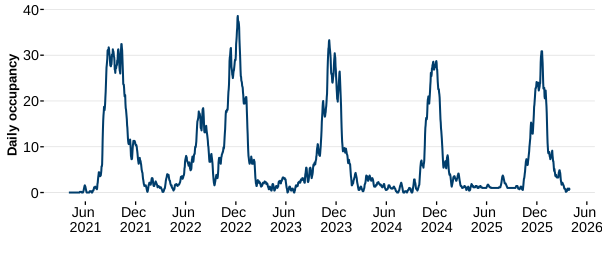
Description of Figure 12: a line chart of RSV-related bed occupancy among children aged 0 to 4 years.
Source: Digital Health and Care Wales (DHCW).
Figure 13: Daily paediatric RSV occupancy (ages 0 to 4 years) scenarios, between September 2026 and March 2027
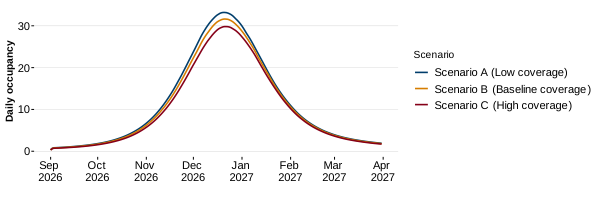
Description of Figure 13: A line chart representing projected scenarios for RSV occupancy among children aged 0 to 4 years.
Source: SRE calculations using PEDW data provided by DHCW
RSV admissions in older adults (ages 75 years and above)
During the 2025 to 2026 winter season, there were a total of 180 RSV admissions among adults aged 75 years and above with the daily admissions peaking at 3 admissions on 15 January 2026.
The total admissions numbers in ages 75 years or older decreased by 21% compared to the 2024/25 season.
Care should be taken with interpretation of RSV admissions modelling in 75 to 79 year olds due to low numbers. (Figure 14)
Scenario A with low vaccine coverage estimates a peak of 2 daily admissions for (75+ year olds) on 31 December 2026.
Scenario B with baseline vaccine coverage estimates a peak of 1.8 admissions on 2 January 2027.
Scenario C with high vaccine coverage estimates a peak of 1.5 admissions 2 January 2027. (Figure 15)
Figure 14: 7 day rolling average of daily RSV admissions in older adults (ages 75 years and above), between April 2021 and March 2026
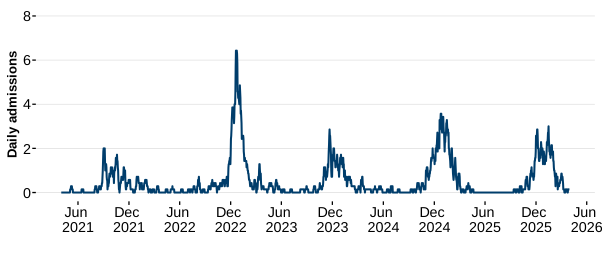
Description of Figure 14: a line chart of RSV-related bed admissions among older adults aged 75 years and above in Wales.
Source: Digital Health and Care Wales (DHCW).
Figure 15: Daily RSV admissions scenarios in older adults (ages 75 years and above), between September 2026 and March 2027
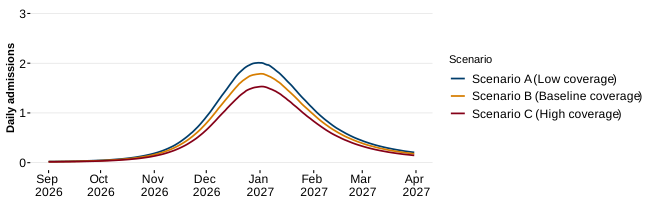
Description of Figure 15: A line chart representing three projected scenarios for RSV admissions among older adults aged 75 years and above.
Source: SRE calculations using PEDW data provided by DHCW
with baseline vaccine coverage estimates a peak occupancy of 27 beds on 8 January 2027. Scenario C with high vaccine coverage estimates a peak occupancy of 23 beds on 9 January 2027. (See Figure 17)
RSV bed occupancy in older adults (ages 75 years and above)
Bed occupancy due to RSV in older adults aged 75 years and above peaked at 35 beds per day on 26 and 27 January 2026, lower than the previous year’s peak of 56 beds per day between 23 January to 25 January 2025. (See Figure 16)
Scenario A with low vaccine coverage estimates a peak occupancy of 31 beds for those aged 75 years and above on 8 January 2027.
Scenario B with baseline vaccine coverage estimates a peak occupancy of 27 beds on 8 January 2027.
Scenario C with high vaccine coverage estimates a peak occupancy of 23 beds on 9 January 2027. (See Figure 17)
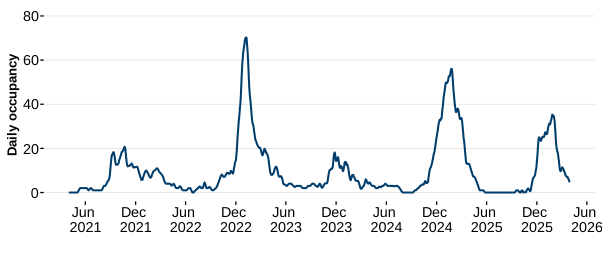
Description of Figure 16: a line chart of RSV-related bed occupancy among older adults aged 75 years and above.
Source: Digital Health and Care Wales (DHCW).
Figure 17: Daily RSV occupancy scenarios in older adults (ages 75 years and above), between September 2026 and March 2027
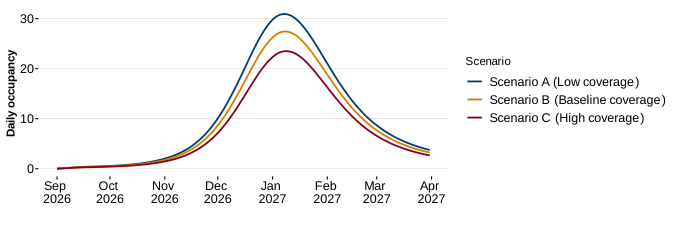
Description of Figure 17: A line chart representing projected scenarios for RSV occupancy among older adults aged 75 years and above.
Source: SRE calculations using PEDW data provided by DHCW
COVID-19
COVID-19 Admissions
In May 2023, the World Health Organization (WHO) announced that COVID-19 is no longer classified as a global health emergency.
However, the WHO also emphasised that the risk of virus evolution remains, with new variants emerging.
In recent years, Covid-19 admission cases have declined to low levels.
COVID-19 admissions during winter have been at their lowest levels since the pandemic.
In Wales, admissions due to COVID-19 showed a decreasing trend, totalling:
- 1,551 in the winter of 2025 to 2026
- 2,314 in winter 2024 to 2025
Daily admissions peaked at 24 in the first week of October 2025, after which the admissions continued to decline. (See Figure 18)
All three scenarios peak on 3 October, with:
- Scenario C (Repeat of 2023 to 2024) projecting 40 admissions
- Scenario B (Repeat of Winter 2025 to 2026) projecting 24 admissions
- Scenario A (SARIMA) projecting 13 admissions
(See Figure 19)
Figure 18: 7-day rolling average of daily COVID-19 admissions, between March 2020 and March 2026
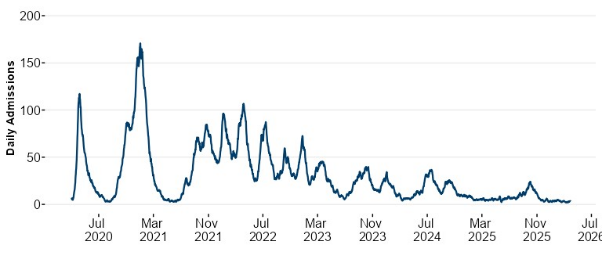
Description of Figure 18: A line chart of COVID-19 related admissions showing a declining wave pattern; a very large initial peak in spring 2020, a large peak in early 2021, followed by progressively smaller and more frequent peaks each subsequent winter, falling consistently to the 2025 to 2026 winter.
Source: Digital Health and Care Wales (DHCW).
Figure 19: daily COVID-19 admissions scenarios – winter 2026 to 2027
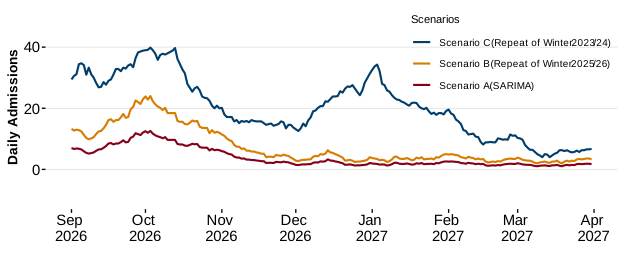
Description of Figure 19: A line chart representing three projected daily COVID-19 admissions scenarios for Winter 2026 to 2027.
Source: SRE calculations using PEDW data provided by DHCW
COVID-19 Occupancy
COVID-19 occupancy during the 2025 to 2026 winter was at the lowest levels since the pandemic began.
In Wales, occupancy due to COVID-19 showed a similar decreasing trend to admissions, totalling:
- 264 occupied bed-days in the winter of 2025 to 2026
- 348 in the winter 2024 to 2025
Additionally, the daily occupancy peaked at 264 (occupied beds) on 09 October 2025, after which occupancy continued to show a decreasing trend. (See Figure 20).
The COVID-19 modelling covers a wide range of bed occupancy scenarios.
- Scenario C (Repeat of Winter 2023 to 2024) estimates a maximum occupancy of 543 beds required on 13 October.
- Scenario B (Repeat of Winter 2025 to 2026) projects a peak occupancy of 264 beds on 9th October.
- Scenario A (SARIMA) projects a peak occupancy of 63 beds on 9th October.
(See Figure 21)
Figure 20: 7-day rolling average of daily COVID-19 occupancy, between March 2020 and March 2026
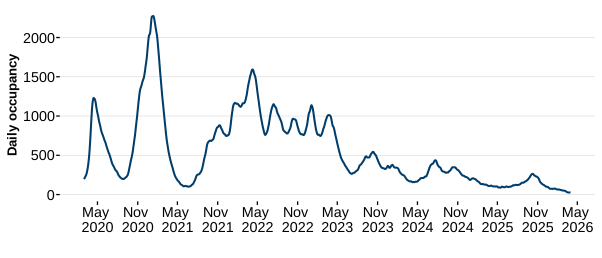
Description of figure 20: a line chart showing the 7-day rolling average of daily COVID-19 occupancy.
Source: Digital Health and Care Wales (DHCW).
Figure 21: daily COVID-19 occupancy scenarios – winter 2026 to 2027
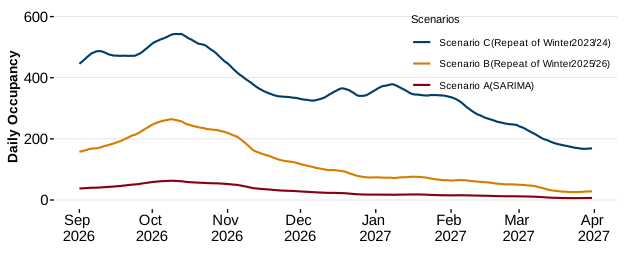
Description of figure 21: A line chart representing three projected daily COVID-19 bed occupancy scenarios for Winter 2026 to 2027
Source: SRE calculations using PEDW data provided by DHCW