
Ystadegau Twristiaeth Ddomestig Prydain Fawr: 2025 (dros dro)
Dyma'r datganiad cyntaf o amcangyfrifon dros dro ar gyfer cyfanswm a gwerth teithiau twristiaeth ddomestig a wneir gan breswylwyr Prydain yng Nghymru a Phrydain Fawr ar gyfer 2025. Saesneg yn unig.
Ar y dudalen hon
Introduction
This report contains estimates for both overnight trips and day trips. The report also includes estimates and details of overnight and day trips taken in Wales, and in Great Britain for comparative purposes. Detailed results for England and Scotland are being published by VisitEngland and VisitScotland.
These statistics are used to monitor domestic tourism demand and measure the contribution and impact of domestic tourism on the visitor economy. A key purpose of these statistics is to uncover insights into market trends over time. Changes in survey methodology mean that results published in this release are not directly comparable with data published for 2019 and previous years. Please refer to the section on comparability and coherence. Changes in expenditure should be considered in light of increased costs, as these estimates have not been adjusted for inflation.
A scripting issue was addressed in late 2025, which impacted the comparability of estimates in this series. To address this, comparability adjustments were applied to the estimates. Please see the section on accuracy for further details. Users should note that these estimates are provisional and remain subject to change.
The statistics are labelled as ‘official statistics in development’ to enable testing and further modification to meet user needs. Further information on this is available on the Office for National Statistics (ONS) website. We are keen to check that the new tourism statistics meet user needs and invite you to provide feedback on the information in this output at tourismresearch@gov.wales.
Main points
Wales overnight trips
- During the period January to December 2025, Great Britain (GB) residents took 7.76 million overnight trips in Wales with 23.48 million nights and £2.30 billion spent during these trips.
- Compared to 2024, the volume of overnight trips taken in Wales was 2% higher, whilst nights were 5% higher, and expenditure was 3% higher.
- Approximately 8% of all GB trips included an overnight stay in Wales. The share of total GB nights was 8%, while the share of total GB expenditure on overnight trips was 7%.
- The average expenditure per trip was £297 for overnight trips.
- The average duration of overnight trips to Wales was 3.0 nights with an average spend of £98 per night.
Wales Tourism Day Visits
- From January to December 2025, GB residents took 59.22 million tourism day trips in Wales, with £2.84 billion spent during these trips.
- Compared to 2024, the volume of day trips taken in Wales was 11% higher, while expenditure on day trips taken in Wales was 18% higher.
- Approximately 6% of tourism day trips taken in GB included a visit in Wales. The share of total GB expenditure on tourism day trips was 5% for Wales.
- The average expenditure for day trips was £48 per trip.
Great Britain overnight trips
- During the period January to December 2025, GB residents took 103.00 million overnight trips in GB with 301.17 million nights and £35.11 billion spent during these trips.
- Compared to 2024, the volume of overnight trips taken in GB decreased by 2%, whilst expenditure increased by 7%, and nights declined by 2%.
- 84% of overnight trips taken in GB during 2025 included an overnight stay in England, 10% included an overnight stay in Scotland and 8% included an overnight stay in Wales.
- The average expenditure per trip was £341 for overnight trips.
- The average duration of overnight GB trips was 2.9 nights with an average spend of £117 per night.
Great Britain Tourism Day Visits
- From January to December 2025, GB residents took 1.06 billion tourism day trips in GB, with £56.00 billion spent during these trips.
- Compared to 2024, the volume of day trips taken in GB was 3% higher, while expenditure on day trips taken in GB was 2% higher.
- 87% of day trips taken in GB during 2025 included a visit in England, 8% included a visit in Scotland, and 6% included a stay in Wales.
- The average expenditure per trip was £53 for day trips.
Trips, nights and spend to GB nations: January to December 2025
| Overnight trips | Great Britain | England | Scotland | Wales |
|---|---|---|---|---|
| Trips (millions) | 103.00 | 86.95 | 10.44 | 7.76 |
| % Great Britain trips | 100% | 84% | 10% | 8% |
| Nights (millions | 301.17 | 247.50 | 30.20 | 23.48 |
| % Great Britain nights | 100% | 82% | 10% | 8% |
| Spend (£ millions) | £35,106 | £28,981 | £3,822 | £2,303 |
| % Great Britain spend | 100% | 83% | 11% | 7% |
Source: Great Britain Tourism Survey: overnight trips, January to December 2025
[Note 1] Percentages do not sum to 100% as some trips included visits to more than one nation.
From January to December 2025, there were 103.00 million overnight trips taken in GB by British residents with a total of 301.17 million nights and a total expenditure of £35.11 billion.
There were 7.76 million overnight trips taken in Wales with a total of 23.48 million nights and a total expenditure of £2.30 billion. 8% of overnight trips included an overnight stay in Wales. The share of total nights in Wales was 8%, and the share of total expenditure was 7%.
| Overnight trips | January to December 2024 | January to December 2025 | Percentage change |
|---|---|---|---|
| Trips (millions) | 7.61 | 7.76 | 2% |
| Nights (millions) | 22.30 | 23.48 | 5% |
| Spend (£ millions) | £2,244 | £2,303 | 3% |
Source: Great Britain Tourism Survey: overnight trips, January to December 2024 and January to December 2025
In 2025, there was an increase of 2% in the volume of overnight trips to Wales, compared 2024. Expenditure on overnight trips taken in Wales in 2025 was 3% higher, while nights were 5% higher.
| Overnight trips | January to December 2024 | January to December 2025 | Percentage change |
|---|---|---|---|
| Trips (millions) | 105.61 | 103.00 | -2% |
| Nights (millions) | 307.54 | 301.17 | -2% |
| Spend (£ millions) | £32,916 | £35,106 | 7% |
Source: Great Britain Tourism Survey: overnight trips, January to December 2024 and January to December 2025
Compared to 2024, the volume of overnight trips taken in GB during 2025 decreased by 2%. Expenditure was 7% higher, while nights were 2% lower.
| Tourism day trips | Great Britain | England | Scotland | Wales |
|---|---|---|---|---|
| Trips (millions) | 1061.15 | 927.50 | 83.85 | 59.22 |
| % Great Britain trips | 100% | 87% | 8% | 6% |
| Spend (£ millions) | £55,997 | £48,807 | £4,347 | £2,844 |
| % Great Britain spend | 100% | 87% | 8% | 5% |
Source: Great Britain Tourism Survey: day trips, January to December 2025
[Note 1] Percentages do not sum to 100% as some day trips included visits to more than one nation.
There were 1.06 billion tourism day trips taken in GB by British residents from January to December 2025, with a total expenditure of £56.00 billion. During the same period there were 59.22 million tourism day trips taken in Wales with a spend of £2.84 billion. 6% of tourism day trips taken during 2025 included a visit to Wales. The share of total spend in Wales was 5%.
| Tourism day trips | January to December 2024 | January to December 2025 | Percentage change |
|---|---|---|---|
| Trips (millions) | 53.25 | 59.22 | 11% |
| Spend (£ millions) | £2,412 | £2,844 | 18% |
Source: Great Britain Tourism Survey: day trips, January to December 2024 and January to December 2025
During 2025, the volume of tourism day trips taken to Wales was 11% higher than during 2024. Expenditure was 18% higher compared to 2024.
| Tourism day trips | January to December 2024 | January to December 2025 | Percentage change |
|---|---|---|---|
| Trips (millions) | 1028.46 | 1061.15 | 3% |
| Spend (£ millions) | £54,842 | £55,997 | 2% |
Source: Great Britain Tourism Survey: day trips, January to December 2024 and January to December 2025
The volume of tourism day trips taken in GB during 2025 was 3% higher, compared to 2024. Expenditure was 2% higher compared to 2024.
Purpose of visit: January to December 2025
Compared to 2024, the volume of overnight trips taken in Wales in 2025 has increased by 2%.
This increase in volume was driven primarily by holiday trips taken to Wales, which increased by 20% compared to the previous year. Similarly, there was a 23% increase in nights spent on holidays in Wales in 2025, and expenditure on holiday trips increased by 13%.
Miscellaneous/other trips saw smaller increases in volume and nights (4% and 5%) but experienced a similar increase in expenditure to holiday trips (12%).
Both trips to visit friends and relatives and business trips saw declines in 2025, although findings relating to business trips to Wales should be treated with caution, due to low base sizes.
| Trip purpose | 2024 | 2025 | % change |
|---|---|---|---|
| All purposes | 7.61 | 7.76 | 2% |
| Holiday | 2.88 | 3.44 | 20% |
| VFR | 2.57 | 2.16 | -16% |
| Business | 0.51 | 0.42 | -18% |
| Miscellaneous/other | 1.66 | 1.73 | 4% |
Source: Great Britain Tourism Survey: overnight trips, January to December 2024 and January to December 2025
[Note 1] Low base sizes for business trips to Wales – data should be treated with caution.
| Trip purpose | 2024 | 2025 | % change |
|---|---|---|---|
| All purposes | 22.30 | 23.48 | 5% |
| Holiday | 10.39 | 12.80 | 23% |
| VFR | 7.05 | 5.98 | -15% |
| Business | 1.33 | 0.99 | -26% |
| Miscellaneous/other | 3.53 | 3.71 | 5% |
Source: Great Britain Tourism Survey: overnight trips, January to December 2024 and January to December 2025
[Note 1] Low base sizes for business trips to Wales – data should be treated with caution.
| Trip purpose | 2024 | 2025 | % change |
|---|---|---|---|
| All purposes | £2,244 | £2,303 | 3% |
| Holiday | £963 | £1,089 | 13% |
| VFR | £492 | £425 | -14% |
| Business | £226 | £161 | -29% |
| Miscellaneous/other | £564 | £629 | 12% |
Source: Great Britain Tourism Survey: overnight trips, January to December 2024 and January to December 2025
[Note 1] Low base sizes for business trips to Wales – data should be treated with caution.
Figure 1: proportion of trips, nights and spend in Wales by main purpose of trip, January to December 2025
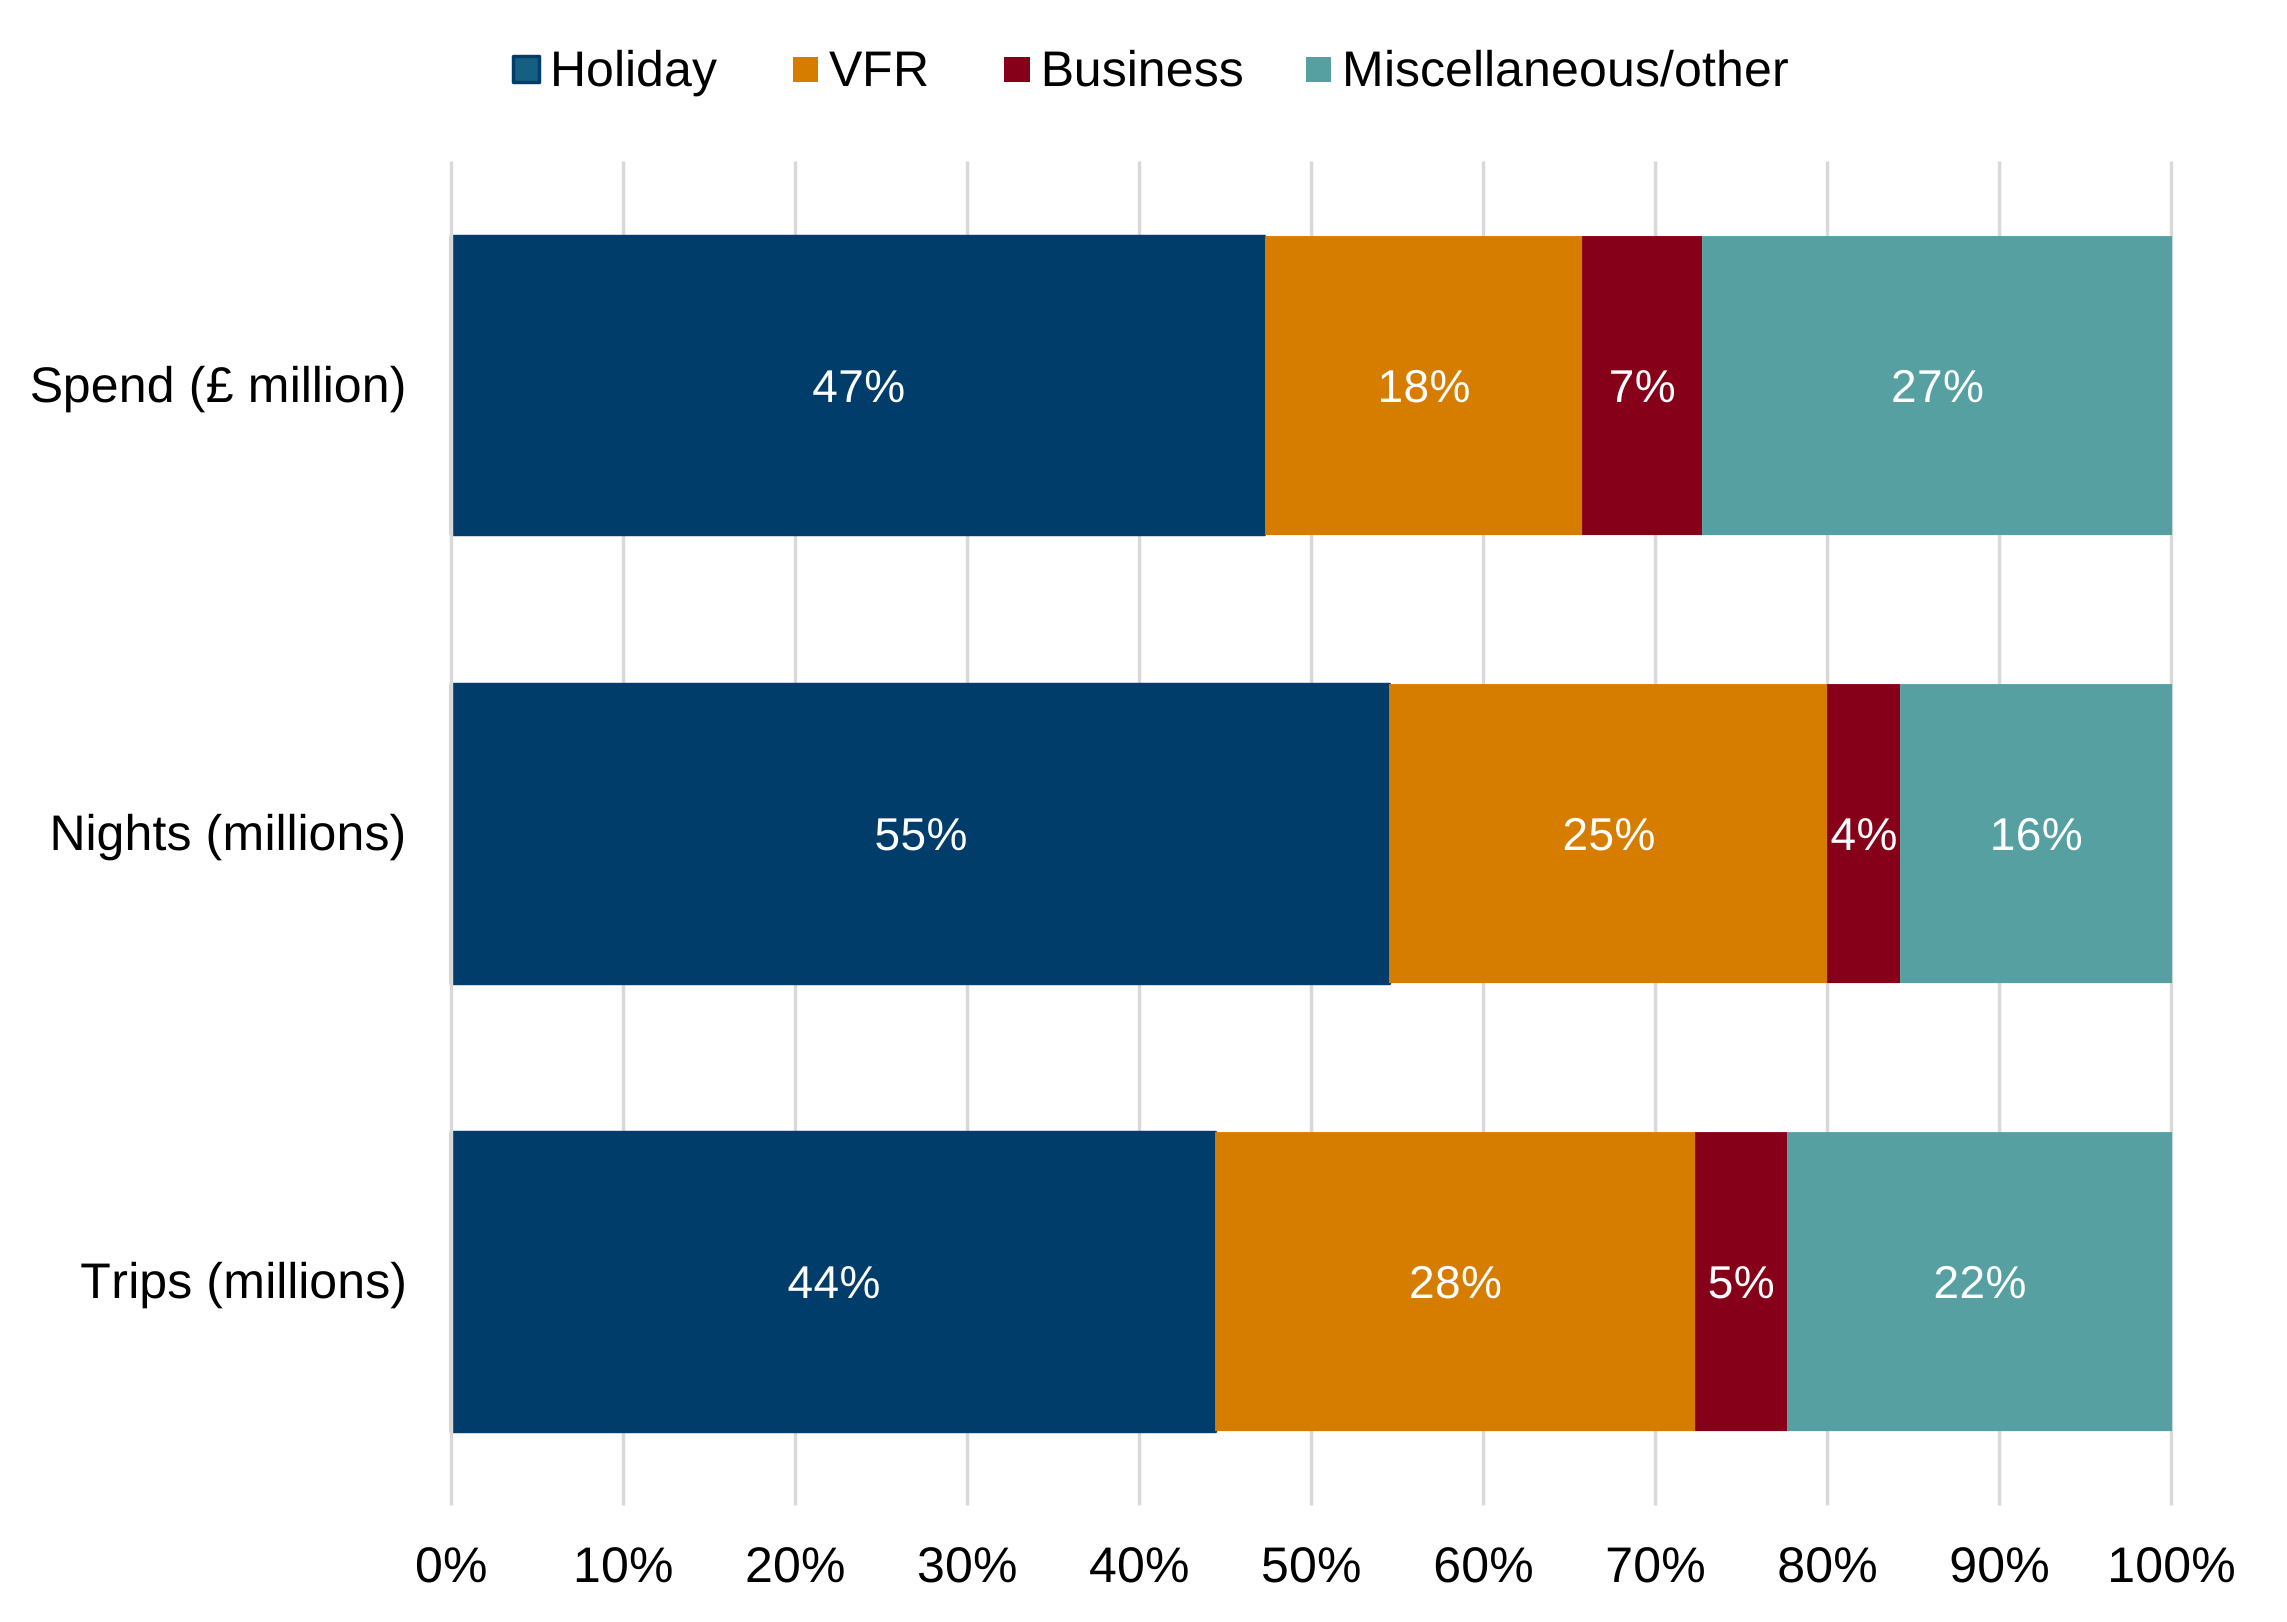
Description of figure 1: a stacked bar chart showing that in 2025, holidays were the most common type of trip taken to Wales by GB residents, followed by visits to friends and relatives.
Source: Great Britain Tourism Survey: overnight trips, January to December 2025
Holiday trips remained the most common type of trip taken in Wales in 2025, making up 44% of trips, higher than in 2024 (38%). Visits to friends and relatives and trips for other/miscellaneous purposes made up 28% and 22% of trips respectively. This represents a decline in the proportion of people visiting friends and relatives (34% in 2024) and stability in trips for other/miscellaneous purposes (22% in 2024). 5% of trips to Wales were business trips, slightly lower than in 2024 (7%).
The volume of overnight trips taken in GB in 2025 was 2% lower, compared to 2024. Trip volumes for GB decreased across all trip types in 2025, except for business trips, compared to the previous year, which was up 7%.
The number of nights spent in GB during 2025 was also 2% lower, compared to 2024. Again, this was seen across all trip types, except business trips, which was up 1%.
Expenditure on trips taken in GB during 2025 increased by 7% compared to expenditure during 2024. Spend increased across all trip types, with business trips seeing the largest increase (23%).
| Trip purpose | 2024 | 2025 | % change |
|---|---|---|---|
| All purposes | 105.61 | 103.00 | -2% |
| Holiday | 32.47 | 32.06 | -1% |
| VFR | 39.33 | 37.01 | -6% |
| Business | 5.89 | 6.28 | 7% |
| Miscellaneous/other | 27.92 | 27.66 | -1% |
Source: Great Britain Tourism Survey: overnight trips, January to December 2024 and January to December 2025
| Trip purpose | 2024 | 2025 | % change |
|---|---|---|---|
| All purposes | 307.54 | 301.17 | -2% |
| Holiday | 115.80 | 112.66 | -3% |
| VFR | 110.41 | 107.53 | -3% |
| Business | 16.03 | 16.26 | 1% |
| Miscellaneous/other | 65.30 | 64.72 | -1% |
Source: Great Britain Tourism Survey: overnight trips, January to December 2024 and January to December 2025
| Trip purpose | 2024 | 2025 | % change |
|---|---|---|---|
| All purposes | £32,916 | £35,106 | 7% |
| Holiday | £12,008 | £12,395 | 3% |
| VFR | £8,194 | £8,565 | 5% |
| Business | £3,069 | £3,778 | 23% |
| Miscellaneous/other | £9,646 | £10,367 | 7% |
Source: Great Britain Tourism Survey: overnight trips, January to December 2024 and January to December 2025
Characteristics of GB and Wales trips: January to December 2025
In 2025, the average spend for both overnight trips and day trips was higher for trips taken across GB as a whole, compared to trips taken in Wales.
The average spend per trip for overnight trips in Wales was 1% higher compared to 2024, whereas for overnight trips taken in GB, it was 9% higher.
Average spend per trip for tourism day visits in 2025 was 6% higher compared to 2024 for Wales, while for GB it was 1% lower.
| Measure | 2024 | 2025 | Percentage change |
|---|---|---|---|
| Overnight trips | £295 | £297 | 1% |
| Tourism day trips | £45 | £48 | 6% |
Source: Great Britain Tourism Survey: overnight and day trips, January to December 2024 and January to December 2025
| Measure | 2024 | 2025 | Percentage change |
|---|---|---|---|
| Overnight trips | £312 | £341 | 9% |
| Tourism day trips | £53 | £53 | -1% |
Source: Great Britain Tourism Survey: overnight and day trips, January to December 2024 and January to December 2025
In 2025, average expenditure per night was higher for trips taken across GB, compared to trips taken in Wales. The average spend per night was 3% lower for trips taken in Wales compared 2024, whereas it was 9% higher for trips taken across GB as a whole.
The average duration of trips taken in Wales was 3.0 nights, slightly higher than the average for GB, at 2.9 The average length of overnight trips taken in Wales was 3% higher compared to 2024, while the average length of trips taken in GB remained stable.
| Measure | 2024 | 2025 | Percentage change |
|---|---|---|---|
| Average spend per night | £101 | £98 | -3% |
| Average nights per trip | 2.9 | 3.0 | 3% |
Source: Great Britain Tourism Survey: overnight trips, January to December 2024 and January to December 2025
| Measure | 2024 | 2025 | Percentage change |
|---|---|---|---|
| Average spend per night | £107 | £117 | 9% |
| Average nights per trip | 2.9 | 2.9 | 0% |
Source: Great Britain Tourism Survey: overnight trips, January to December 2024 and January to December 2025
In 2025, the most commonly used main type of accommodation on trips in Wales was serviced accommodation, at 43% of trips. 20% used a private home (including the home of friends/relatives or a second home), and caravan/camping/glamping and self-catering property rentals made up 16% of overnight trips to Wales each.
| Accommodation type | 2024 | 2025 | % change |
|---|---|---|---|
| Serviced | 2.82 | 3.32 | 18% |
| Private home | 1.85 | 1.56 | -16% |
| Camping/caravan/glamping | 1.36 | 1.24 | -9% |
| Self-catered | 1.23 | 1.21 | -2% |
| Other | 0.36 | 0.43 | 19% |
Source: Great Britain Tourism Survey: overnight trips, January to December 2024 and January to December 2025
| Accommodation type | 2024 | 2025 | % change |
|---|---|---|---|
| Serviced | 46.98 | 50.49 | 7% |
| Private home | 31.57 | 28.68 | -9% |
| Camping/caravan/glamping | 10.41 | 8.50 | -18% |
| Self-catered | 12.07 | 10.99 | -9% |
| Other | 4.57 | 4.35 | -5% |
Source: Great Britain Tourism Survey: overnight trips, January to December 2024 and January to December 2025
The distribution of trips across types of accommodation remained largely stable across 2024 and 2025, although there was an increase in the proportion of serviced accommodation (from 37% in 2024) and a decrease in the proportion of private homes (from 24% in 2024).
Figure 2: proportion of trips taken in Great Britain and Wales by main type of accommodation used, January to December 2025
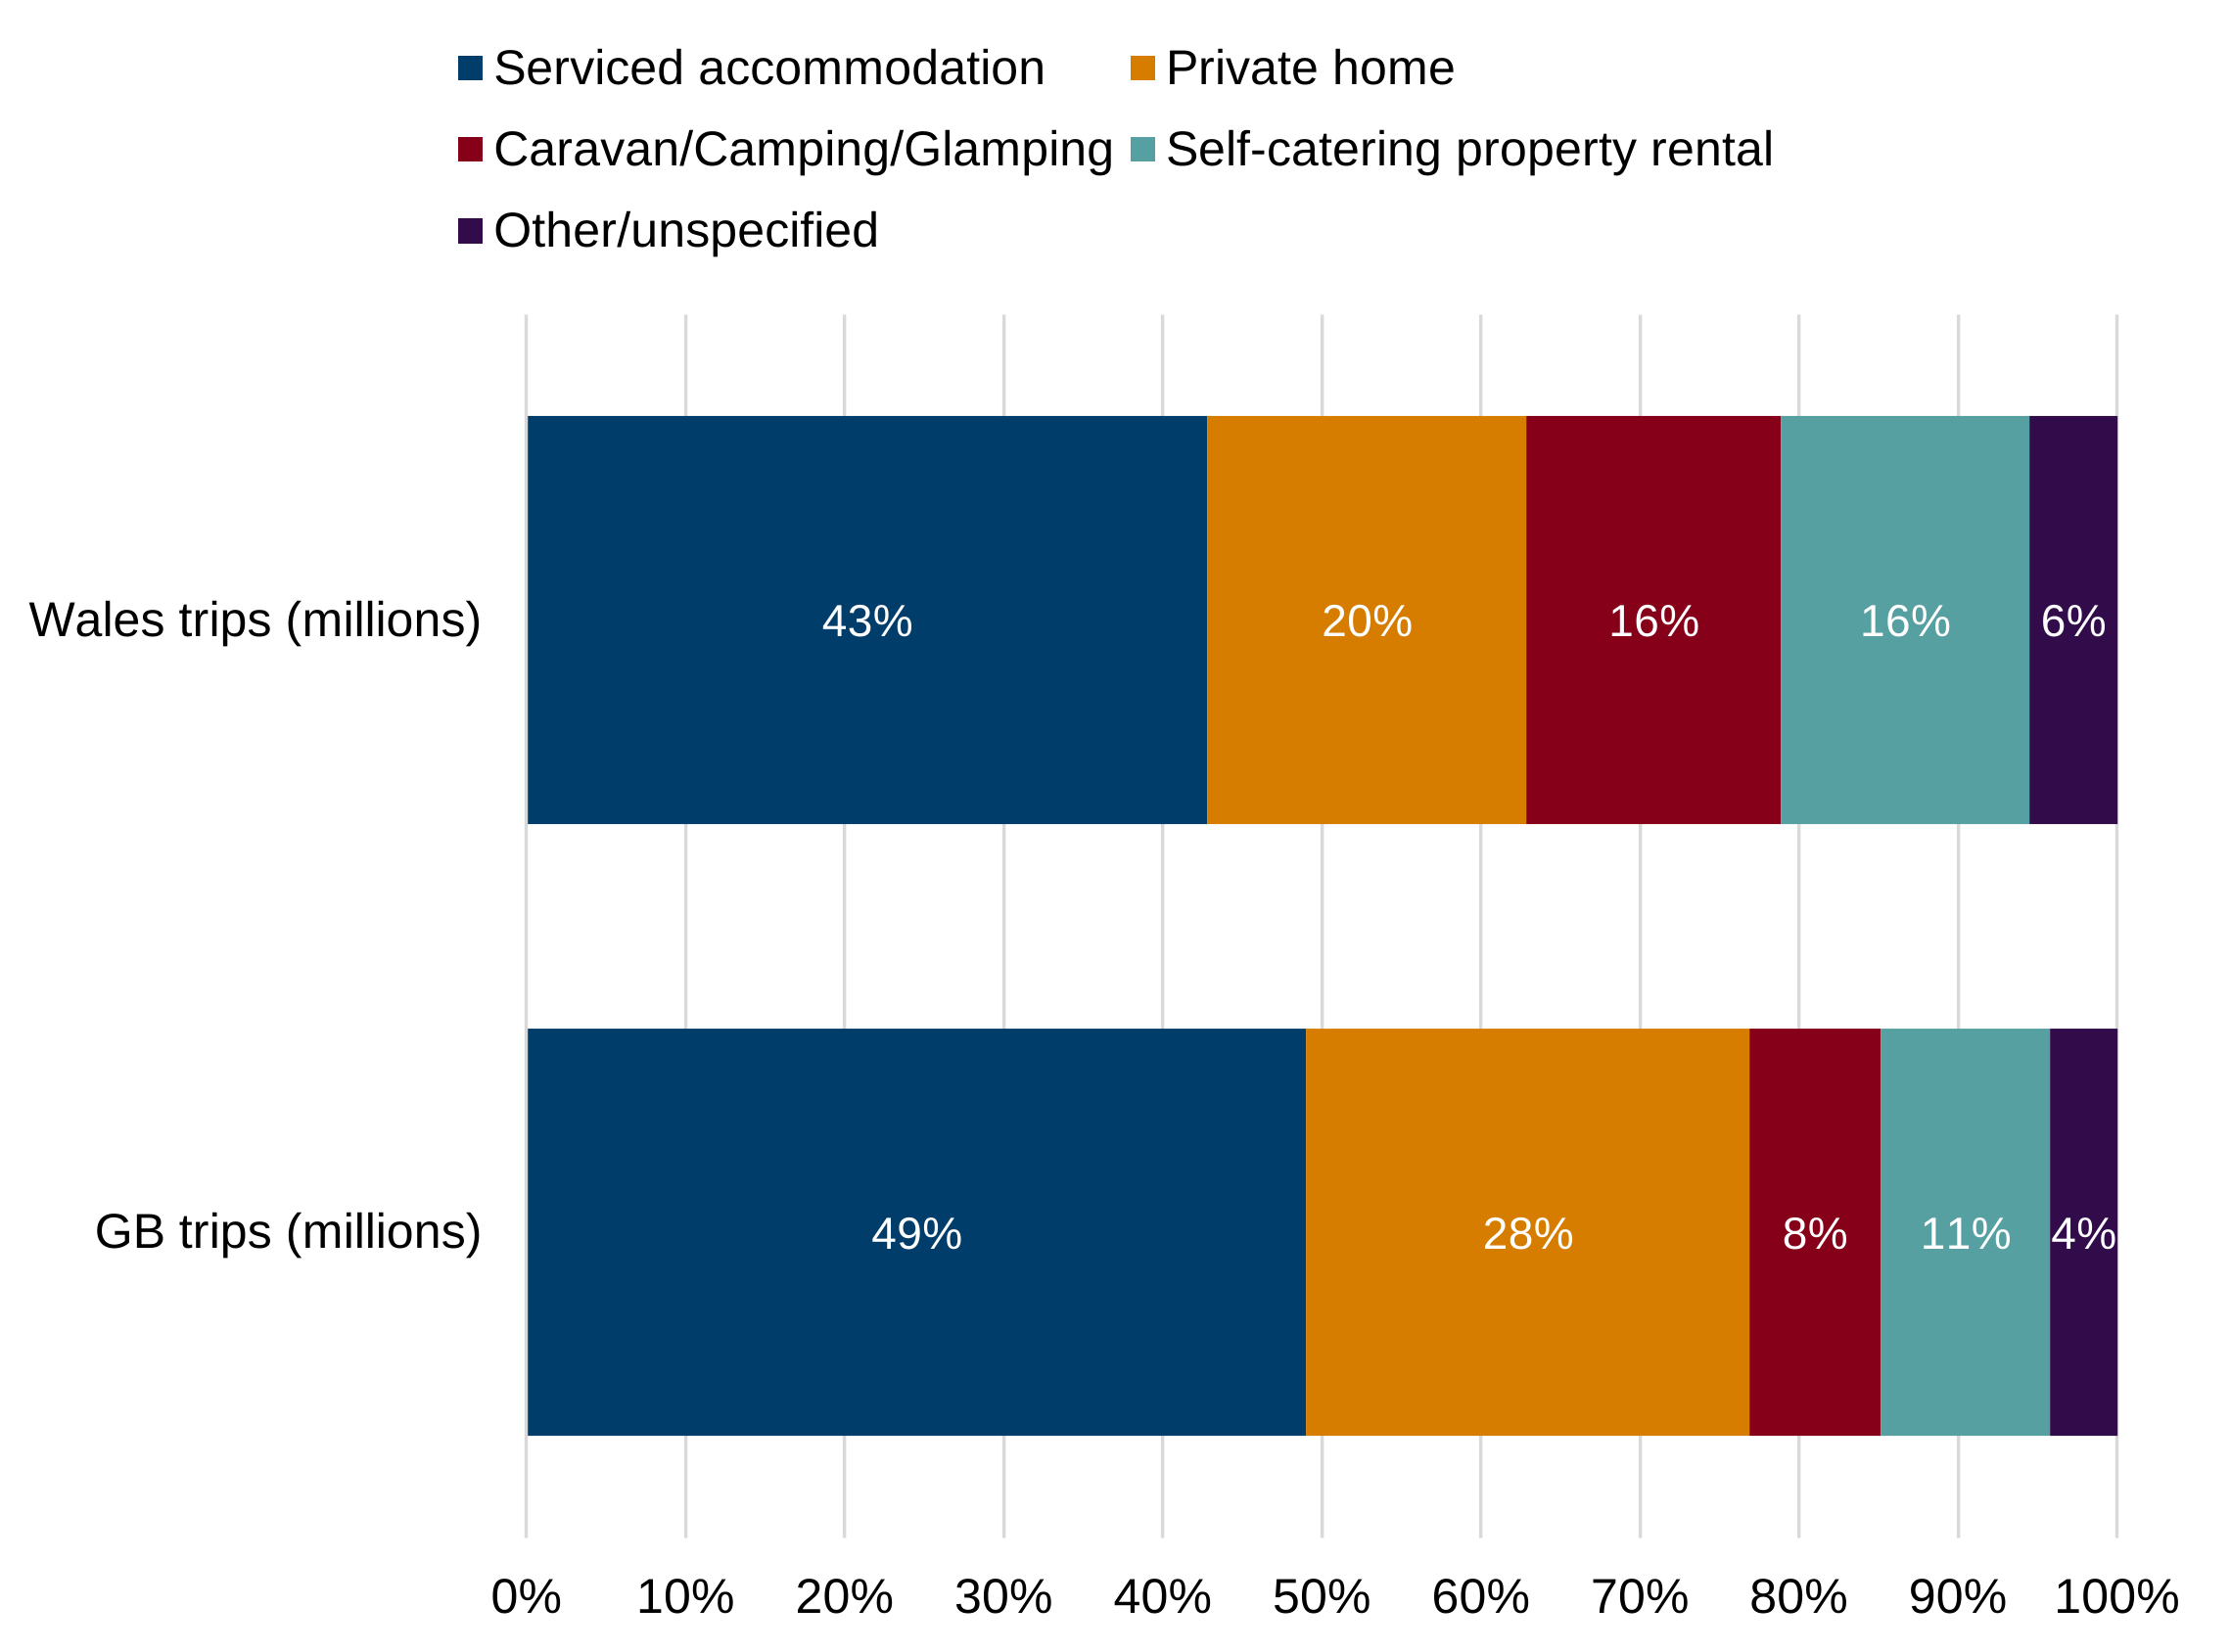
Description of figure 2: a stacked bar chart showing that in 2025, serviced accommodation was the most commonly used type of accommodation for GB residents taking overnight trips in GB and in Wales.
Source: Great Britain Tourism Survey: overnight trips, January to December 2025
Profile of visitors taking trips to Wales: January to December 2025
The profile of trips taken to Wales by nation of residence has remained consistent with previous years.
In 2025, GB residents living outside of Wales generated just over 7 in 10 of all overnight trips taken in Wales, with residents of England generating the most trips and expenditure. Residents of Wales generated just under 3 in 10 trips taken in Wales.
| Nation of residence | Trips (millions) | Spend (£ millions) | % of Wales trips |
|---|---|---|---|
| England | 5.37 | £1,717 | 69% |
| Scotland | 0.26 | £100 | 3% |
| Wales | 2.13 | £486 | 27% |
Source: Great Britain Tourism Survey: overnight trips, January to December 2025
[Note 1] Low base size for Scotland, data should be treated with caution.
| Nation of residence | Trips (millions) | Spend (£ millions) | % of Wales trips |
|---|---|---|---|
| England | 24.69 | £1,391 | 42% |
| Scotland | 0.65 | £30 | 1% |
| Wales | 33.89 | £1,423 | 57% |
Source: Great Britain Tourism Survey: day trips, January to December 2025
[Note 1] Low base size for Scotland, data should be treated with caution.
The distribution of day trips taken to Wales by nation of residence also remained broadly stable in 2025.
Residents of Wales generated just under 6 in 10 of all tourism day trips taken in Wales, with most of the remaining trips generated by residents of England. There was a slight increase in the proportion of England residents (from 39% in 2024 to 42% in 2025), and a slight decrease in the proportion of Wales residents (from 60% in 2024 to 57% in 2025).
Activities undertaken on day trips: January to December 2025
| Main activity undertaken | Great Britain trips | Wales trips |
|---|---|---|
| Visited friends or relatives | 317.56 | 15.60 |
| Went to a visitor attraction | 173.86 | 8.64 |
| Went sightseeing and exploring areas | 83.48 | 8.45 |
| Food and drink, a night out or speciality shopping | 129.51 | 7.14 |
| Attended an organised public event | 89.92 | 4.89 |
| Took part in sports or outdoor leisure activities | 68.77 | 4.75 |
| Attended a special event or celebration | 73.69 | 3.12 |
| Took part in hobbies and interests | 58.54 | 2.85 |
| Went to an arts, cultural or entertainment experiences | 31.05 | 1.19 |
| Took part in a health or wellbeing experience | 9.67 | 0.76 |
| Took part in leisure activities not mentioned above | 25.10 | 1.83 |
Source: Great Britain Tourism Survey: day trips, January to December 2025
[Note 1] Low base sizes for 'Took part in a health or wellbeing experience', 'Went to an arts, cultural or entertainment experience', and 'Took part in leisure activities not mentioned above' - data should be treated with caution.
Figure 3: proportion of tourism day trips in Great Britain and Wales by main activity undertaken, January to December 2025
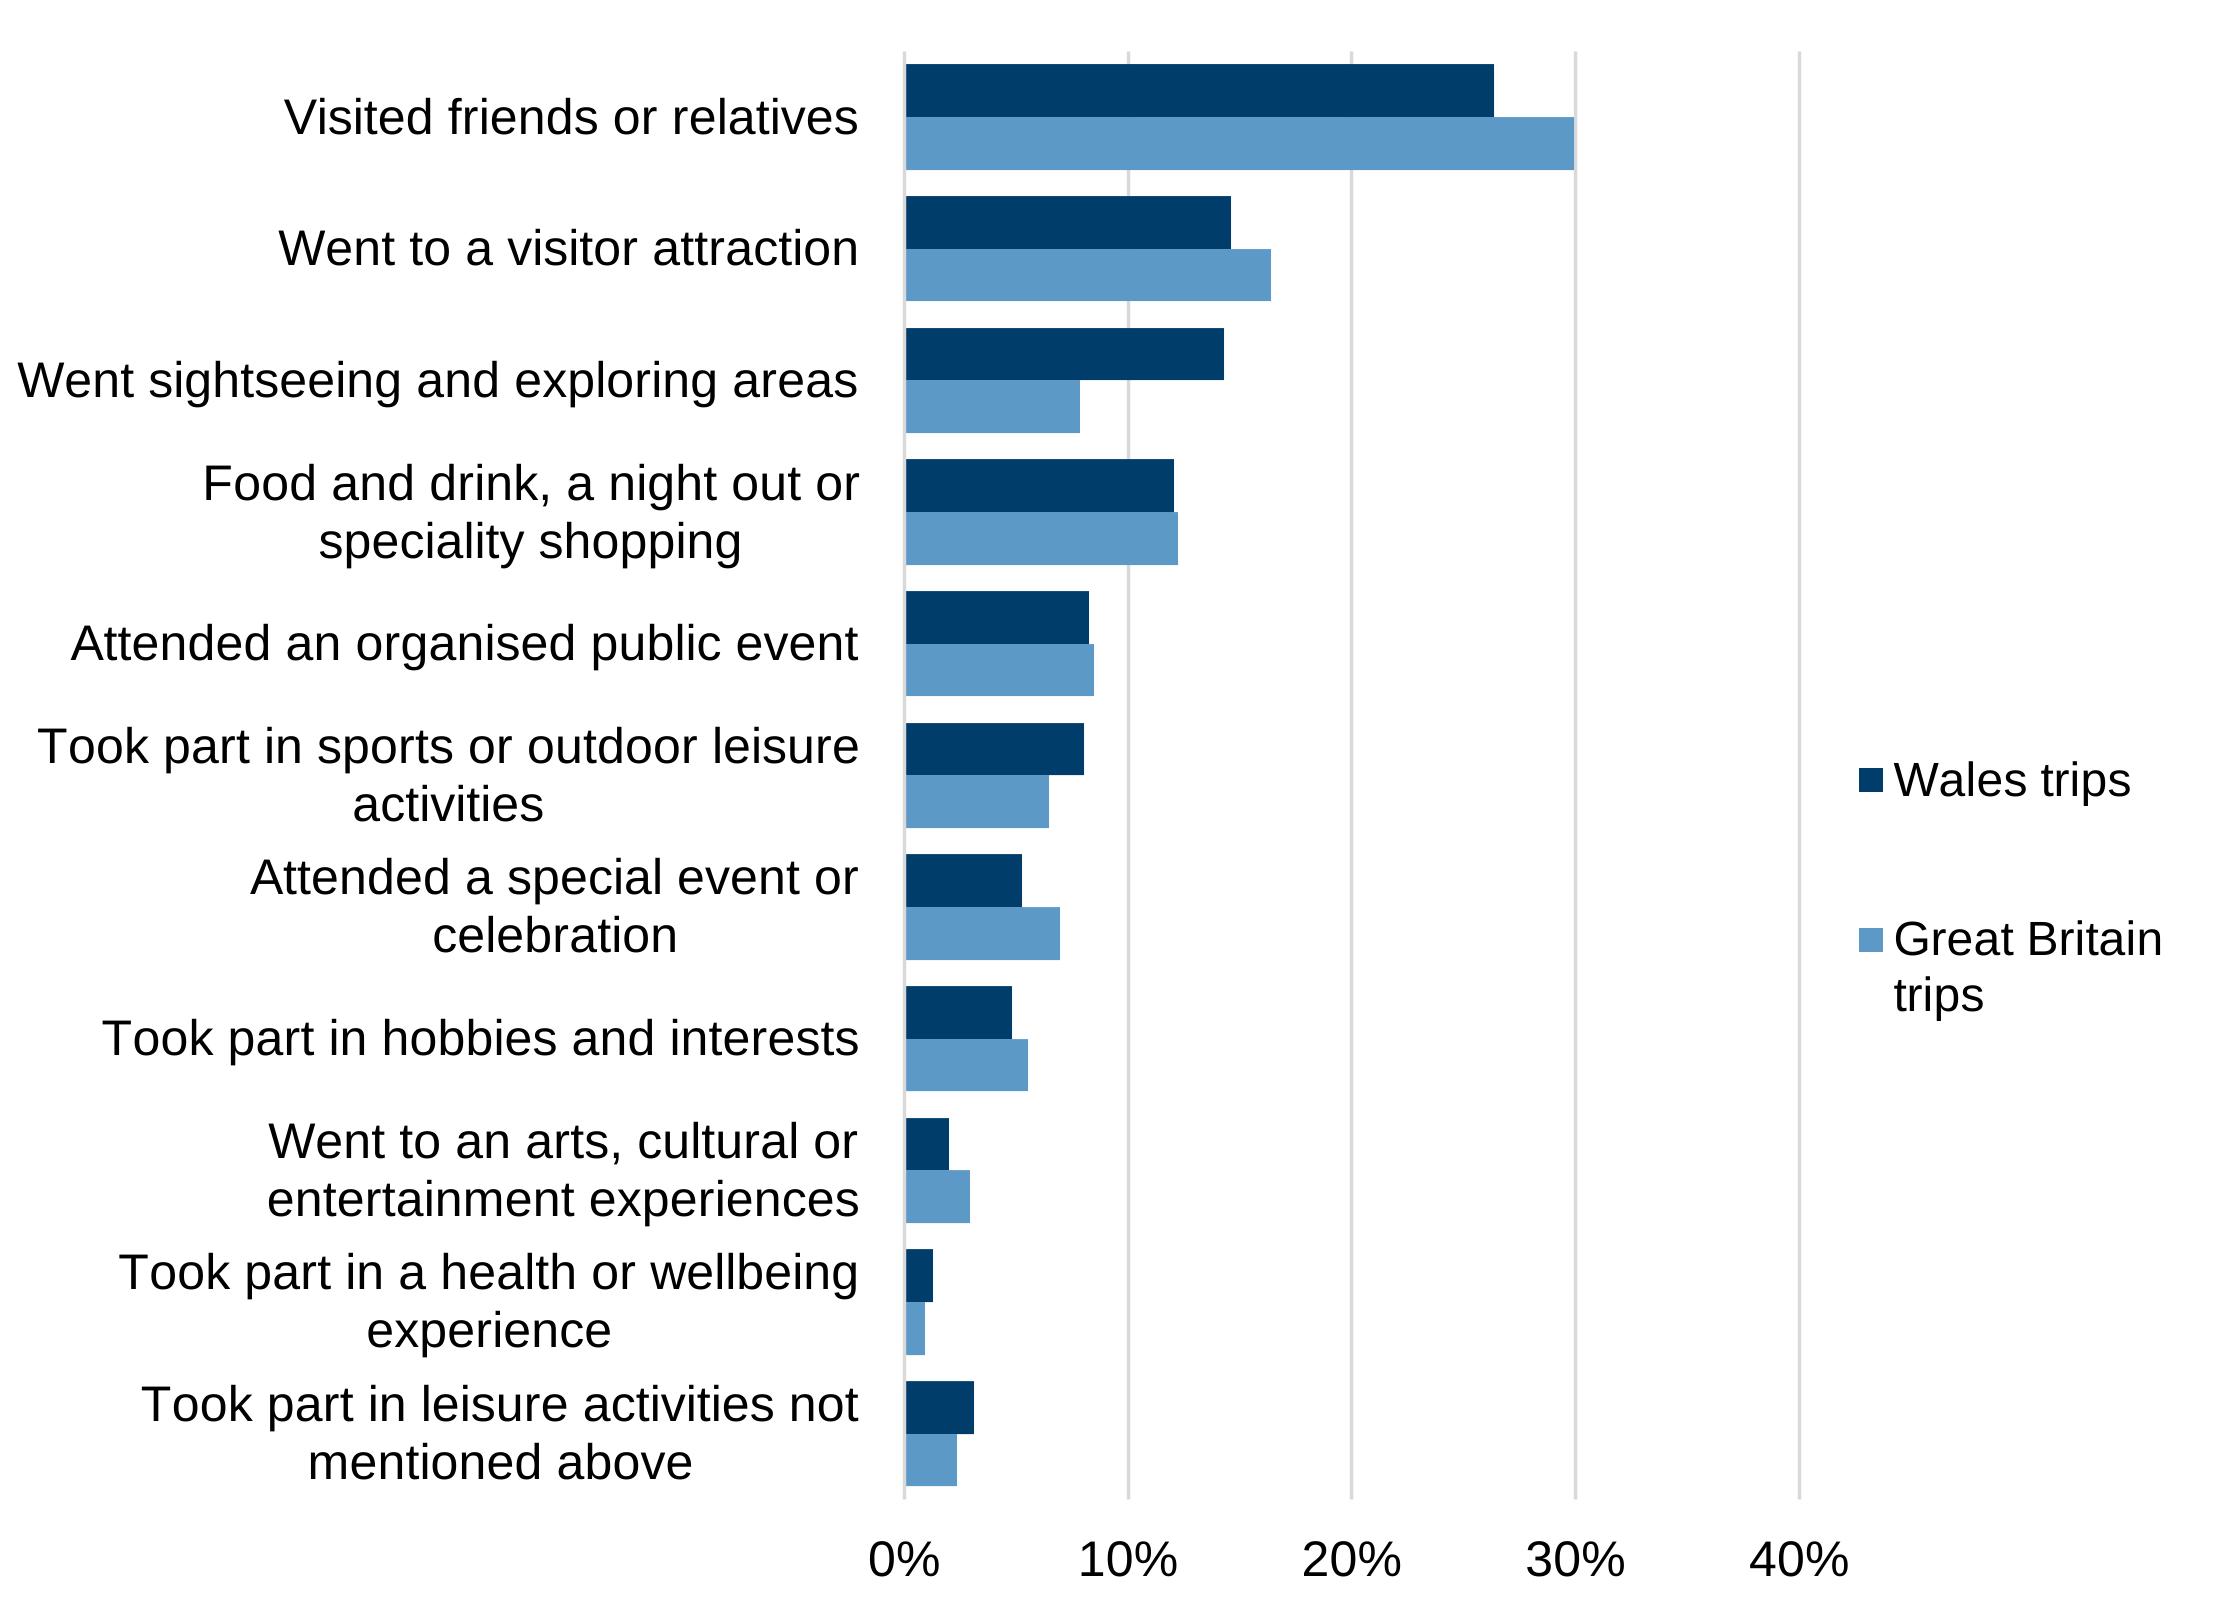
Description of figure 3: a clustered bar chart showing that, in 2025, visiting friends or relatives was the most frequent main activity undertaken on tourism day trips in GB and Wales.
Source: Great Britain Tourism Survey: day trips, January to December 2025
In 2025, visits to friends and relatives was the most popular main activity undertaken on tourism day trips, both in Wales and in GB, at 26% and 30% respectively.
The second most popular activity in 2025 was going to a visitor attraction, which was the main activity undertaken on 15% of day trips in Wales and 16% of day trips in GB.
Going sightseeing and exploring areas was the next most popular activity in Wales, at 14%. For day trips taken across GB as a whole, food and drink, a night out or speciality shopping was the third most popular activity undertaken at 12%.
In Wales, there were notable increases in the numbers of day trips taken to visit friends or relatives, to sightsee and explore, and to attend organised public events, compared to 2024.
For trips taken across GB, there were also notable increases in the numbers of trips taken to visit friends and relatives and to go sightseeing and exploring. Across both Wales and GB, there was a decrease in the number of day trips for hobbies and interests, compared to the previous year.
For both Wales and GB, the distribution of day trips across main activities undertaken has remained largely stable in 2025, compared to 2024. However, Wales did see a small increase in the proportion of day trips to go exploring and sightseeing, from 11% to 14%.
Trips, nights and spend to GB nations: October to December 2025
Note for users
A scripting issue that was resolved in late 2025 impacted the comparability of the series. Although comparability adjustments have been applied to address this, these estimates remain provisional and subject to change. Quarterly estimates are derived from lower bases sizes than annual estimates and are therefore less robust. Users are advised to note that these estimates are provisional and remain subject to change.
| Overnight trips | Great Britain | England | Scotland | Wales |
|---|---|---|---|---|
| Trips (millions) | 26.67 | 22.55 | 2.69 | 2.02 |
| % Great Britain trips | 100% | 85% | 10% | 8% |
| Nights (millions | 73.94 | 60.73 | 7.49 | 5.72 |
| % Great Britain nights | 100% | 82% | 10% | 8% |
| Spend (£ millions) | £8,698 | £7,037 | £1,037 | £624 |
| % Great Britain spend | 100% | 81% | 12% | 7% |
Source: Great Britain Tourism Survey: overnight trips, October to December 2025
[Note 1] Percentages do not sum to 100% as some trips included visits to more than one nation.
From October to December 2025, there were 26.67 million overnight trips taken in GB by British residents with a total of 73.94 million nights and a total expenditure of £8.70 billion.
There were 2.02 million overnight trips taken in Wales with a total of 5.72 million nights and a total expenditure of £624 million. 8% of overnight trips included an overnight stay in Wales. The share of total nights in Wales was 8%, and the share of total expenditure was 7%.
| Tourism day trips | Great Britain | England | Scotland | Wales |
|---|---|---|---|---|
| Trips (millions) | 259.22 | 226.39 | 20.06 | 15.50 |
| % Great Britain trips | 100% | 87% | 8% | 6% |
| Spend (£ millions) | £15,244 | £13,065 | £1,262 | £917 |
| % Great Britain spend | 100% | 86% | 8% | 6% |
Source: Great Britain Tourism Survey: day trips, October to December 2025
[Note 1] Percentages do not sum to 100% as some day trips included visits to more than one nation.
There were 259.22 million tourism day trips taken in GB by British residents from October to December 2025, with a total expenditure of £15.24 billion.
During the same period there were 15.50 million tourism day trips taken in Wales with a spend of £917 million. 6% of tourism day trips taken during the last quarter of 2025 included a visit to Wales. The share of total spend in Wales was 6%.
Characteristics of GB and Wales trips: October to December 2025
For the last quarter of 2025, the average expenditure on overnight trips in Wales was £309 per trip for overnight trips, and £59 for day trips.
For trips taken across GB as a whole, average spend per trip for overnight trips was higher, at £326 per trip. For day trips taken in Wales, average spend per trip was in line with the GB average.
| Measure | October to December 2025 |
|---|---|
| Overnight trips | £309 |
| Tourism day trips | £59 |
Source: Great Britain Tourism Survey: overnight and day trips, October to December 2025
| Measure | October to December 2025 |
|---|---|
| Overnight trips | £326 |
| Tourism day trips | £59 |
Source: Great Britain Tourism Survey: overnight and day trips, October to December 2025
For the last quarter of 2025, the average spend per night on overnight trips taken in Wales was £109. This was lower than the average spend per night for overnight trips taken across GB as a whole, at £118. The average duration of overnight trips taken in Wales was 2.8 nights, in line with the GB average.
| Measure | October to December 2025 |
|---|---|
| Average spend per night | £109 |
| Average nights per trip | 2.8 |
Source: Great Britain Tourism Survey: overnight trips, October to December 2025
| Measure | October to December 2025 |
|---|---|
| Average spend per night | £118 |
| Average nights per trip | 2.8 |
Source: Great Britain Tourism Survey: overnight trips, October to December 2025
Quality and methodology information
Definitions
Criteria for qualifying as an eligible GB Domestic Overnight Trip
- The trip involved a stay of at least one night in one or more of the GB nations; England, Scotland or Wales.
- The trip is not taken on a frequent basis (less often than once a week).
- For GB Domestic Overnight Holiday Trips; the main purpose of the trip was for holiday, pleasure or leisure.
- For GB Domestic Overnight VFR Trips (VFR); the main purpose of the trip was for visiting friends and relatives, including VFR trips that were combined with a holiday.
- For GB Domestic Overnight Business Trips; the main purpose of the trip was for business.
- For GB Domestic Overnight Miscellaneous/Other Trips; the main purpose of the trip was for another type of trip taken not covered by the above classifications including personal events, public events, or for study, medical, religious purposes, or any overnight stay in GB as part of an overseas trip.
Criteria for qualifying as an eligible GB Domestic Tourism Day Trip
- The trip lasted for 3 or more hours, including travel time, to undertake one or more eligible leisure activities.
- The trip is undertaken less often than once a week.
- The trip included a visit to a place outside of the local authority where the trip started, except where the main activity undertaken was watching live sports events, going to visitor attractions or going to public events.
- The trip did not begin from a holiday accommodation base.
Eligible leisure activities
- Visiting friends or relatives.
- Going to a visitor attraction, such as a historic house, theme park, or museum.
- Taking part in sports or outdoor leisure activities.
- Going sightseeing and exploring areas.
- Taking part in hobbies and interests.
- Taking part in a health or wellbeing experience.
- Attending a special event or celebration (such as a wedding or birthday).
- Attending an organised public event (such as an exhibition or live sport).
- Going to an arts, cultural or entertainment experience (such as a museum).
- Food and drink, a night out or speciality shopping.
- Taking part in leisure activities not mentioned above.
Other definitions used in this publication
Volume
An estimate of what the grossed-up number of trips undertaken by the population would be if the survey sample is representative of the whole GB population. The reported volume of trips is an estimate of trips by individuals, so that a travel party of two people would count as two individual trips.
Value
An estimate of what the total expenditure relating to the volume of trips undertaken by the population would be if the survey sample is representative of the whole GB population.
Bednights
An estimate of what the grossed-up number of nights spent on overnight trips undertaken by the population would be if the survey sample is representative of the whole GB population.
These definitions and the associated qualifying criteria have been revised as part of the new combined survey to align with agreed international standards. These changes impact the comparability of the published domestic tourism estimates from 2021 onwards with 2019 and previous years.
Methodology
Since 2021, data on both domestic overnight trips and domestic day trips has been collected through an online survey. The sample for this online survey is a non-probability-based design sourced from 4 ESOMAR accredited online panel providers and includes quotas for important demographic variables to make the overall sample as representative as possible of GB population. The target annual sample size for the survey of overnight visitors is 60,000 completed responses, while the target for the survey of day visitors is 35,000 completed responses. Not every person who is interviewed will have taken an eligible trip and so the base sizes used for trip estimation are lower than the number of interviews.
A weighting scheme is used to make the results as representative as possible of the GB population. However, the use of a non-probability online sample limits the extent to which the survey responses are truly representative of the full GB population, a limitation of similar online sample surveys. The new weighting scheme uses the National Statistics Socio-economic Classification (NS-SEC) mapped to approximate social grade for population statistics, for the purpose of quotas and weighting to the GB population. The change to using NS-SEC as the population statistics source will impact the estimation and reporting of trips compared to the previous reporting of social grade used in 2019 and previous years.
In 2024, a review of the methodology was undertaken to address volatility in the data. As a result of the review, a range of changes were applied to the methodology. For further details on the changes made to the methodology in 2024, please see the statement on the methodological review. For a comprehensive guide to the survey methodology, please see the background quality reports.
Comparability and coherence
Statistics for domestic tourism have been collected in a broadly similar way since 1989. However, the changes in survey methodology introduced in 2021 means that results published from April 2021 onwards are not directly comparable with data published for 2019 and previous years. Results from April 2021 onwards are available, and are comparable with the results in this report.
Accuracy
The statistics produced from the Great Britain Tourism Survey and the Great Britain Day Visits Survey in 2019 and previous years have been designated as official statistics, which provides reassurance to users that the statistics are produced to the very highest professional standards of trustworthiness, quality and value, set out in the Code of Practice for Statistics (Office for National Statistics (ONS)). Due to the changes in methodology and the impact of the COVID-19 pandemic, the survey results for 2021 and onwards have been labelled as ‘official statistics in development’ (ONS). The new survey and statistics have undergone a comprehensive programme of quality assurance including piloting of the survey, analysis of changes to the trip definitions, testing the impact of the new weighting scheme and a review of caps and imputation rules. Changes to the survey methodology and estimation have taken account of a review and advice provided by the Methodology Advisory Service of the ONS. A further review of the methodology was undertaken in 2024 to address volatility in the data and estimates for 2022 and 2023 were revised following the review. For further information on the review undertaken in 2024, please see the statement on the methodological review.
Prior to October 2025, a technical issue within the survey, linked to JavaScript at an early stage of the questionnaire prevented some respondents from completing the survey. After the problem was fixed, there was a shift in the reporting patterns, which affected estimates. To maintain comparability across the series, comparability adjustments were applied to estimates for October to December 2025. Further detail is available in the 2025 background quality report for overnight trips.
Relevance
These statistics are used both within and outside the Welsh Government to monitor domestic tourism demand and measure the contribution and impact of domestic tourism on the visitor economy. A key purpose of these statistics is to uncover insights into market trends over time.
The survey sponsors are planning to engage with the priority users of the statistics to check the new survey information meets their needs and we encourage users of the statistics to provide feedback on the data and this output at tourismresearch@gov.wales.
Timeliness and punctuality
All outputs adhere to the Code of Practice by pre-announcing the date of publication through the upcoming calendar. Furthermore, should the need arise to postpone an output this would follow the statement on revisions, errors and postponements. The publication of this release was delayed, due to complications introduced by a scripting issue that was resolved in late 2025, which required further analysis. Specific publication timings will be notified on the Welsh Government website.