Adroddiad sefyllfaol COVID-19: 10 Medi 2021
Diweddariad gan Gell Wybodaeth COVID-19 a'r Grŵp Ymgynghorol Diogelu Iechyd.
Ar y dudalen hon
Crynodeb yr adroddiad ar sefyllfa COVID-19
Y pwyntiau allweddol i'w nodi
Symudodd Cymru i Lefel Rhybudd 0 ar 7 Awst.
Mae achosion cyffredinol COVID-19 wedi cynyddu yng Nghymru a phositifedd profion wedi lleihau ychydig. Mae'r gyfradd tyfiant wedi lleihau dros yr wythnosau diweddar, gyda'r amser dyblu yn cynyddu o 8.6 diwrnod ar 24 Awst 2021 i 24.0 diwrnod ar 5 Medi 2021. Bydd angen i ni fonitro cyfraddau achosion a dangosyddion allweddol eraill ym mhob gwlad yn ofalus i ddeall effaith llacio'r cyfyngiadau a dychwelyd i'r ysgol yn well.
Mae amcangyfrif consensws y Gyd-ganolfan Bioddiogelwch (JBC) ar gyfer y rhif atgynhyrchu yng Nghymru rhwng 1.1 a 1.3 (fel ar 8 Medi 2021), tra bod amcangyfrif Iechyd Cyhoeddus Cymru (PHW) tua 1.2 (8 Medi 2021). Sylwer bod fel arfer oedi o 2 i 3 wythnos yn amcangyfrif JBC a bod oedi yn achos amcangyfrif PHW, sy’n defnyddio methodoleg wahanol, o tua 1 wythnos. Sleid 3, Ffynhonnell: PHW.
Mae nifer o bobl mewn gwelyau yn yr ysbyty ac mewn unedau gofal dwys yn cynyddu'n gyflym ar gyfer pob bwrdd iechyd yng Nghymru. Ar 8 Medi 2021, roedd 553 o gleifion COVID-19 (Amheuaeth, Cadarnhawyd, a oedd yn Gwella) mewn gwelyau ysbyty (+170 ers yr wythnos flaenorol), lle'r oedd 443 ohonynt wedi eu cadarnhau. Mae 49 o gleifion gydag Amheuaeth o, neu COVID-19 wedi cadarnhau mewn gwelyau gofal critigol yng Nghymru, 115 yn is na'r mwyafswm posibl COVID-19 o oddeutu 164.
Ar 7 Medi 2021, roedd gan Gymru 21,285 o achosion a gadarnhawyd o'r amrywiolyn amlycaf Delta (cynnydd o 2,737 o'r wythnos flaenorol), ac 12,466 o achosion o'r amrywiolyn Alpha (cynydd o 2 o'r wythnos flaenorol). Ni chadarnhawyd unrhyw amrywiolyn sy'n peri pryder arall gan ddull dilyniant genom yng Nghymru. Mae data ynghylch statws brechu'r achosion a derbyniadau i’r ysbyty yn cael eu diwygio gan Iechyd Cyhoeddus Cymru ar hyn o bryd felly nid ydynt ar gael. Ffynhonnell: PHW.
Am 10pm ar 7 Medi, mae cyfanswm o 4,557,698 (+18,043) o ddosau o frechlyn COVID-19 wedi eu rhoi yng Nghymru a'u cofnodi yn System Imiwneiddio COVID-19 Cymru. O'r rhain roedd 2,363,623 (+7,624) yn ddosau cyntaf a 2,194,075 (+10,419) yn ail ddosau. Ffynhonnell: PHW.
Dangosyddion allweddol
Mae nifer o ddangosydd allweddol wedi cynyddu ers yr wythnos flaenorol.
Sylwer bod y saethau yn cynrychioli newid mewn cymhariaeth â’r wythnos ddiwethaf.
| Gwerth cyfredol (04/09/21) | Newid ers yr wythnos flaenorol (28/08/21 i 04/09/21 oni nodir fel arall) | ||||
|---|---|---|---|---|---|
| Newid mewn canran | Newid mewn gwerth | ||||
| Cyfradd yr achosion a gadarnhawyd (swm 7 diwrnod treigl fesul 100k) | 500 | +21% | ↑ | (+86) | |
| Cyfradd achosion a gadarnhawyd yn y rheini dros 60 oed (swm 7 diwrnod treigl fesul 100k) | 243 | +11% | ↑ | (+23) | |
| Positifedd profion (Cyfartaledd treigl 7 diwrnod) | 18.9% | -2% | → | (-0.4 pwynt canrannol) | |
| Y boblogaeth yr amcangyfrifir bod ganddi COVID-19 (cyffredinrwydd)1 | 1.54% | +67% | ↑ | (+0.62 pwynt canrannol) | |
| Derbyniadau COVID-19 y GIG2 | 41 | +16% | ↑ | (+6) | |
| Marwolaethau ONS (swm 7 diwrnod)3 | 14 | -26% | ↓ | (-5) | |
| Marwolaethau PHW (swm 7 diwrnod) | 30 | +58% | ↑ | (+11) | |
- Mae’r data diweddaraf a gafwyd o’r Arolwg Heintiadau COVID-19 ar gyfer y cyfnod o 28 Awst 2021 i 3 Medi 2021.
- Y cyfartaledd treigl saith diwrnod hyd at y dyddiad presennol o gleifion y cadarnhawyd bod ganddynt COVID-19, nid yw’n cynnwys cleifion y mae amheuaeth bod ganddynt COVID-19 neu sy’n gwella.
- Mae data marwolaethau diweddaraf ONS hyd at 27 Awst 2021 (yn hytrach na 4 Medi 2021) ar gyfer y gwerth cyfredol. Defnyddir data hyd at 20 Awst 2021 ar gyfer y newid ers yr wythnos flaenorol.
What is the current status of the epidemic?
| Local Authority | Number | % of All Wales Total | Case Incidence per 100,000 | Change from previous week |
|---|---|---|---|---|
| Merthyr Tydfil | 472 | 3.1% | 782.4 | 52% ↑ |
| Swansea | 1671 | 11.0% | 676.5 | 3% ↑ |
| Neath Port Talbot | 948 | 6.2% | 661.5 | 13% ↑ |
| Carmarthenshire | 1125 | 7.4% | 596 | 52% ↑ |
| Rhondda Cynon Taf | 1362 | 9.0% | 564.5 | 19% ↑ |
| Caerphilly | 966 | 6.4% | 533.5 | 44% ↑ |
| Conwy | 612 | 4.0% | 522.2 | 19% ↑ |
| Denbighshire | 492 | 3.2% | 514.1 | -2% ↓ |
| Vale of Glamorgan | 606 | 4.0% | 453.6 | 29% ↑ |
| Newport | 684 | 4.5% | 442.2 | 12% ↑ |
| Gwynedd | 545 | 3.6% | 437.5 | 7% ↑ |
| Pembrokeshire | 542 | 3.6% | 430.8 | -1% ↓ |
| Bridgend | 629 | 4.1% | 427.7 | 11% ↑ |
| Blaenau Gwent | 290 | 1.9% | 415.1 | 46% ↑ |
| Cardiff | 1512 | 10.0% | 412.1 | 30% ↑ |
| Ceredigion | 285 | 1.9% | 392 | 16% ↑ |
| Powys | 509 | 3.4% | 384.3 | 15% ↑ |
| Isle of Anglesey | 260 | 1.7% | 371.2 | 29% ↑ |
| Flintshire | 573 | 3.8% | 367.1 | 20% ↑ |
| Torfaen | 320 | 2.1% | 340.6 | -2% ↓ |
| Wrexham | 428 | 2.8% | 314.8 | -9% ↓ |
| Monmouthshire | 281 | 1.9% | 297.1 | 12% ↑ |
| Unknown | 61 | 0.4% | - | -25% ↓ |
| Total | 15173 | 100.0% | 481.2 | 18% ↑ |
At a Wales level, on 3 September 2021, the 7-day rolling incidence of COVID-19 cases has increased sharply since last week. However, the percentage of people testing positive for COVID-19 have decreased slightly since last week (slide 2).
The JBC consensus Reproduction number (Rt) estimate for Wales is between 1.1 and 1.3 (reported 8 September 2021) , with daily growth rate of between +1% and +4% and a doubling time between flat and 18 days. Using PHW positive test data only (more timely data but limited by variation in testing), Rt is estimated to be between 1.15 and 1.2 for Wales (8 September 2021). The central Rt estimate is highest for Cardiff and Vale health board at 1.3. Source: JBC/PHW
7-day cumulative case incidence in Wales has increased by 18% to 481.2 per 100,000 population in the last week.
Case incidence is increasing in 18 of the 22 local authorities. Case incidence is above 500 per 100,000 population for eight local authorities. Local authorities with the highest case incidences are Merthyr Tydfil and Swansea at 782.4 and 676.5 per 100,000 population, respectively.
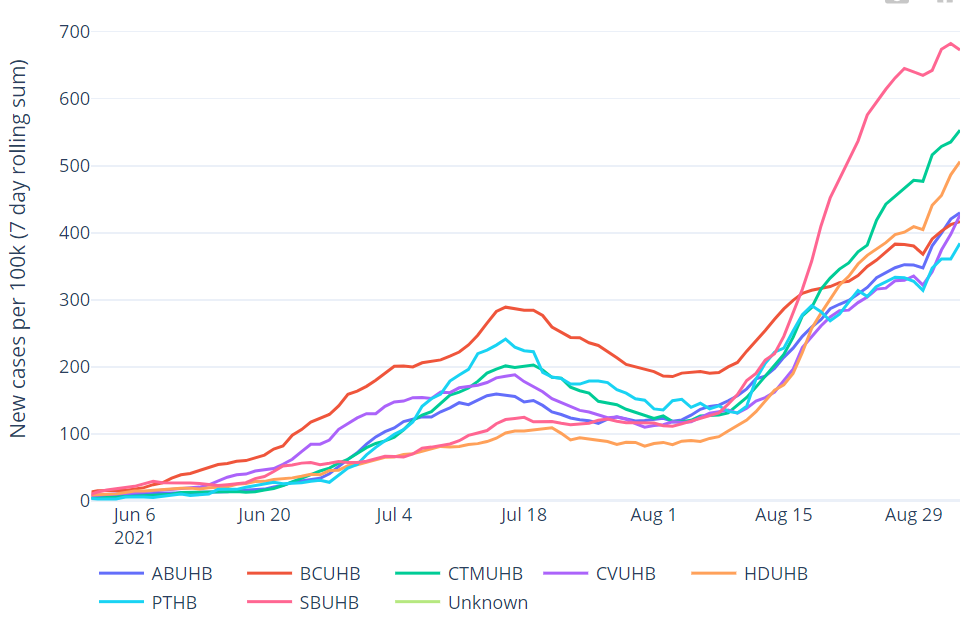
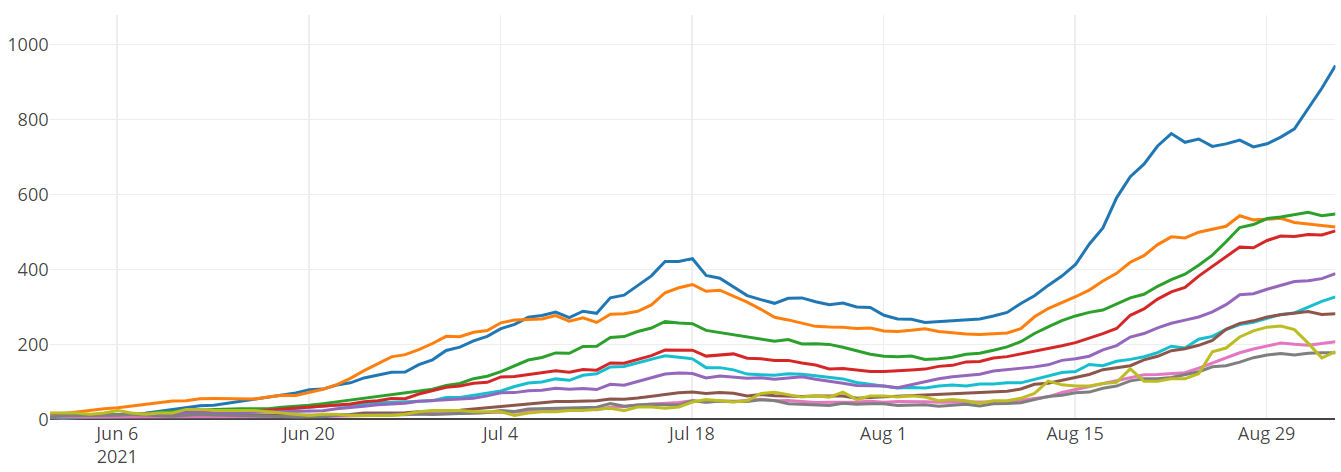
Case incidence is highest in those aged 10-19. Case incidence is increasing in most age groups and is highest in younger age groups. Case incidence is highest for the Swansea Bay health board and increased for all health boards in the last week.
The table below provides estimates of doubling and halving times based on PHW COVID-19 positive test data. In this table, doubling times are positive, whilst halving times are negative. The 95% confidence intervals are showing in brackets after the central estimate. An asterisk (*) means that there are small numbers and estimates should be treated with caution. Local health board level estimates of Rt and halving times will be unstable when incidence is low.
| Area | Rt (95% CI) | Doubling time (95% CI) |
|---|---|---|
| All Wales | 1.2 (1.2 to 1.2) | 19 (10 to 158) |
| Swansea Bay UHB | 1.1 (1.0 to 1.1) | 25 (12 to -141) |
| CTM UHB | 1.2 (1.2 to 1.3) | 15 (8 to 63) |
| Aneurin Bevan UHB | 1.2 (1.2 to 1.3) | 17 (9 to 100) |
| Cardiff & Vale UHB | 1.3 (1.3 to 1.4) | 14 (8 to 54) |
| Hywel Dda UHB | 1.3 (1.2 to 1.3)* | 15 (9 to 51)* |
| Powys THB | 1.2 (1.1 to 1.3)* | 22 (10 to -108)* |
| Betsi Cadwaladr UHB | 1.1 (1.1 to 1.1) | 27 (12 to -116) |
Cases per 100k (PHW Data) (7 day rolling sum to3 September)
Cases per 100k by age (PHW Data) (7 day rolling sum to 3 September)
Data as at 12:00PM 8 September 2021 unless otherwise specified.
What is the situation with the NHS and social care?
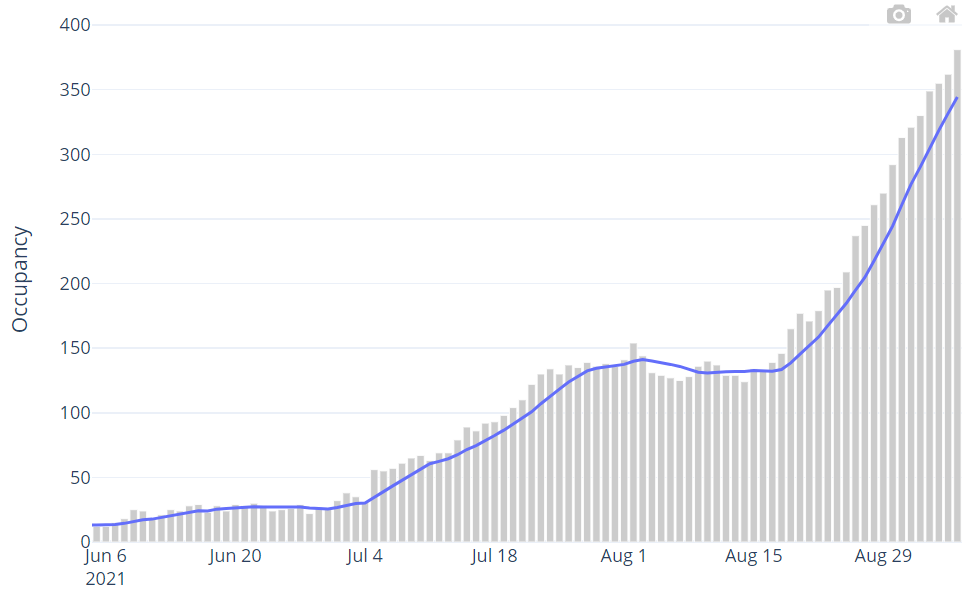
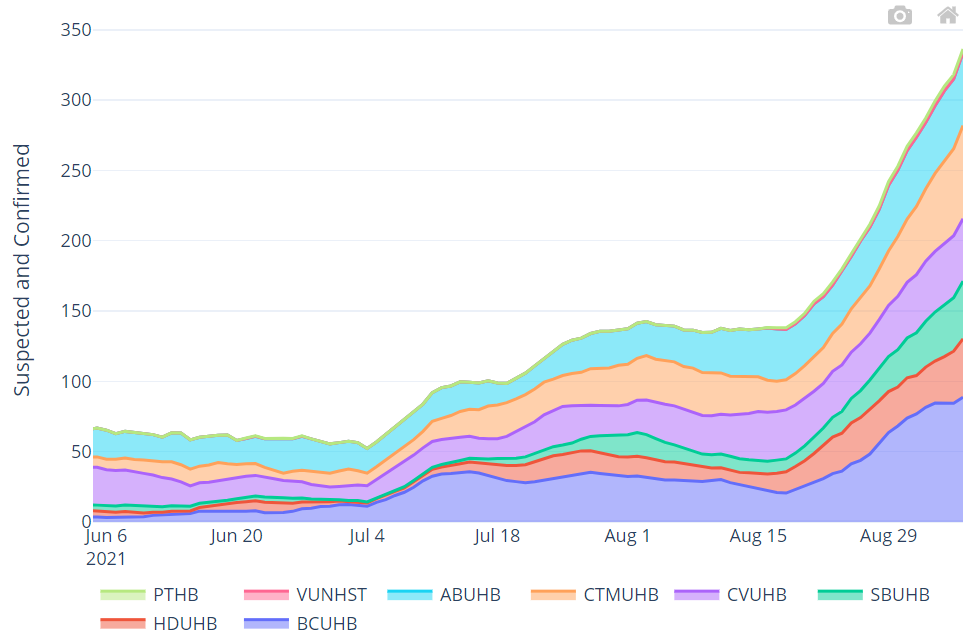
From early July 2021, COVID-19 pressure on the NHS has been generally increasing. As at 8 September 2021, there were 553 COVID-19 related patients (Suspected, Confirmed and Recovering) occupying a hospital bed. This compares to 383 (170 more occupied beds) on 1 September 2021. Confirmed patients accounted for 441 of the total occupied beds.
There are 49 patients with Suspected or Confirmed COVID-19 in critical care beds in Wales. This is 115 lower than the maximum COVID-19 position of approximately 164. The total number of patients in critical care for both COVID-19 and non-COVID-19 stands at 180, 28 more than the historic maximum critical care capacity of approximately 152.
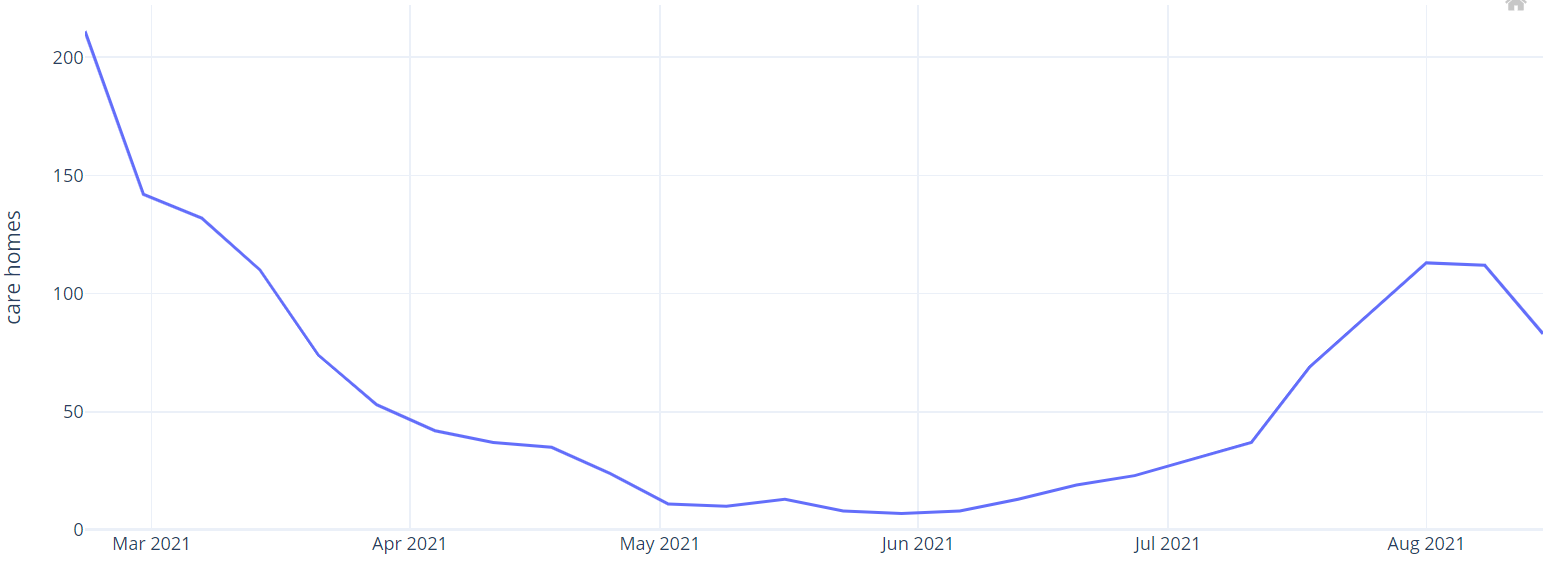
There is no available update to care home data reporting this week.
Confirmed hospital occupancy (7 day rolling average)
Overall invasive ventilated bed occupancy (7 day rolling average)
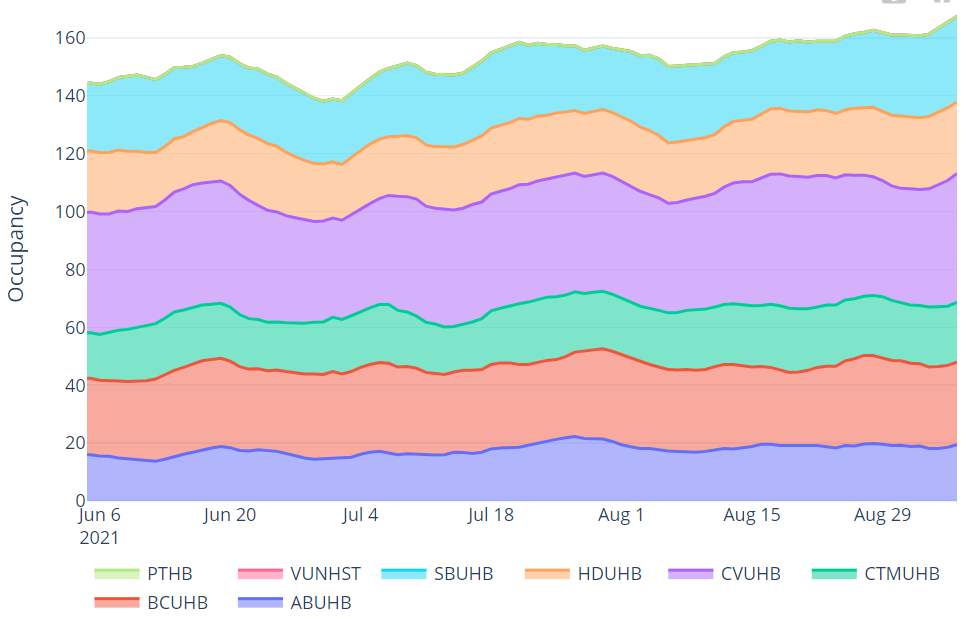
Hospital bed occupancy for suspected and confirmed COVID-19 positive patients (7 day rolling average)
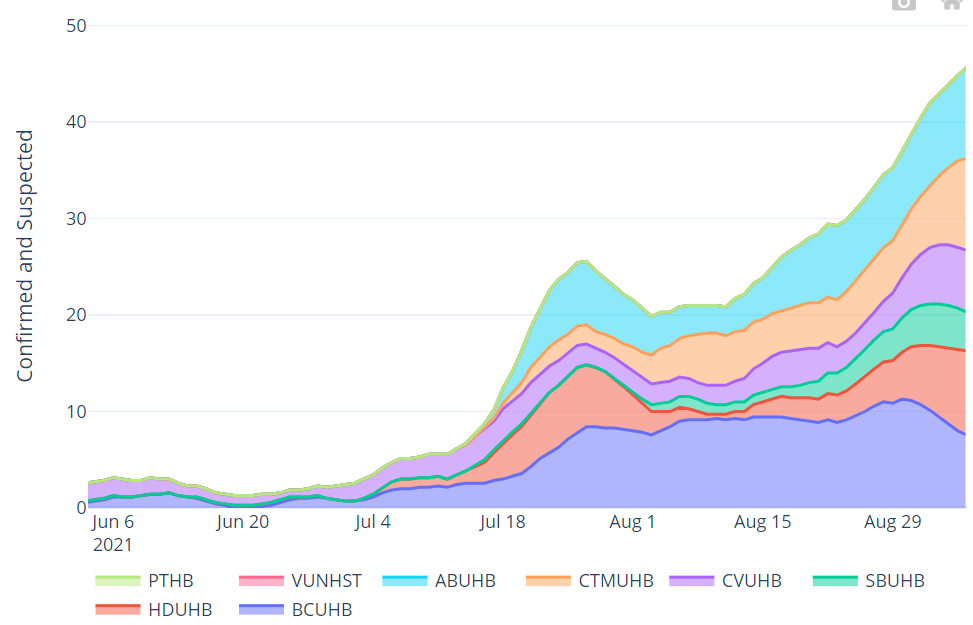
Invasive ventilated bed occupancy for suspected and confirmed COVID-19 positive patients (7 day rolling average)
Number of adult care homes reported an ongoing outbreak/incident (last 7 days)
Wastewater Monitoring for COVID-19
In the week ending 3 September 2021, the mean wastewater signal for Wales has seen a sharp increase suggesting an increasing prevalence of Covid-19 in the community.
The normalised SARS-CoV-2 wastewater signal has not been substantially at variance with the trend in positive COVID-19 cases reported within the wastewater catchments by PHW over the same period. Sharp increases in positive cases seen in South Wales have been mirrored in the wastewater data.
Wastewater signal is a relatively unbiased indicator because it is not dependent on testing policy and behaviour. The characteristics of the individual sewerage systems could have an impact on the signal being seen. Positive case data and wastewater signal can differ as wastewater can give an indication of the prevenance of Covid-19 in asymptomatic groups not subject to PCR testing.
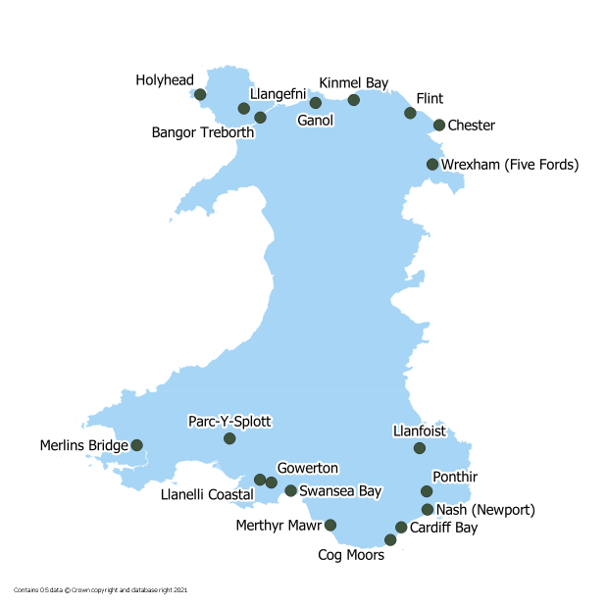
For this period, all sites are currently on the watchlist due to increasing levels of SARS-CoV-2 signal found in wastewater.
Wastewater SARS-CoV-2 signal data below limit of detection recorded as zero. The wastewater data for individual WwTW sites, normalised and unnormalised are inherently noisy. Sampling from Flint has been interrupted due to logistical issues at the site. Wastewater data analysis and reporting is still in a pilot stage and should not be relied upon in isolation.
| Mean normalised SARS-CoV-2 signal (10-3) | Fold change | ||||
|---|---|---|---|---|---|
| Region | Site | 21 Aug 2021 to 27 Aug 2021 | 28 Aug 2021 to 03 Sep 2021 | Mean normalised SARS-CoV-2 signal | Trend |
| North Wales | Bangor (Treborth) | 2.4 | 4.8 | 2.0 | ↑ |
| Chester | 3.8 | 1.3 | 0.3 | ↓ | |
| Flint | 0.2 | b | b | ||
| Holyhead | 0 | 0 | 1.8 | ↑ | |
| Llandudno (Ganol) | 0.6 | 0.8 | 1.4 | ↑ | |
| Llangefni | 0.1 | 0.8 | 5.5 | ↑ | |
| Rhyl (Kinmel Bay) | b | 2.8 | b | ||
| Wrexham | 1.4 | 3.6 | 2.5 | ↑ | |
| South Wales | Abergavenny (Llanfoist) | 1.8 | 26.4 | 14.6 | ↑ |
| Bridgend (Merthyr Mawr) | 4 | 19.9 | 4.9 | ↑ | |
| Cardiff | 16.4 | 36.7 | 2.2 | ↑ | |
| Carmarthen (Parc Y Splotts) | 2.3 | 2.9 | 1.3 | ↑ | |
| Cowbridge (Cog Moors) | 12.3 | 51.1 | 4.1 | ↑ | |
| Cwmbran (Ponthir) | 8 | 70.1 | 8.8 | ↑ | |
| Haverfordwest (Merlin's Bridge) | 0.3 | 3.7 | 11.2 | ↑ | |
| Llanelli | 8.4 | 23.1 | 2.7 | ↑ | |
| Newport | 11.5 | 3.2 | 0.3 | ↓ | |
| Swansea (Gowerton) | 32.8 | 60.4 | 1.8 | ↑ | |
| Swansea (Swansea Bay) | 27.4 | 38.7 | 1.4 | ↑ | |
b: Samples not available
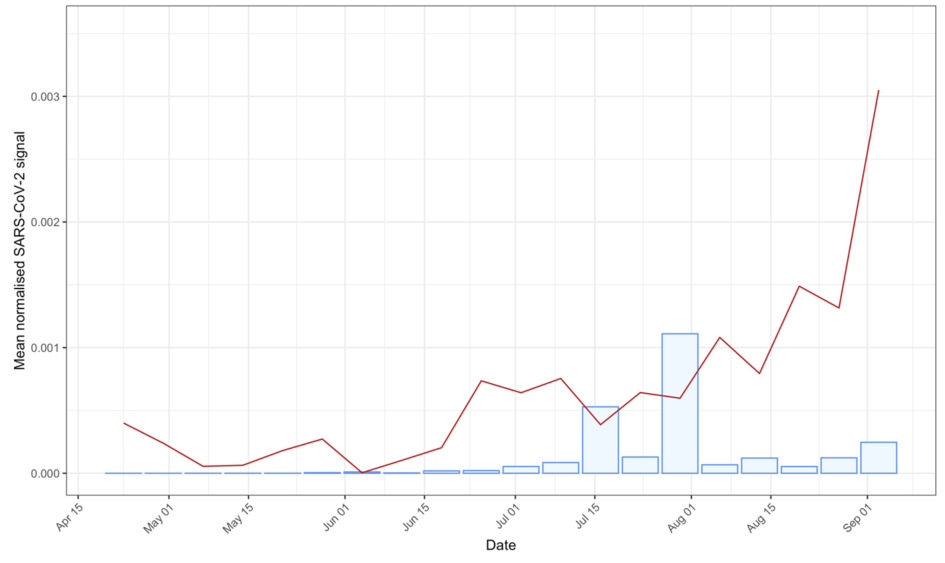
Weekly comparison of North and all-Wales mean normalised SARS-CoV-2 signal.
All-Wales mean signal (red line) and North Wales mean signal (blue bars). Data to 3 September 2021.
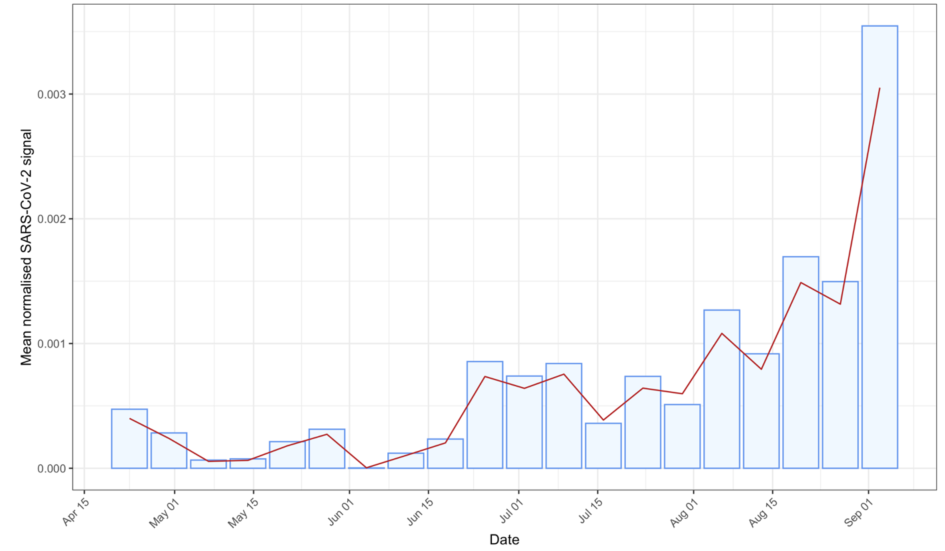
Weekly comparison of South and all-Wales mean normalised SARS-CoV-2 signal.
All-Wales mean signal (red line) and South Wales mean signal (blue bars). Data to 29 August 2021.
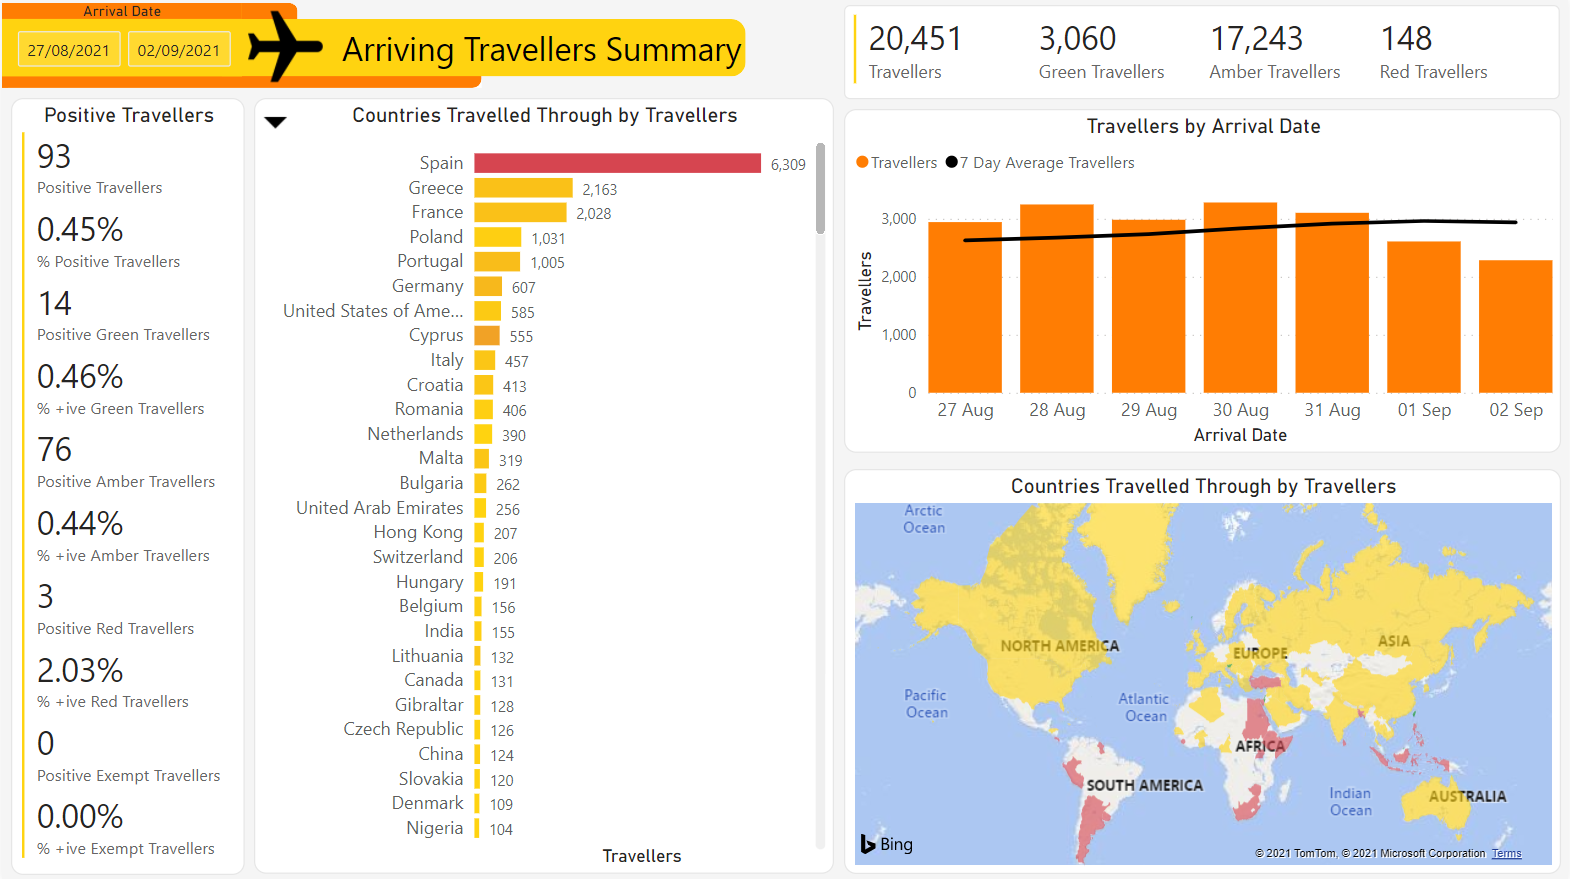
What is the situation with arriving travellers?
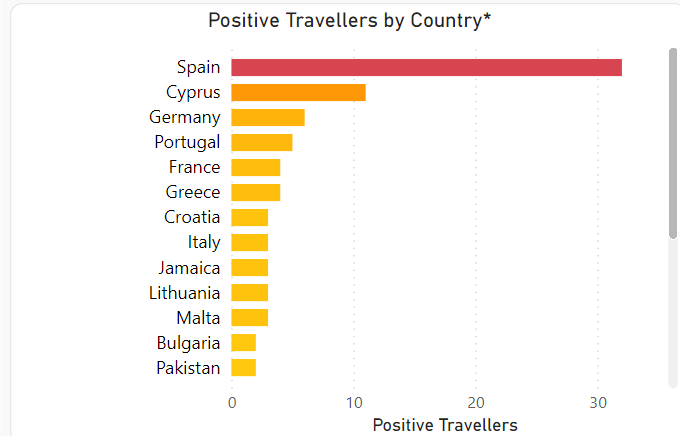
There have been 93 positive travellers this week (0.45% positivity), compared to 41 for the previous week (0.23% positivity) at time of reporting.
Spain continues to see the highest numbers of arrivals testing positive on return, with a positivity rate of 0.51% - this has increased when comparing to the previous week with 13 testing positive at a rate of 0.24% at time of reporting. Cyprus has seen 11 positives at a rate of 1.98%, and there have been 6 positive travellers from Germany at a rate of 0.99%.
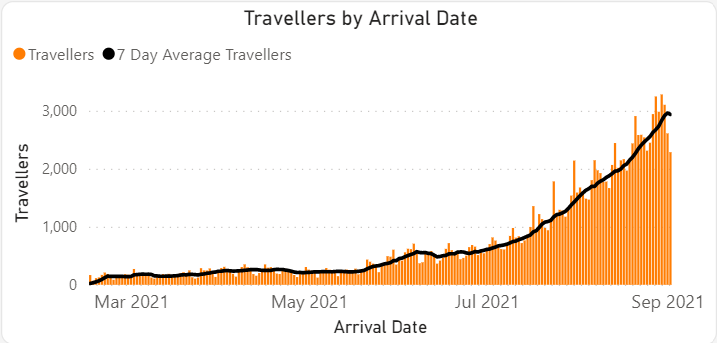
20,451 total arrivals for the week (17,814 last week; +14.8%)
- Red: 148 (102 last week)
- Amber: 17,243 (15,223 last week)
- Green: 3,060 (2,489 last week)
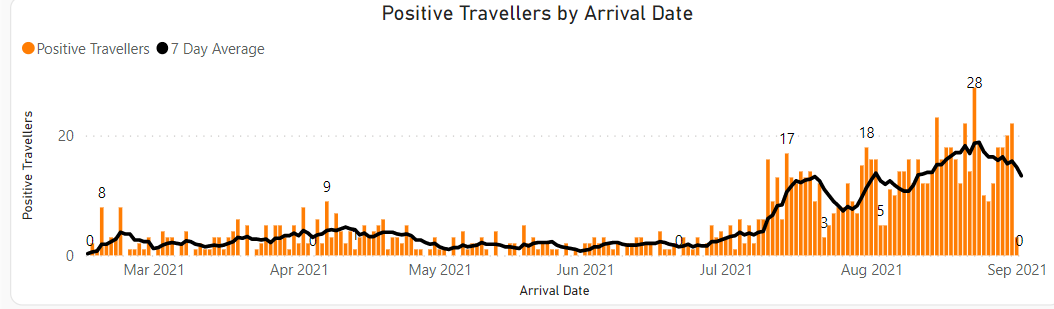
Positive travellers timeline
Positive travellers this week by country
Arriving travellers timeline
Source: Home Office
Please note that the data provided by the Home Office is derived from Passenger Locator Forms (PLF) which are self-completed by travellers. As such, data may contain inaccuracies. Due to the limitations associated with data capture and legislation, some minor discrepancies may be present in the data. Countries with 10 or less travellers have been included in the overall positive traveler total, but excluded from the Green/Amber/Red positive traveller breakdown totals for personal identifiable information purposes.
Mobility data, adherence and UK comparison
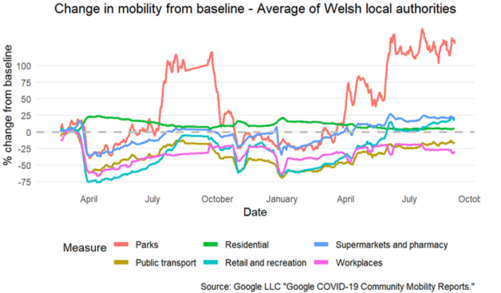
Mobility data by location of trip, Welsh local authorities
The latest mobility data shows decreases in the latest week in most categories compared to the previous week. The baseline for much of the data is during January to February 2020 and changes are relative to that period. It is not possible to determine if mobility is higher/lower than would have been expected prior to the pandemic as data for 2019 or earlier years is not published.
Adherence
The most recent IPSOS MORI data for the period 27 August to 30 August for Wales shows the number of people only leaving home for essential trips has remained stable with the last survey wave, along with the number of people maintaining 2m social distancing.
Results from the coronavirus (COVID-19) Infection Survey, 28 August to 3 September
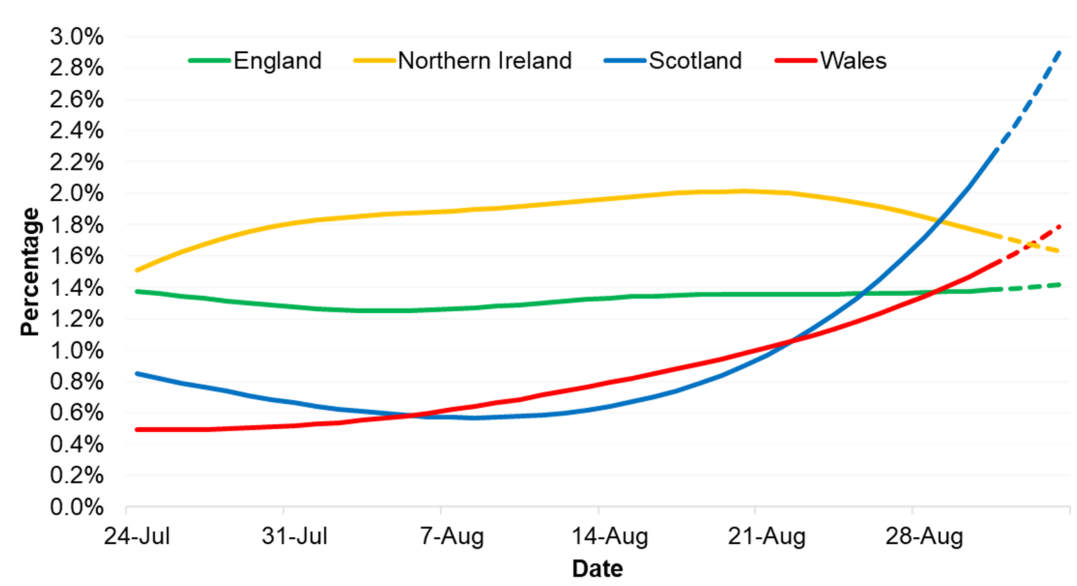
The percentage of people in the community population testing positive has levelled off in England, but has increased in Scotland and Wales. The trend is uncertain in Northern Ireland. Positivity is highest in Scotland (2.23%) and lowest in England (1.38%).
It is estimated that an average of 46,800 people in Wales had COVID-19 (95% credible interval: 35,700 to 59,500), equating to around 1 in 65 people or 1.54% of the community population (up from 0.92% last week). This compares to around 1 in 70 people in England, around 1 in 45 people in Scotland, and around 1 in 60 people in Northern Ireland.
Source: Office for National Statistics COVID-19 Infection Survey.
Positivity rates (%) across UK countries up to 28 August 2021
Vaccine and immunity status
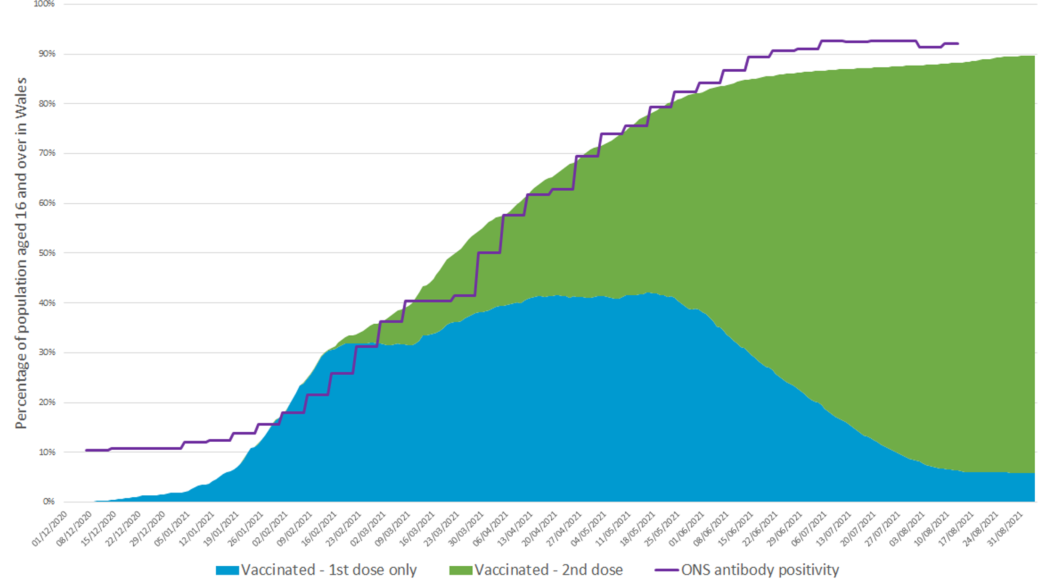
Vaccination and antibody status of individuals aged 16 and over in Wales
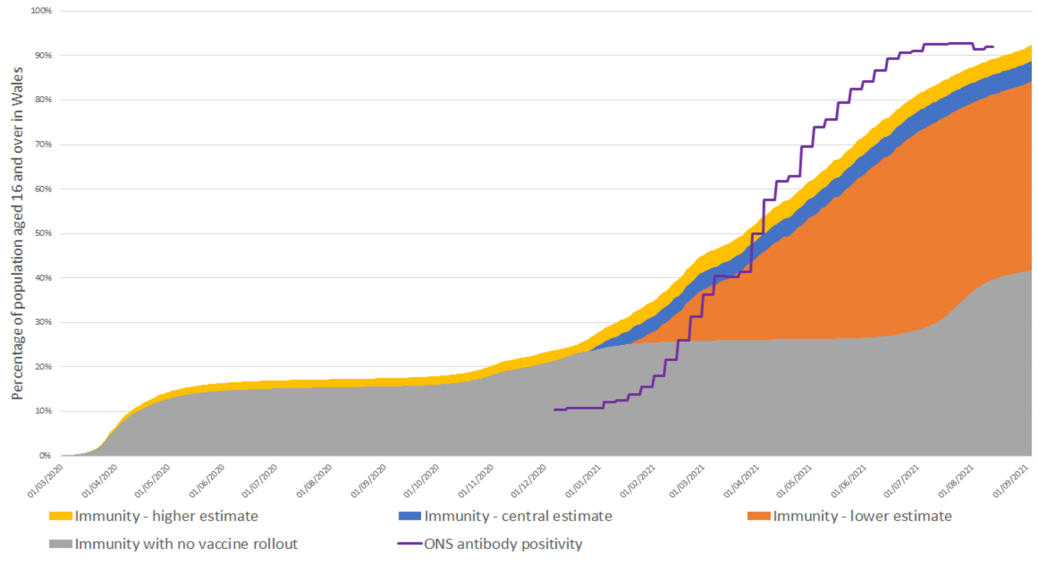
Immunity estimates and antibody status of individuals aged 16 and over in Wales
The COVID-19 vaccination rollout of first and second doses has slowed in Wales. As at 4 September 2021, 90% of people aged 16 and over had received at least one COVID-19 vaccine dose in Wales. 6% of people aged 16 and over had exactly one vaccine dose and 84% were fully vaccinated.
Between 9 and 13 August 2021, the ONS COVID-19 Infection Survey estimated that 92.0% of the community population aged 16 and over in Wales tested positive for COVID-19 antibodies.
As at 4 September 2021, it is estimated that 89% of people aged 16 and over in Wales had some immunity against COVID-19 infection. The lower and higher estimates of immunity are 84% and 92% of people aged 16 and over in Wales. If no vaccines had been administered, it is estimated that 42% of people aged 16 and over would be immune.
It is currently estimated that over 80% (may be closer to 90%) of the population, spread evenly across Wales, must be immune to COVID-19 before population immunity effects would be observed (TAG advice on the Delta variant, published 18 June 2021). Note that the immunity estimate of 89% is for individuals aged 16 and over, not the total Wales population, and varies across age groups.
Differences between antibody presence and immunity estimates include:
- ONS antibody estimates are based on study participants who have volunteered for the study and estimates are extrapolated.
- ONS estimates are based on the 16+ community population, which excludes people in care homes or hospitals. Immunity estimates are based on the whole 16+ Wales population.
- While antibody protection doesn’t equal immunity from infection, it does give a useful indication of the level of protection from infection in the Welsh population.
- Antibody estimates use 2019 mid-year population estimates while the immunity estimates use 2020 mid-year estimates.
Source: ONS COVID-19 Infection Survey, PHW, SPI-M, Swansea University modelling.
Note: The lower, central and higher immunity estimates use cautious, central and optimistic vaccine efficacy and immunity-following-natural-infection assumptions, and do not account for waning immunity.
What does the situation look like going forward?
Based on the current rates observed with current restrictions:
Cases
The probability of incidence reaching greater than 500 per 100,000 between 19 September and 25 September is above 80% for 3 of the 22 local authorities. The figure illustrates the probability (between 0 – 100%) of incidence being greater than 500 per 100,000. Source: Imperial College London
Probability of greater than 500 per 100,000 cases by local authority
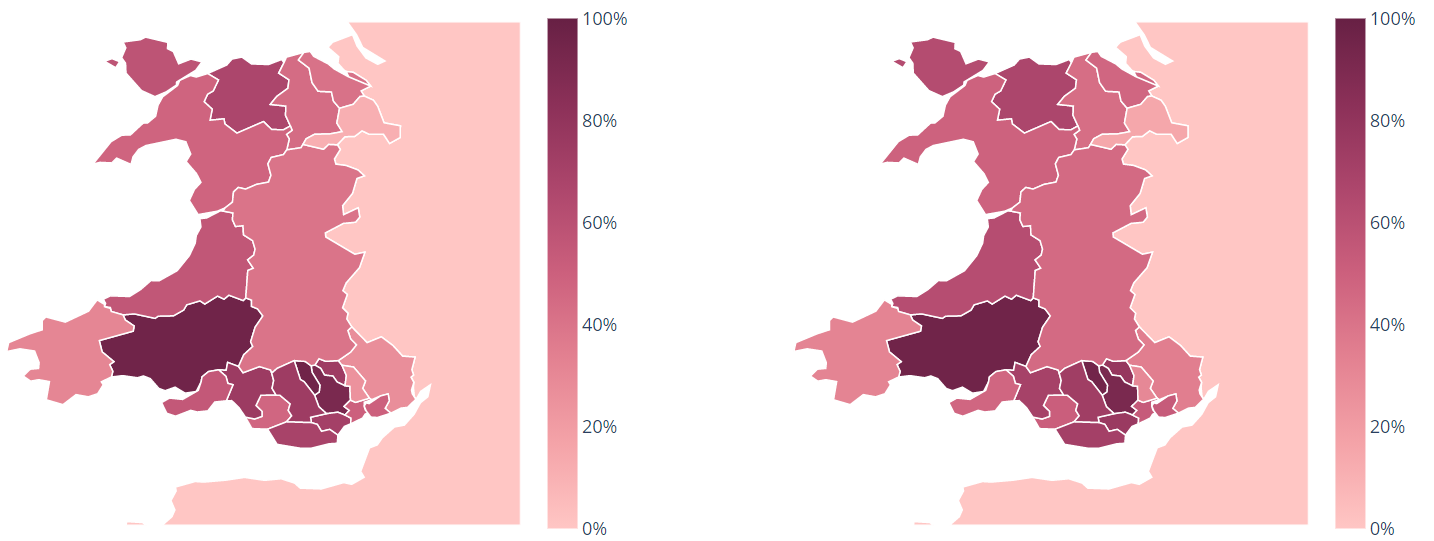
12 to 18 September 2021 and 19 to 25 September
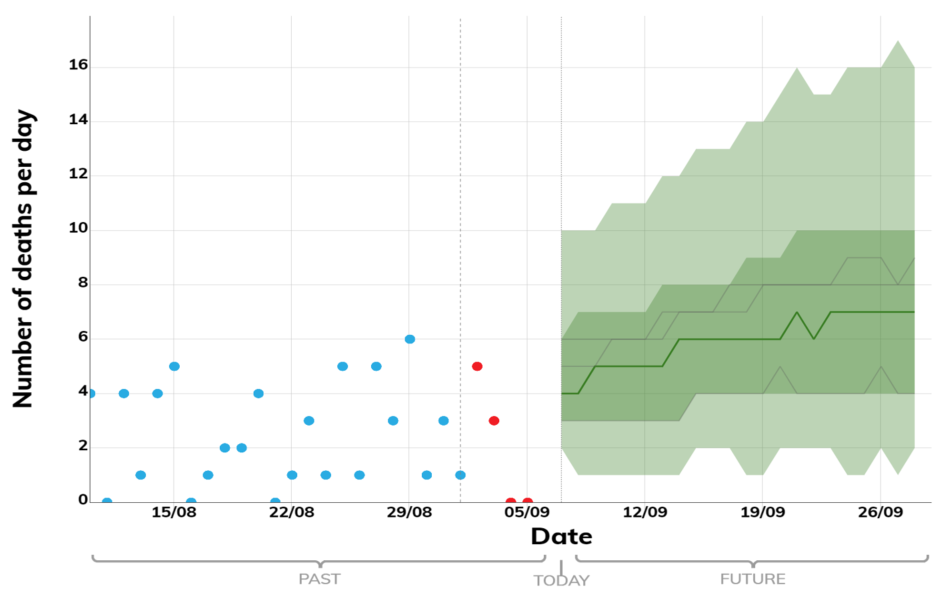
Deaths per day
Projected to increase to around 7 per day over the next three weeks. Source: Modelled medium term projections, SAGE/SPI-M, 7 September
Hospitalisations per day
Projected to increase and stabilise at just under 100 per day over the next three weeks. Source: Modelled medium term projections, SAGE/SPI-M, 1 September
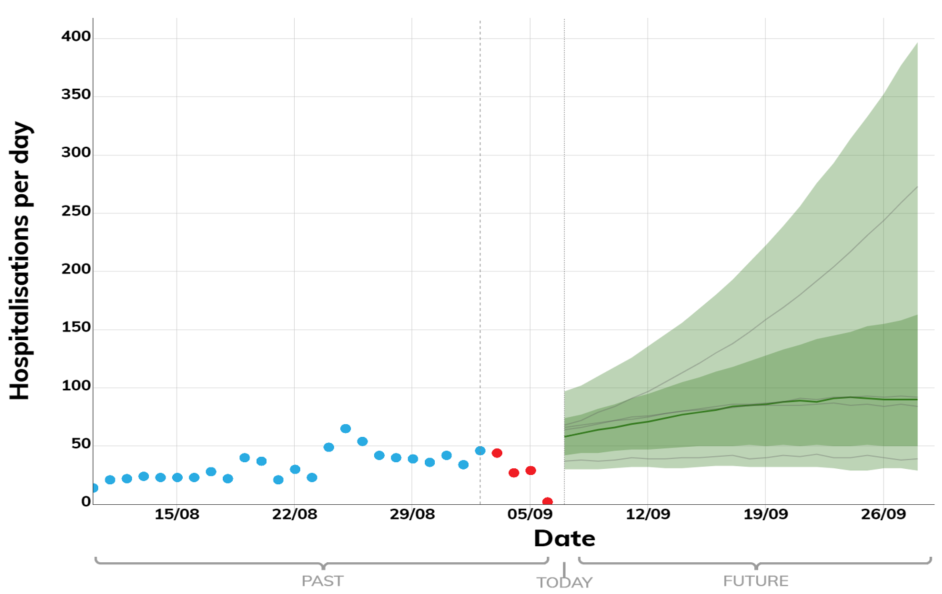
These projections are based on current trends and will not fully reflect the impact of policy or behavioural changes over the past two to three weeks, including the recent downward trend in all UK nations. The projections include the impact of vaccines, but cannot capture any future increases in transmission resulting from new variants. They are not forecasts or predictions.
Key risks and sources
Key risks
Transmissions, incidence and prevalence
Overall transmission of COVID-19 has increased across Wales, while test positivity has decreased slightly.
Rising trends across health boards and local authorities.
NHS capacity
From early-July 2021, COVID-19 pressure on the NHS is increasing rapidly.
Mortality
Low, but slowly rising number of daily deaths in the most recent week.
Variants
Wales has had 21,285 confirmed cases of the dominant Delta variant (an increase of 2,737 from the previous week), and 12,466 cases of Alpha variant (an increase of 2 from the previous week. Delta remains the dominant variant of COVID-19 in Wales.
Immunity and vaccines
4,557,698 (+18,043) doses of COVID-19 vaccine were given in Wales and recorded in the COVID-19 Welsh Immunisation System. Of this 2,363,623 (+7,624) were first doses and 2,194, 075 2,183,656 (+10,419) were second doses. 89% of those aged 16 and over in Wales were estimated to have some immunity against COVID-19 infection at 4 September 2021.
International
There is an increase in traveller numbers this week. However, the proportion of travellers testing positive is relatively low.