Adroddiad sefyllfaol COVID-19: 24 Mehefin 2021
Diweddariad gan Gell Wybodaeth COVID-19 a'r Grŵp Ymgynghorol Diogelu Iechyd.
Ar y dudalen hon
Crynodeb yr adroddiad ar sefyllfa COVID-19
Y pwyntiau allweddol i’w nodi
Mae Cymru ar Lefel Rhybudd 1.
Mae trosglwyddiadau cyffredinol COVID-19 yn cynyddu yn gyflym mewn sawl ardal ar draws Cymru. Mae amcangyfrif consensws SAGE ar gyfer y rhif atgynhyrchu yng Nghymru rhwng 1.0 a 1.4, tra bod amcangyfrif Iechyd Cyhoeddus Cymru (PHW) rhwng 1.4 ac 1.6. Ffynhonnell: SAGE, PHW, 21 Mehefin 2021. Sylwer bod fel arfer oedi o 2-3 wythnos yn amcangyfrif SAGE a bod oedi yn achos amcangyfrif PHW, sy’n defnyddio methodoleg wahanol, o tua 1 wythnos. Mae’r digwyddedd achosion a chanran y bobl sy’n profi’n bositif am COVID-19 hefyd wedi cynyddu. Sleid 3, Ffynhonnell: PHW
Mae’r pwysau sydd ar y GIG oherwydd COVID-19 yn parhau’n sefydlog ar y lefelau isaf ers dechrau cofnodi, ond os bydd achosion yn parhau i gynyddu’n gyflym mae derbyniadau i’r ysbyty yn debygol o ddilyn yr un patrwm. Sleid 4, Ffynhonnell: Data Gweithredol GIG Cymru
Ar 23 Mehefin, mae’r achosion a gadarnhawyd o’r amrywiolyn Delta, sy’n fwy trosglwyddadwy, yn 788 yng Nghymru (cynnydd o 300 o achosion) sy’n golygu mai Delta yw’r amrywiolyn COVID-19 amlycaf yng Nghymru. O’r 788 o achosion a ganfuwyd hyd yma, roedd 51.78% o’r achosion mewn unigolion nad ydynt wedi’u brechu, roedd 33% wedi derbyn 1 dos ac roedd 15% wedi derbyn 2 ddos. Sylwer efallai fod y data hyn yn cynnwys brechiadau nad oes 14-21 o ddiwrnodau, fel sy’n angenrheidiol i ddarparu’r amddiffyniad gorau posibl rhag COVID-19, wedi pasio ers iddynt gael eu derbyn. O’r 788 o achosion, cafodd 12, neu 1.52% y cant, eu derbyn i’r ysbyty. Ffynhonnell: PHW
O ran brechu, fel ar 23 Mehefin 2021, mae cyfanswm o 3.82 miliwn (+0.14 miliwn) o ddosau o frechlyn COVID-19 wedi cael eu rhoi yng Nghymru. O’r rhain, dosau cyntaf oedd 2.25 miliwn (+0.02 miliwn) ac ail ddosau oedd 1.57 miliwn (+0.12 miliwn). Yn seiliedig ar amcangyfrifon SAGE, ei bod yn ofynnol i 80% o’r boblogaeth fod wedi’i brechu er mwyn ymateb i’r amrywiolyn Delta, os na cheir unrhyw ymddygiadau diogelu eraill, ni fydd y niferoedd presennol sydd wedi’u brechu yn amddiffyn ar lefel y boblogaeth gyfan. Ffynhonnell: PHW, SPI-M-O
Dangosyddion allweddol
Mae’r rhan fwyaf o ddangosyddion allweddol yn parhau i gynyddu, yn dilyn cyfnod o drosglwyddiadau isel ym mis Ebrill a mis Mai.
Sylwer bod y saethau yn cynrychioli newid mewn cymhariaeth â’r wythnos ddiwethaf.
| Gwerth cyfredol (19/06/21) | Newid ers yr wythnos flaenorol (12/06/21 – 19/06/21 oni nodir fel arall) | ||||
|---|---|---|---|---|---|
| Newid mewn canran | Newid mewn gwerth | ||||
| Cyfradd yr achosion a gadarnhawyd (swm 7 diwrnod treigl fesul 100k) | 35 | +58% | ↑ | (+13) | |
| Cyfradd achosion a gadarnhawyd yn y rheini dros 60 oed (swm 7 diwrnod treigl fesul 100k) | 8 | -5% | - | 0 | |
| Positifedd profion (Cyfartaledd treigl 7 diwrnod) | 2.8% | +26% | ↑ | (+0.6 pwynt canran) | |
| Y boblogaeth yr amcangyfrifir bod ganddi COVID-19 (cyffredinrwydd)1 | 0.12% | +71% | ↑ | (+0.05 pwynt canran) | |
| Capasiti’r GIG – Derbyniadau2 | 4 | -13% | - | (-1) | |
| Marwolaethau ONS (swm 7 diwrnod)3 | 1 | - | - | (+1) | |
| Marwolaethau PHW (swm 7 diwrnod) | 0 | -100% | - | (-1) | |
- Mae data diweddaraf yr Arolwg Heintiadau COVID-19 ar gyfer y cyfnod o 13 Mehefin 2021 i 19 Mehefin 2021.
- Y cyfartaledd treigl saith diwrnod hyd at y dyddiad presennol o gleifion y cadarnhawyd bod ganddynt COVID-19 – nid yw’n cynnwys cleifion yr amheuwyd bod ganddynt COVID-19 neu sy’n gwella.
- Mae data marwolaethau diweddaraf ONS hyd at 11 Mehefin 2021(yn hytrach na 19 Mehefin 2021) ar gyfer y gwerth cyfredol. Defnyddir data hyd at 4 Mehefin 2021 ar gyfer y newid ers yr wythnos flaenorol.
What is the current status of the epidemic?
| Local Authority | Number | % of All Wales Total | Case Incidence per 100,000 | Incidence threshold reached | Change from previous week |
|---|---|---|---|---|---|
| Flintshire | 135 | 13.3% | 86.5 | 50 or higher | 155% ↑ |
| Conwy | 101 | 10.0% | 86.2 | 50 or higher | 26% ↑ |
| Denbighshire | 72 | 7.1% | 75.2 | 50 or higher | 31% ↑ |
| Wrexham | 64 | 6.3% | 47.1 | 25 to < 50 | 45% ↑ |
| Vale of Glamorgan | 59 | 5.8% | 44.2 | 25 to < 50 | 136% ↑ |
| Cardiff | 140 | 13.8% | 38.2 | 25 to < 50 | 109% ↑ |
| Pembrokeshire | 45 | 4.4% | 35.8 | 25 to < 50 | 12% ↑ |
| Ceredigion | 24 | 2.4% | 33 | 25 to < 50 | 167% ↑ |
| Swansea | 70 | 6.9% | 28.3 | 25 to < 50 | -4% ↓ |
| Gwynedd | 33 | 3.3% | 26.5 | 25 to < 50 | 38% ↑ |
| Neath Port Talbot | 36 | 3.6% | 25.1 | 25 to < 50 | 3% ↑ |
| Isle of Anglesey | 15 | 1.5% | 21.4 | 20 to < 25 | -12% ↓ |
| Powys | 27 | 2.7% | 20.4 | 20 to < 25 | 93% ↑ |
| Caerphilly | 36 | 3.6% | 19.9 | 15 to < 20 | 100% ↑ |
| Bridgend | 28 | 2.8% | 19 | 15 to < 20 | 4% ↑ |
| Monmouthshire | 18 | 1.8% | 19 | 15 to < 20 | 64% ↑ |
| Carmarthenshire | 31 | 3.1% | 16.4 | 15 to < 20 | 24% ↑ |
| Newport | 20 | 2.0% | 12.9 | Under 15 | -17% ↓ |
| Torfaen | 12 | 1.2% | 12.8 | Under 15 | -20% ↓ |
| Rhondda Cynon Taf | 26 | 2.6% | 10.8 | Under 15 | 4% ↑ |
| Blaenau Gwent | 7 | 0.7% | 10 | Under 15 | -12% ↓ |
| Merthyr Tydfil | 4 | 0.4% | 6.6 | Under 15 | 0% → |
| Unknown | 11 | 1.1% | - | 22% ↑ | |
| Total | 1014 | 100.0% | 32.2 | 25 to < 50 | 44% ↑ |
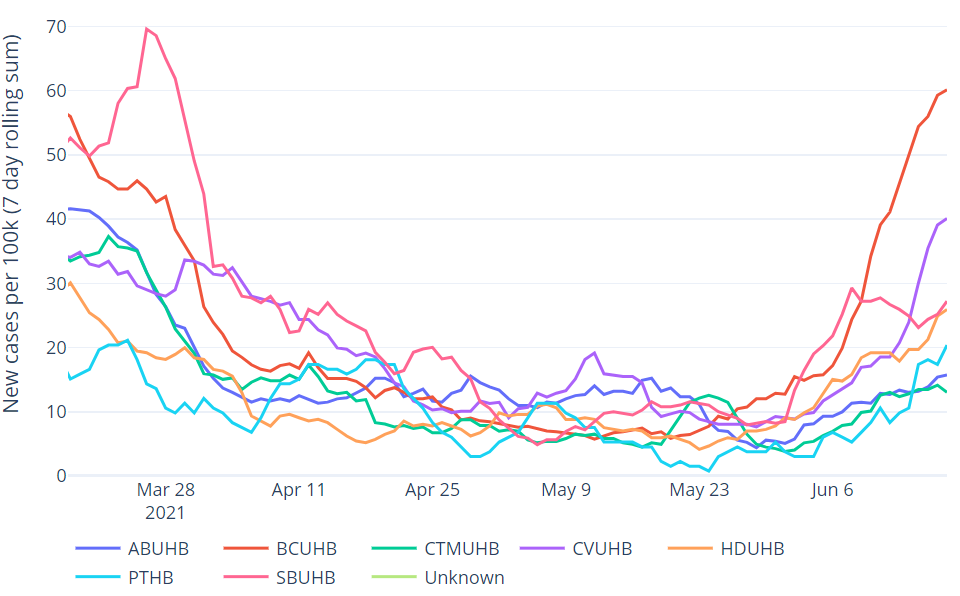
At a Wales level, on 18 June, the 7-day rolling incidence of COVID-19 cases and the percentage of people testing positive for COVID-19 have increased since last week.
The SAGE/ SPI-M consensus estimate of Reproduction number (Rt) is between 1.0 and 1.4 (as at 21 June 2021). When we look at reproduction numbers using PHW positive test data only (see second table below) - a more timely estimate but limited by variation in testing - we see a reproduction number estimate of between 1.4 and 1.6 for Wales. At local health board level, there is considerable variation in the reproduction number (cases only) estimate, with the central estimate above 1 for all health boards, and above 2 for Cardiff & Vale. Source: PHW
7-day cumulative case incidence has increased across Wales at 32.2 per 100,000 population. This is an increase of 44% compared to the previous report (22.3 per 100,000 population).
Case incidence is increasing in most local authorities. Half of all local authorities have a case incidence above the 25 per 100,000 population threshold. Case incidence is above 50 per 100,000 population for Flintshire, Conwy and Denbighshire and incidence increased for all three areas over the past week.
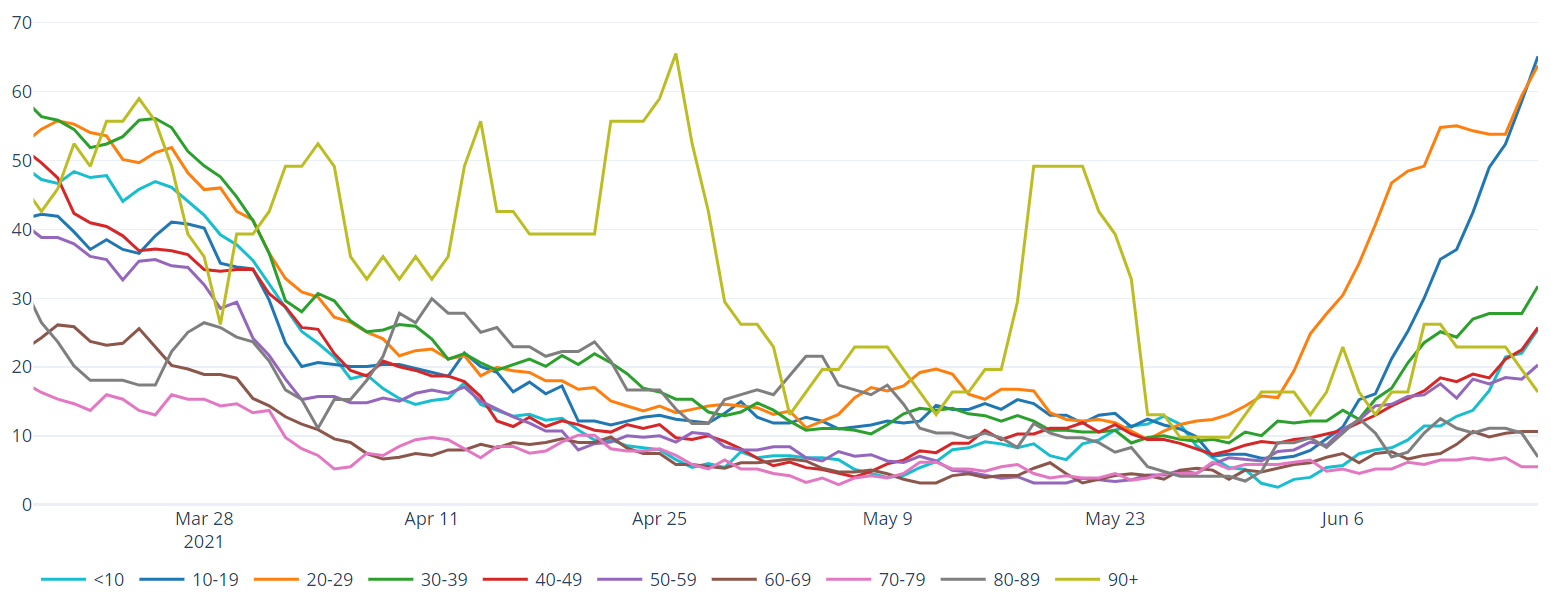
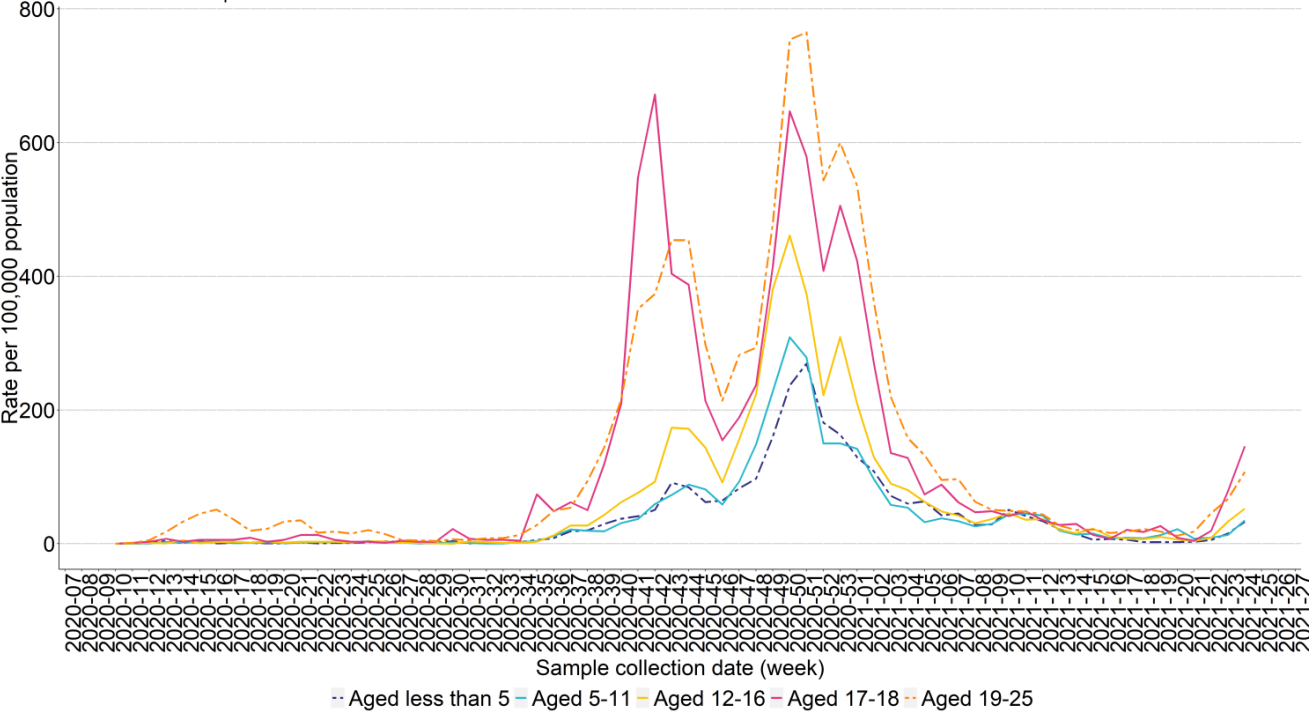
Over the past week, case incidence has risen sharply for those aged 10 – 29. The incidence for those aged 10–19 and 20-29 is more than double the next highest age group, 30-39. Incidence varies by health board and age.
The table below also provides estimates of doubling and halving times based on COVID-19 positive test data. In this table, doubling times are positive, whilst halving times are negative. The 95% confidence intervals are showing in brackets after the central estimate. An asterisk (*) means that there are small numbers and estimates should be treated with caution. Local health board level estimates of Rt and halving times will be unstable when incidence is low.
| Local Health Board | Rt (cases) | Doubling time (days) |
|---|---|---|
| All Wales | 1.5 (1.4 to 1.6) | 10 (7 to 16) |
| Swansea Bay UHB | 1.0 (0.9 to 1.2) | 27 (8 to -22) |
| CTM UHB | 1.1 (0.9 to 1.4) | 26 (7 to –16) |
| Aneurin Bevan UHB | 1.3 (1.0 to 1.5) | 13 (7 to 140) |
| Cardiff & Vale UHB | 2.1 (1.8 to 2.3) | 7 (5 to 14) |
| Hywel Dda UHB* | 1.4 (1.2 to 1.6) | 15 (7 to -85) |
| Powys THB* | 1.9 (1.4 to 2.6) | 9 (4 to –35) |
| Betsi Cadwaladr UHB | 1.5 (1.4 to 1.6) | 8 (5 to 15) |
Cases per 100k (PHW Data) (7 day rolling sum)
Cases per 100k by age (PHW Data) (7 day rolling sum)
Data as at 12:00PM 23 June 2021 unless otherwise specified
What is the situation with the NHS and social care?
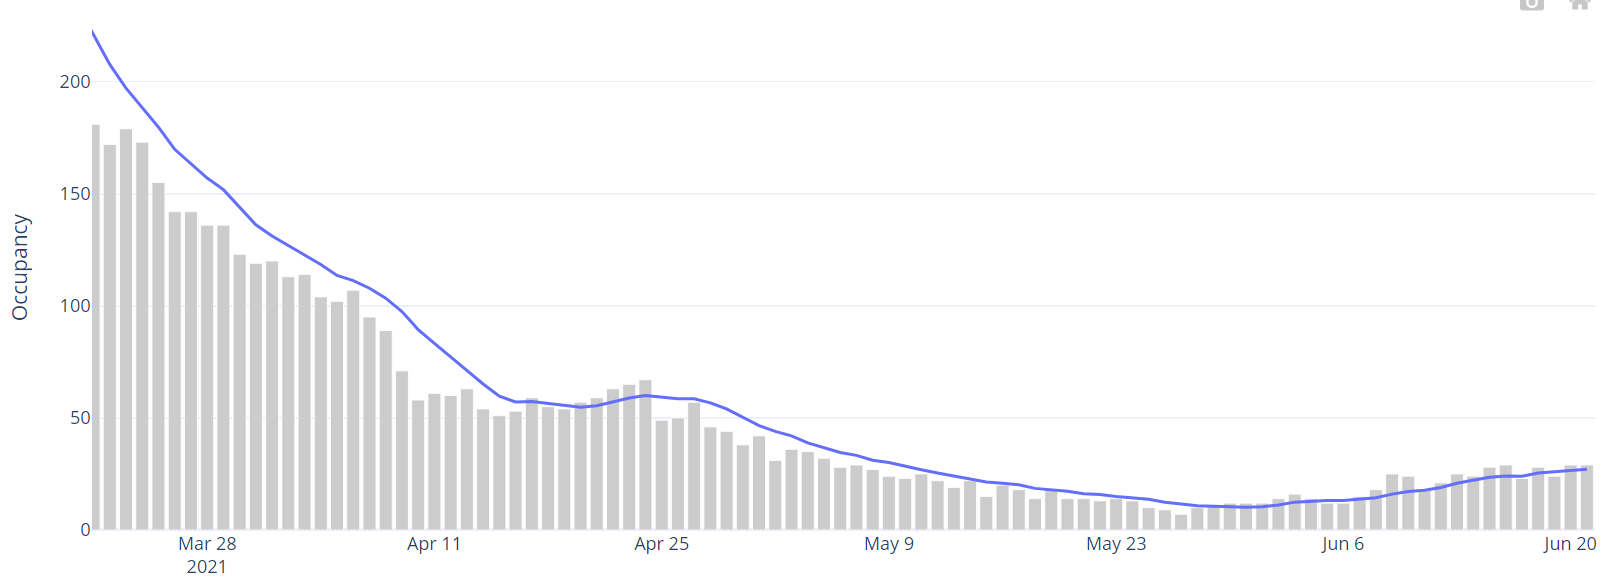
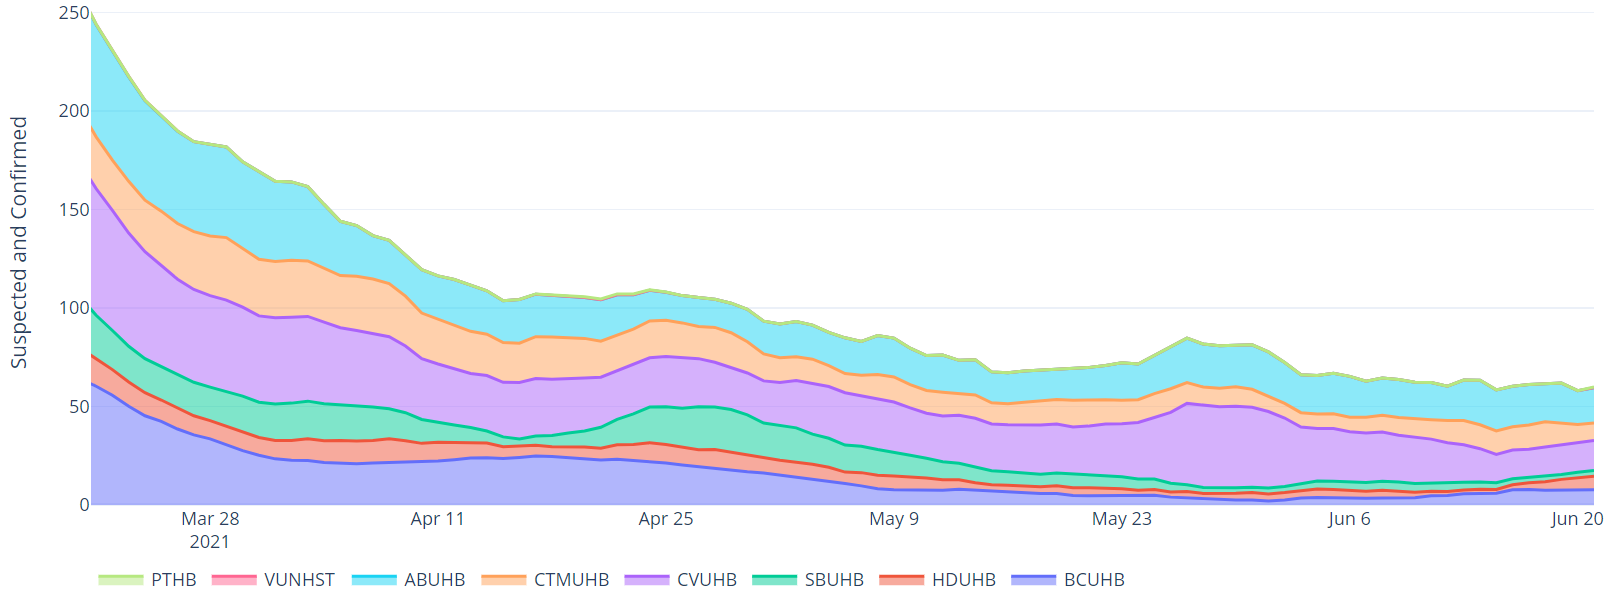
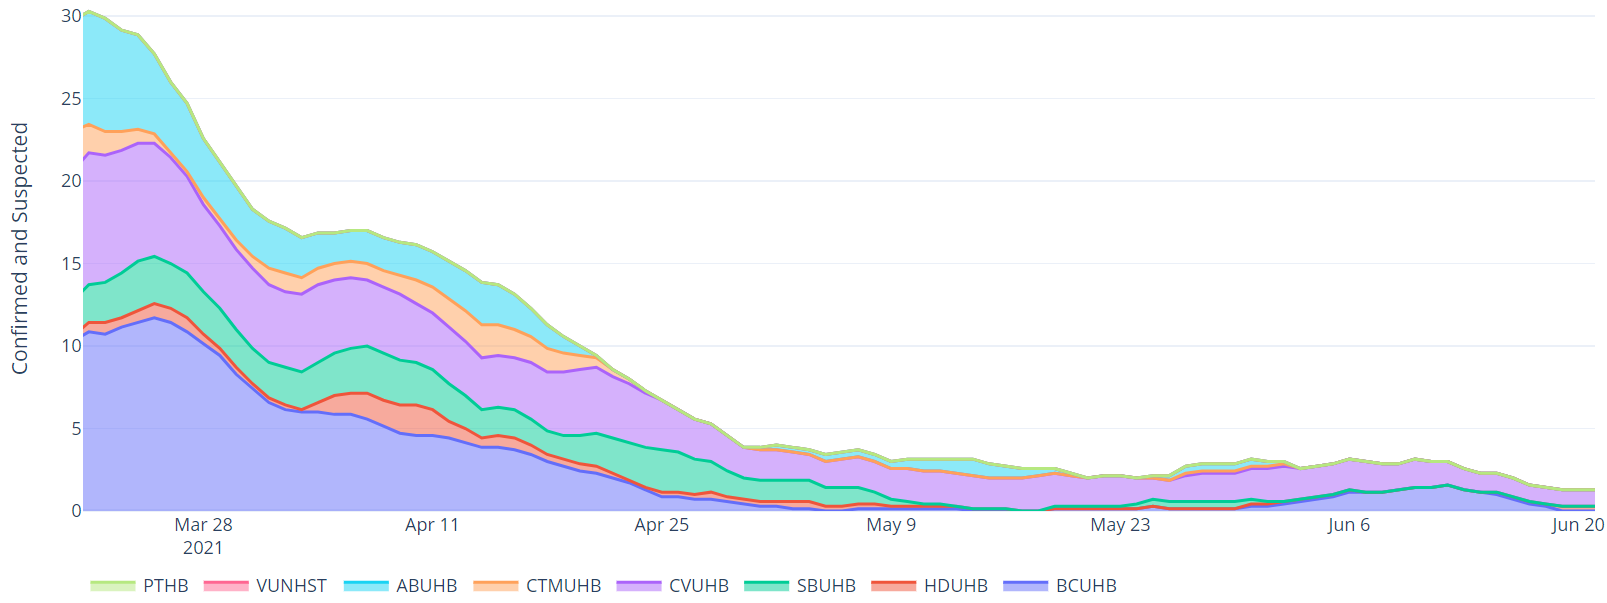
COVID-19 pressure on the NHS has generally stabilised and is now similar to the lowest levels since reporting began. As at 23 June 2021, there were 114 COVID-19 related patients (Suspected, Confirmed and Recovering) occupying a hospital bed. This compares to 132 (18 fewer occupied beds) on 16 June 2021. Confirmed patients accounted for 28 of the total occupied beds, and are at similar levels to early May 2021.
There is 1 patient with Suspected or Confirmed COVID-19 in a critical care bed in Wales. This is 163 lower than the maximum COVID-19 position of approximately 164. The total number of patients in critical care for both COVID-19 and non-COVID-19 stands at 154, 2 more than the historic maximum critical care capacity of approximately 152.
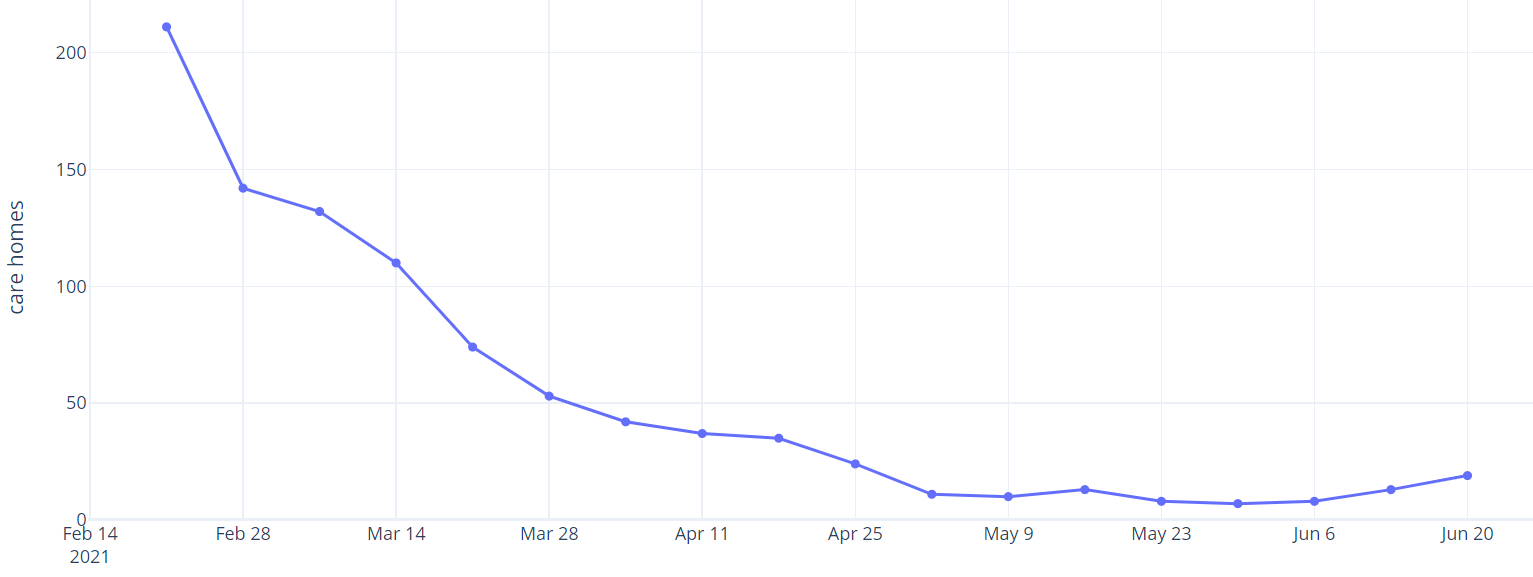
The situation with care homes remains stable with a relatively low number of care home incidents reported across Wales.
In the 7 days up to 16 June 2021, 12 (1.1%) adult care homes in Wales notified CIW of one or more confirmed cases of COVID-19, in staff or residents. This is 1 more notification compared to the last 7 days up to 9 June 2021. The number of notifications is similar to the lowest levels since the beginning of the reporting period on 16 December 2020.
Confirmed hospital occupancy (7 day rolling average)
Overall invasive ventilated bed occupancy (7 day rolling average)
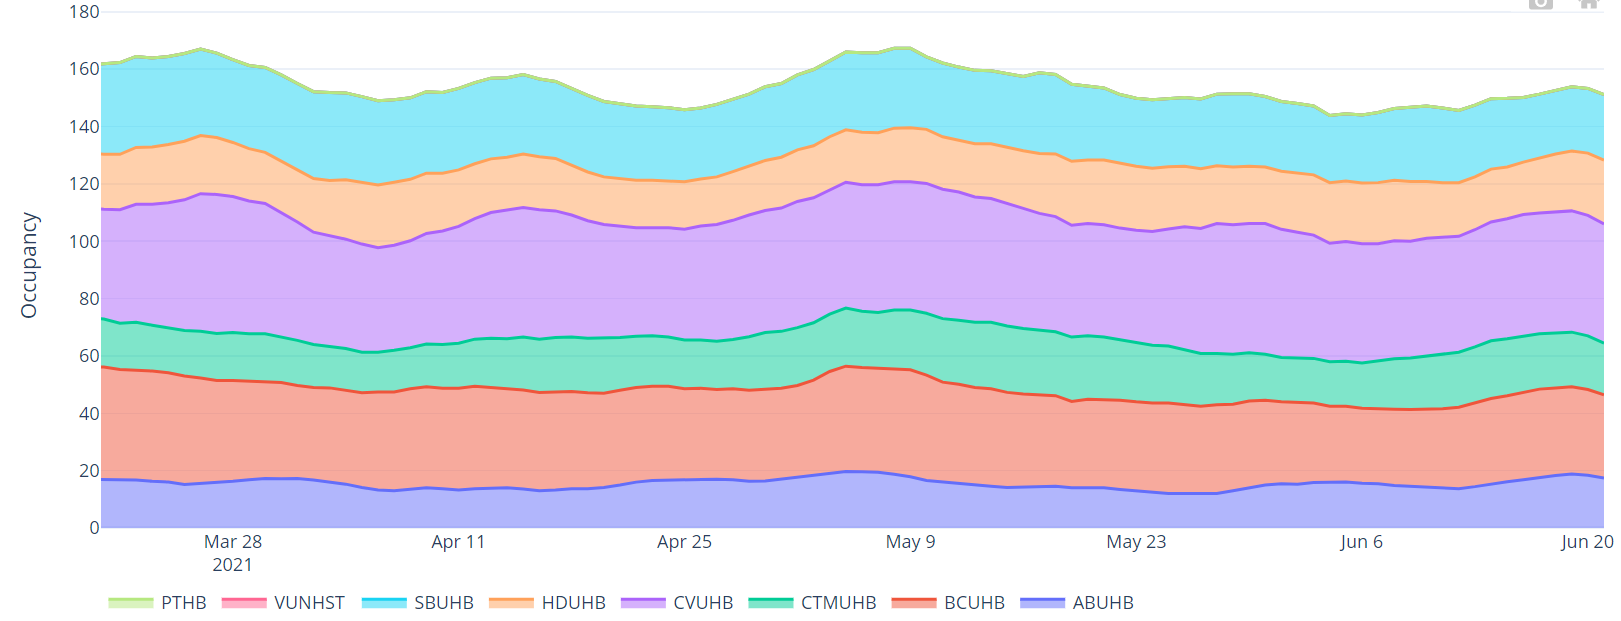
Hospital bed occupancy for suspected and confirmed COVID-19 positive patients (7 day rolling average)
Invasive ventilated bed occupancy for suspected and confirmed COVID-19 positive patients (7 day rolling average)
Number of adult care homes reported an ongoing outbreak/incident (last 7 days)
What is the situation with education, children and young adults?
Childcare settings
The latest National Situation Background Assessment Recommendation (SBAR) report covering the week of 14 June to 20 June reported that the incidence of clusters in child care settings remains low. There were 2* new clusters, associated with child care settings reported last week, across 2 health board areas. Both clusters were small in size and involve both staff and children.
Schools
The National SBAR for the above period reported 6* new clusters for last week, compared to 1 the previous week and 2 clusters the week prior to that. There are 6* on going clusters compared to 1 reported the week before. A total of 2 incidents where attributed to school settings and 7 were attributed to household, social and extra-curricular activities.
This increase is not unexpected given the increase in community transmission, in particular the increase in social mixing outside the school setting by pupils from different schools. Local authorities in North and West Wales have reported gatherings and parties involving pupils being responsible for the infection transmission in this cohort. Some IMTs have reported isolated index cases resulting in isolation of school bubbles. There is little evidence at this stage that onsite school transmission is driving case numbers in this population group. Source: National SBAR.
*NB figures do not include data from Conwy, Gwynedd or Cwm Taf Morgannwg.
Weekly COVID-19 incidence per 100,000 population for school age children and young adults in Wales (data as at 1pm 23 June 2021)
Schools with more than one COVID-19 case identified within the last 21 days, excluding 151 schools with 1 COVID-19 case
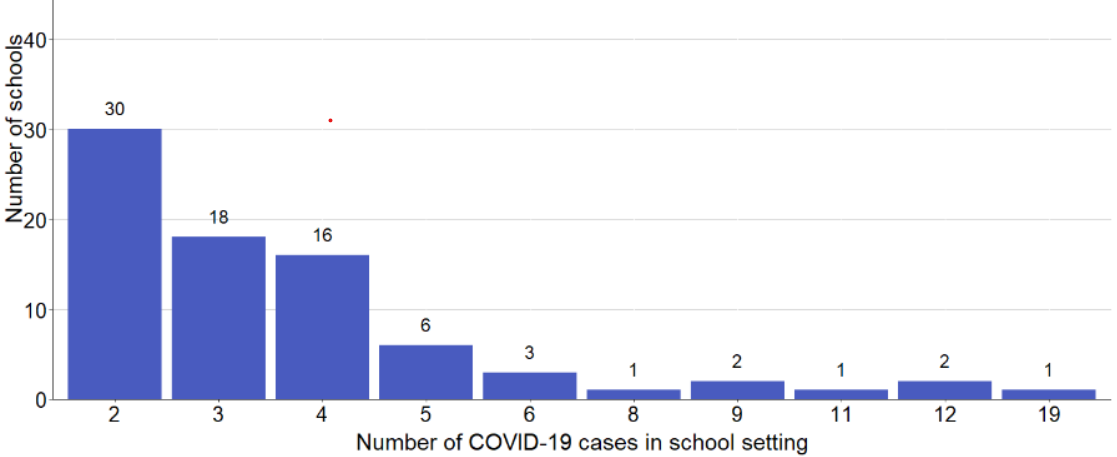
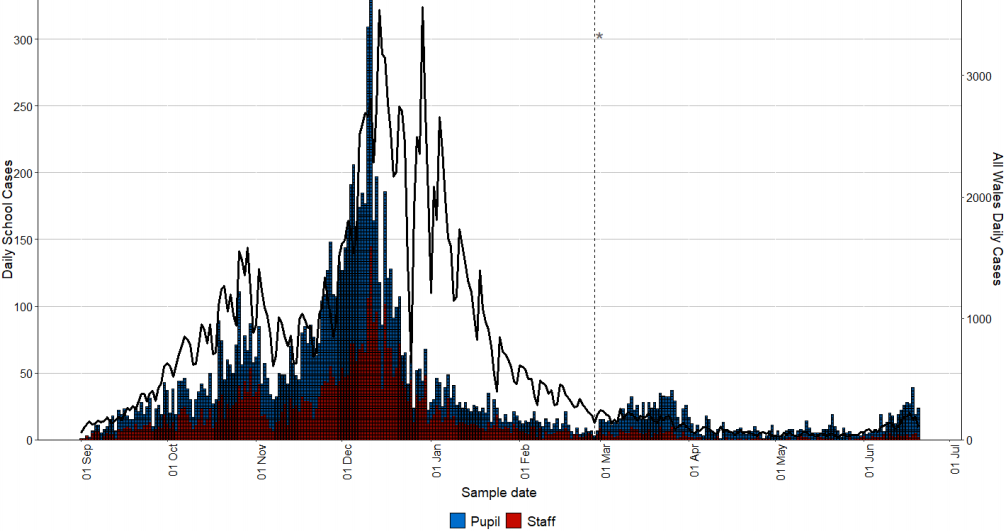
Epidemiological curve of cases in all staff and pupils linked to a school between 01 September 2020 to 21 June for all Wales maintained schools
School Attendance
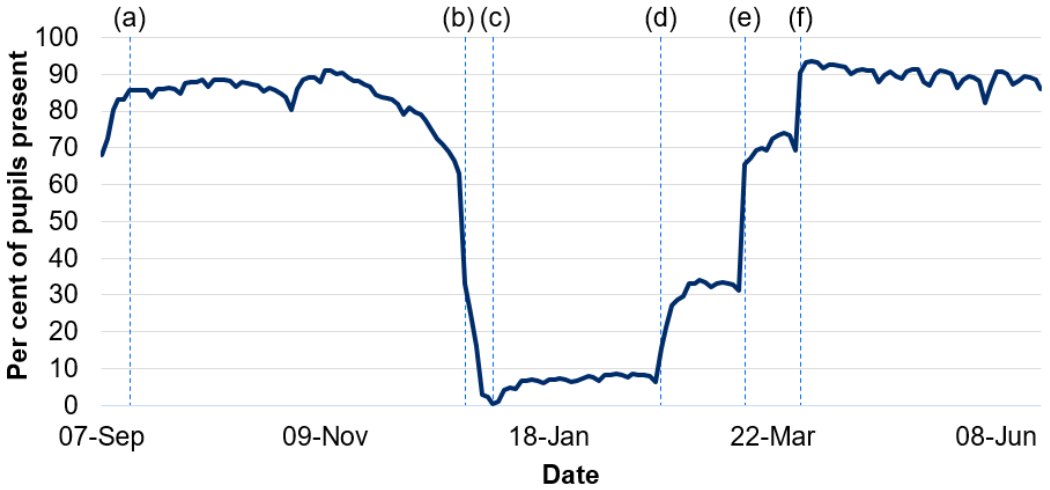
An average of 89% of all pupils were present in school over the week of 14 June to 18 June. This information is provisional and will be revised on 30 June. There is no data for the week of 31 May to 4 June due to the school holidays. Source: Stats Wales
Pupils present by day in Wales, from 07 September 2020
Further Education (FE)
The latest National SBAR reported 1* new and 1* on going cluster associated with Further Education settings for the period 14 June to 20 June. There were no new or on going clusters reported the previous week. Source: National SBAR
Higher Education Institutions (HEIs)
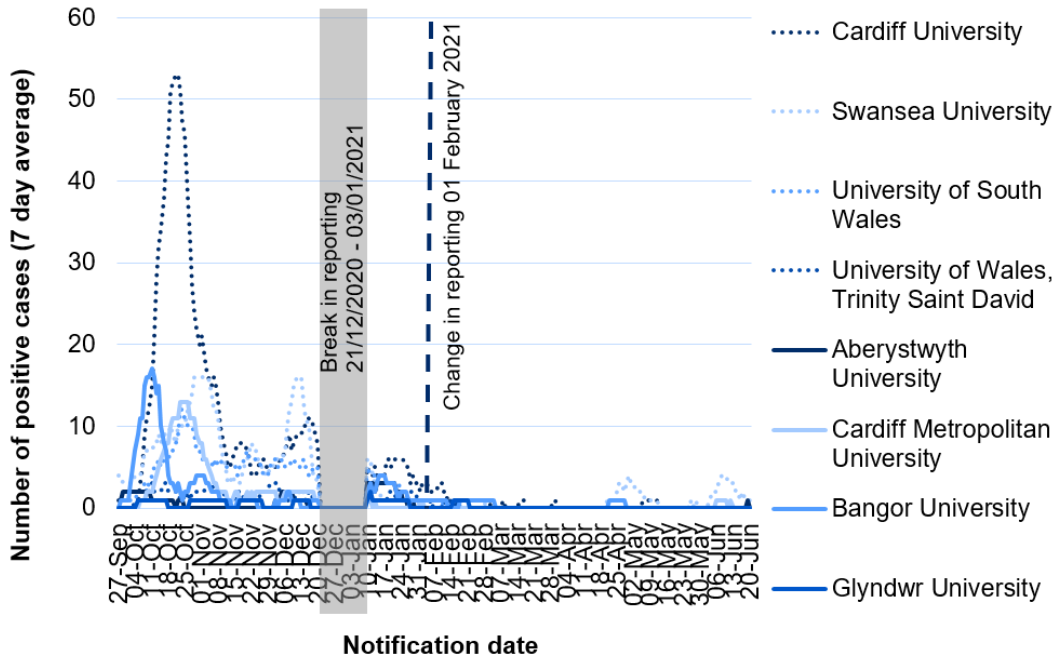
HEIs report cases notified to them by students and staff. From 1 February 2021 most HEIs have changed the way in which they report data, with positive cases referring only to students or staff attending campus or returning to the local area for study (with the exception of University of Wales Trinity St David's who are unable to split cases on this basis). Over the past week, the 7-day rolling average has been less than 3 positive COVID-19 cases for all HEI's. Source: Stats Wales
We now also capture data via the National SBAR from local IMTs. There were 4* new clusters and 6* ongoing clusters associated with HE settings last week. IMTs continue to report that case and cluster incidence is being driven by social contact and activities outside HE settings.
There has been poor compliance with overseas students leaving to return home and not complying with self-isolation and ‘do not travel’ advice. Most students concerned were in the final year. Source National SBAR
*NB figures do not include data from Conwy, Gwynedd or Cwm Taf Morgannwg.
7 day rolling average of positive cases in Welsh universities 27 September to 20 June 2021
Please note: Due to accuracy & timeliness limitations with the capability of our surveillance systems, distinguishing exact case associations between children over 19, school staff and/or family members is currently not possible. We are looking to develop this with local health protection officers.
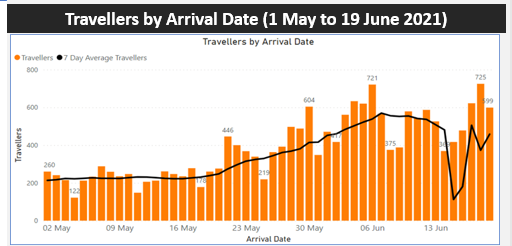
What is the situation with arriving travellers
There has been a slight decrease in the overall arrivals (approximately 9%). Amber arrivals have seen a rise of approximately 330, whilst Green arrivals are significantly low.
Positive cases remain low at 0.1%. There was a rise in arrivals from Baku in Azerbaijan following the recent football matches. 120 arrivals on Thursday 17th June. There are currently no positive cases linked to this event.
- 3,540 total this week (3,882 last week:
- Amber: 3,170 (2,824 last week)
- Red: 140 (123 last week)
- Green: 191 (884 last week)
- 4 positive arrivals (0.1%) who have quarantined in Wales
- In the same period 483 (533 last week) of 3,540 travellers marked themselves as exempt (13.6%)
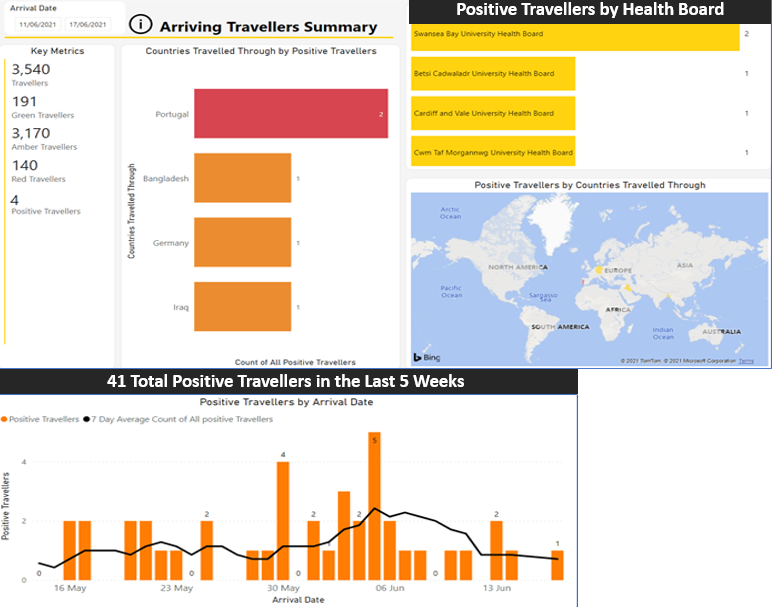
Source: Home Office, as at 17 June 2021
Please note that the data provided by the Home Office is derived from Passenger Locator Forms (PLF) which are self-completed by travellers. As such, data may contain inaccuracies. Due to the limitations associated with data capture and legislation, some minor discrepancies may be present in the data.
Mobility data, adherence and UK comparison
Mobility data up to 17 June is similar to last week. Note that the baseline for much of the data is during Jan-Feb 2020 and changes are relative to that period. It is not possible determine if mobility is higher/lower than would have been expected prior to the pandemic as data is not published prior to 2020.
Mobility data by location of trip
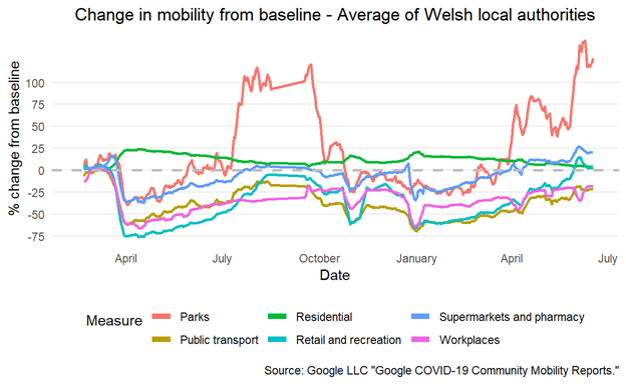
Source: Google
Adherence
The most recent IPSOS MORI data is the same as last week, which for the period 4 – 8 June showed a reduction in those who are ensuring they are more than two meters apart from others, which was the lowest since first reported at the end of March 2020. It should be noted that this is self-reported adherence and will be affected by individuals understanding of the rules.
The latest results from the Public Engagement Survey on Health and Wellbeing during Coronavirus Measures for the period 7 – 13 June show that #% of people say they understand current restrictions in Wales ‘very well’ or ‘fairly well’ and that 80% said they were following coronavirus restrictions ‘completely’ or majority compliance. 42% reported having people outside their household/permitted support bubble come into their house.
Source: Survey of Public Views on COVID-19, 4 to 8 June 2021
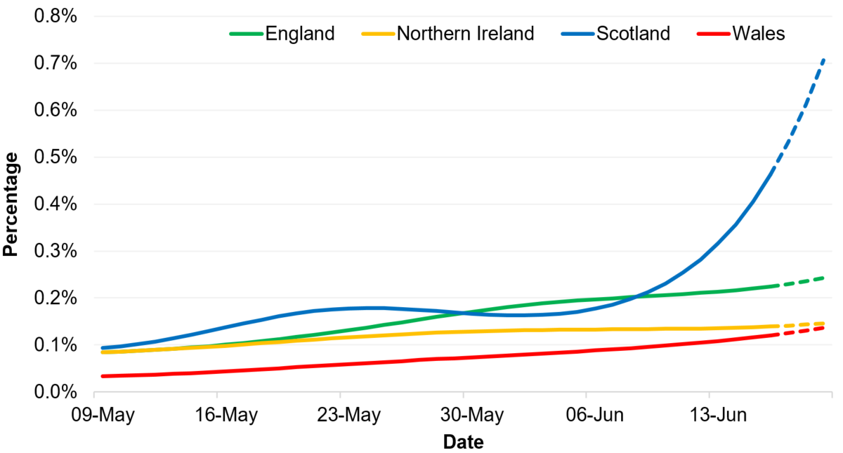
Results from the Coronavirus (Covid-19) Infection Survey, 13 June to 19 June
The percentage of people testing positive has increased sharply in Scotland in the most recent week. The positivity rate appears to have increased slightly in Wales and England in recent weeks, however the trend is uncertain in the most recent week. The positivity rate remains low in Northern Ireland.
During the most recent period, it is estimated that an average of 3,700 people in Wales had COVID-19 (95% credible interval: 1,600 to 6,600), equating to around 1 in 830 people. This compares to around 1 in 440 people in England, around 1 in 220 people in Scotland, and around 1 in 720 people in Northern Ireland.
Source: Office for National Statistics COVID-19 Infection Survey
Positivity rates (%) across UK countries up to 19 June 2021
Vaccine and immunity status
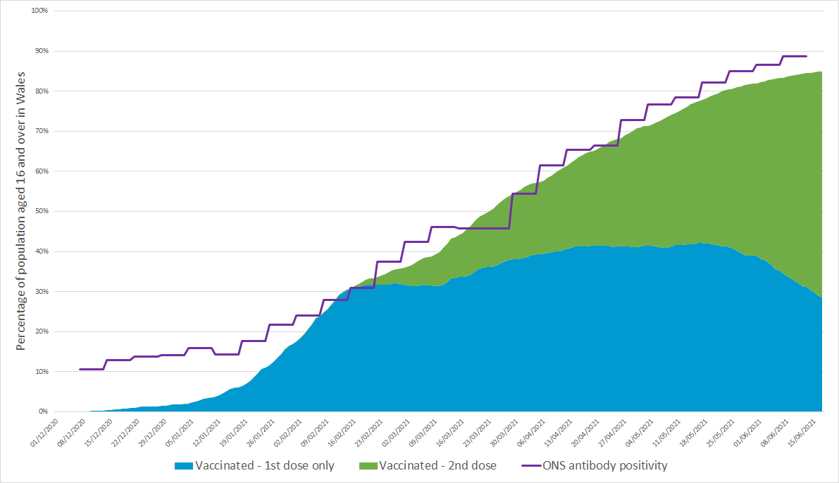
Vaccination and antibody status of individuals aged 16 and over in Wales
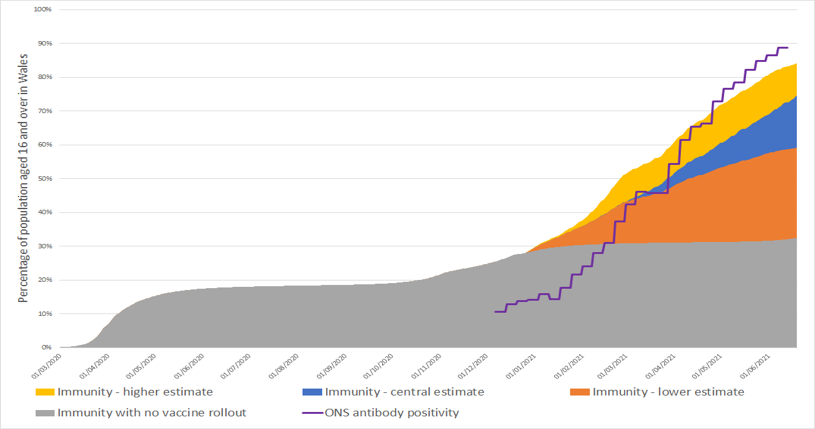
Immunity estimates and antibody status of individuals aged 16 and over in Wales
The COVID-19 vaccination rollout continues to progress well in Wales. As at 19 June 2021, 85% of people aged 16 and over had received at least one COVID-19 vaccine dose in Wales. 27% of people aged 16 and over had exactly one vaccine dose and 58% are fully vaccinated.
Between 7 and 10 June 2021, the ONS COVID infection survey estimated that 88.7% of the community population aged 16 and over in Wales tested positive for COVID-19 antibodies.
As at 19 June 2021, it was estimated that 75% of people aged 16 and over in Wales had some immunity against COVID-19 infection. The lower and higher estimates of immunity are 59% and 84% of people aged 16 and over in Wales. If no vaccines had been administered, it is estimated that 32% of people aged 16 and over would be immune. These estimates do not account for waning immunity and assume all natural infections lead to immunity.
It is currently estimated that over 80% of the total Wales population must be immune to COVID-19 before herd immunity effects would be observed1. Note that the immunity estimate of 75% is for individuals aged 16 and over, not the total Wales population, and varies across age groups.
Differences between antibody presence and immunity estimates include:
- ONS antibody estimates are based on study participants who have volunteered for the study and estimates extrapolated.
- ONS estimates are based on the 16+ community population, which excludes people in care homes or hospitals. Immunity estimates are based on the whole 16+ Wales population.
- While antibody protection doesn’t equal immunity from infection, it does give a useful indication of the level of protection from infection in the Welsh population, on top of the impact of vaccines.
Source: ONS COVID-19 Infection Survey, PHW, SPI-M, Swansea University modelling
1 TAG advice on the Delta variant published on 18 June 2021.
What does the situation look like going forward?
Based on the current rates observed with current restrictions:
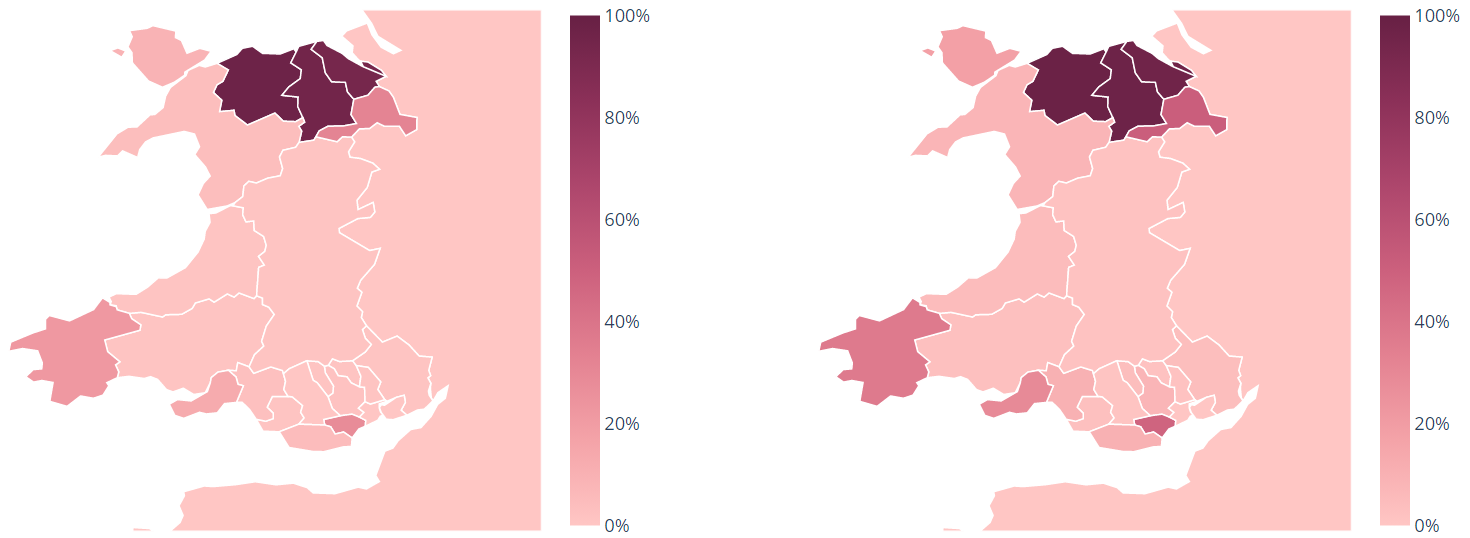
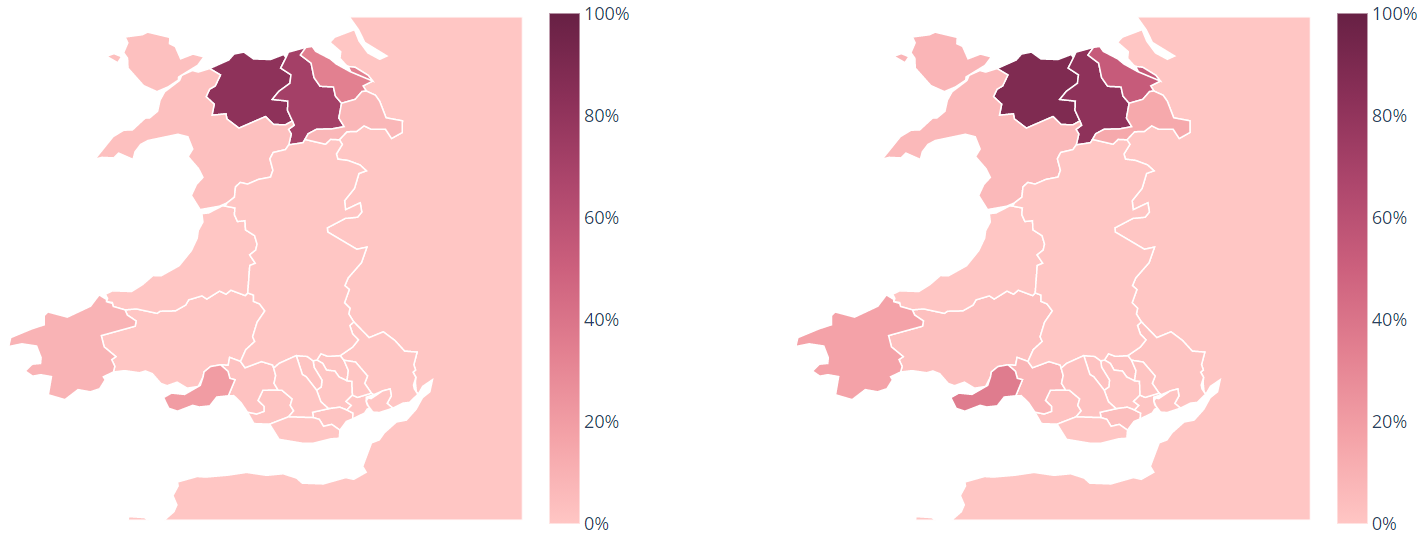
- Cases – the probability of incidence greater than 100 per 100,000 is high for Conwy, Denbighshire and Flintshire, and above 50% for Wrexham between 4 July and 10 July. The figure illustrates the probability (between 0 – 100%) of incidence being greater than 100 per 100,000. Source: Imperial College London
Probability of greater than 100 per 100,000 cases by local authority, Wales
27 June - 3 July and 4 July - 10 July
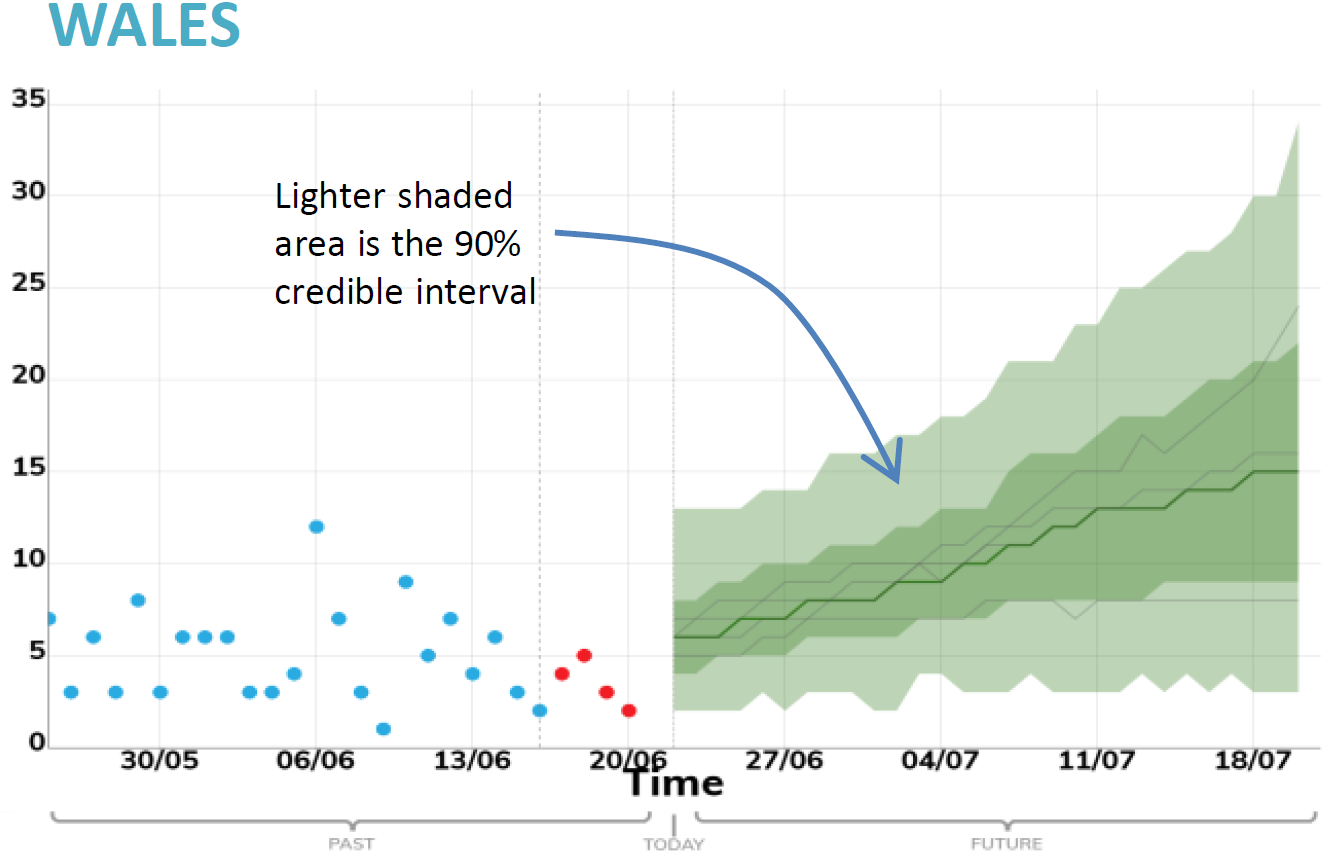
- Deaths per day – projected to remain low over the next six weeks. Source: Modelled medium term projections, SAGE/SPI-M, 22 June
- Hospitalisations per day – projected to increase over the next four weeks. Source: Modelled medium term projections, SAGE/SPI-M, 22 June
These projections are based on current trends and will not fully reflect the impact of policy or behavioural changes over the past two to three weeks. The projections include the impact of vaccines, but cannot capture any future increases in transmission resulting from new variants. They are not forecasts or predictions.
Key risks and sources
Key risks
Transmissions, incidence and prevalence
Overall transmission, percentage of people testing positive is increasing since last week. Trends vary across health boards and local authorities.
NHS Capacity
COVID-19 pressure on the NHS remains stabilised at the lowest levels since the pandemic began.
Mortality
Remains at a low level, with no deaths in the most recent week.
Variants
The Delta variant is now the dominant variant in Wales and continues to increase rapidly, although from a low level. Numbers remain relatively low in comparison to other parts of the UK. Protection against symptomatic disease remains high for two doses and protection against hospitalisation remains high for both single and double doses.
Immunity and vaccines
3.82 million (+0.14 million) doses of COVID-19 vaccine have been given in Wales, of which 2.25 (+0.02) million were first doses and 1.57 million (+0.12) were second doses.
International
There is a slight decrease in traveller numbers this week. The recent football matches are likely to increase travel, however positive rates continue to remain low.