
Gwyddoniaeth Ymchwil Tystiolaeth: modelu'r gaeaf 2026 i 2027 - Part 1: introduction
Mae'r papur hwn yn darparu senarios wedi'u modelu ar gyfer ffliw, COVID-19 a feirws syncytiol anadlol (RSV) ar gyfer tymor y gaeaf sydd i ddod.
Ar y dudalen hon
Introduction
Winter respiratory viruses are associated with seasonal increases in mortality and morbidity and consistently increase pressure on NHS Wales, though their impact varies each year.
Uncertainty remains due to factors such as the timing of when different viruses see peak activity and the effectiveness of seasonal vaccines.
This paper presents modelled scenarios based on historical data to support winter 2026 to 2027 planning for NHS Wales.
It estimates potential pressures on hospitals, in terms of admissions and bed occupancy, from seasonal respiratory viruses, with a focus on:
- influenza (flu)
- RSV
- COVID-19
Whilst we observe COVID-19 activity all year round, there are recognised winter peaks and overlapping peaks with flu and RSV could compound demand on healthcare services.
The report also examines wider impacts of winter pressures across NHS Wales beyond hospital admissions, including:
- ambulance calls
- Emergency Department attendances
- primary care activity due to respiratory illnesses
- trends in GP consultation rates for acute respiratory infections
Important information about the modelling
As with all modelling, the scenarios in this paper are not a prediction of what will happen but estimates of what could happen.
- we could also see similar peaks occurring at a different time in the season.
- we aim to present a manageable number of selected example scenarios rather than every possible scenario of what might happen.
- the modelling uses past data to estimate future projections.
- any changes to the NHS system (For example, propensity to admit people to hospital, changes in access to primary care), particularly in the past 12 months, may not have been taken into account in the modelling.
Respiratory virus activity varies substantially between seasons, particularly for influenza, where the incidence, timing, duration and severity of outbreaks are influenced by factors such as:
- circulating strains
- population immunity
- vaccine effectiveness
resulting in considerable year to year uncertainty.
This paper estimates the impact of known viruses and other determinants of health likely to increase the demand for healthcare in Wales across the 2026 to 2027 winter period.
It should be used as an indication of what we expect to see based on historical data, rather than what will happen.
- Winter modelling 2022 to 2023
- Winter modelling 2023 to 2024
- Winter modelling 2024 to 2025
- Winter modelling 2025 to 2026
This 2026 to 2027 winter modelling report has also included additional epidemiological modelling techniques. These are identified throughout the report and explained in further detail in the Annex.
Definitions and terminology
The terminology used throughout this report is defined below. For further information on data sources used for the analysis in this report, see the Annex.
Data definitions
Admissions (daily)
Definition
The daily count of new hospital inpatient episodes in which the relevant ICD-10 diagnosis code appears in any diagnostic position (not limited to the primary diagnosis), recorded at the admitting episode only (the first episode of the spell). Day cases are included.
Notes and context
See the NHS Wales Data Dictionary.
Bed occupancy (daily)
Definition
The daily count of occupied hospital beds during a specified period.
Notes and context
- Bed occupancy is often referred to as ‘occupancy’ within this report.
- Distinct from new daily inpatient count, it captures the ongoing in-hospital caseload.
Emergency Department attendance
Definition
A recorded visit by a patient to an Accident and Emergency department for treatment provided by that service. For this report, the focus is on attendances flagged with a respiratory diagnosis across winter.
Notes and context
- See the NHS Wales Data Dictionary (Accidents and Emergency)
- Respiratory attendances only are included
- All-cause ED figures are not included in this report but can be found on the NHS Activity and Performance Summary
GP consultation rate
Definition
The number of GP consultations for acute respiratory infections (ARI) per 100,000 registered practice population, derived from the GP Sentinel Surveillance of Infections Scheme in Wales.
Diagnosis is based on syndromic evaluation. No pathogen-specific laboratory confirmation is required, so rates may over or underestimate the true incidence of individual pathogens.
Notes and context
Two age bands are reported:
- children (0 to 14 years old)
- adults (15 years old and over)
ICD-10 codes
Definition
The International Classification of Diseases, 10th Revision, a standardised World Health Organization coding system used to classify diagnoses on hospital records.
Notes and context
The analysis in this report uses the following ICD-10 codes:
Influenza
- J09
- J10
- J11
RSV
- J12.1
- J20.5
- J21.0
- B97.4
COVID-19
- U07.1
- U07.2
- U09.9
- U10.9
Other infections
- J12 to J22X (excluding the RSV codes)
- B05 to B06
- A08.1
- A37
- B950
- A400
- A389
- B9781
For more details, see Tables A13 and A14 in the Annex.
Terminology
Average
Definition
The arithmetic mean (sum of all values divided by the count of values), unless stated otherwise.
Notes and context
Median or mode are identified explicitly where used.
Peak
Definition
The single highest value of the 7 day rolling averages of the recorded values within a given winter period (1 September 2026 to 31 March 2027).
The peak date is the calendar date on which this maximum was observed. Where the same maximum value occurs on consecutive dates, all such dates are reported.
Notes and context
Peak dates may span multiple consecutive days.
Winter period
Definition
1 September 2026 to 31 March 2027 (inclusive). Unless stated otherwise, all analysis is restricted to this window.
Notes and context
Vaccine rollout analysis covers the full calendar year where relevant.
Background
The data and modelling presented in this report have several uses.
The respiratory winter modelling of hospital admissions presented in this report are compared to observed values (‘actuals’) on a weekly basis throughout the winter period (between September 2026 and March 2027 inclusive).
They are presented at system resilience and planning meetings to stakeholders including NHS Performance and Improvement colleagues, Public Health Wales (PHW), and decision-makers/planners in the Welsh Government and Local Health Boards.
This is to provide awareness and an early warning of increases in respiratory illnesses, particularly where the admissions may differ from what is expected, allowing for earlier and effective planning.
For instance, this may include:
- planning for surge capacity
- cancelling non-urgent surgical activity
- cancelling surgery that may require critical care beds
At these meetings, as well as the winter modelling presented in this report, additional separate modelling is also provided which projects forward 2 weeks (short-term projections) to give an idea of estimated admissions over the coming fortnight.
These models are also compared to actuals on a regular basis throughout winter and are published in our communicable disease surveillance reports.
For further detail on performance of the STPs during the 2025 to 2026 winter, please see this report.
As well as this winter modelling report, we will also publish a technical report to provide users with more detail on the methodology, assumptions and limitations on the RSV and flu epidemiological compartmental models used as part of this winter modelling work.
At the time of publication, the technical reports are awaiting peer review but are published with this caveat in the interests of transparency.
The RSV compartment model passed the previous Welsh Government Annual Assurance Process and will be assessed again this year along with the flu compartment model.
Local health board users also make use of the report and the underlying data of which they have access to which goes down to health board level.
This year, health board decision makers will be able to access an interactive dashboard to consider and compare their historic data and winter scenarios with other health boards and with the overall Wales-level data.
This allows users to view data that is important and relevant to them, providing real-time access to the winter modelling produced by the Science Research Evidence (SRE) Division, Welsh Government, which can be used for live planning and response.
Additional factors to consider
Adverse weather can significantly impact health and health and care services in terms of:
- spread of diseases
- supply chains
- workforce availability
- accessibility of services due to travel disruptions
In recent months, The Met Office has warned of ‘unprecedented’ El Niño predicted for winter 2026 to 2027 in the UK.
El Niño is a naturally occurring phenomenon that happens over the Pacific Ocean roughly every 2 to 7 years, which can increase global temperatures.
A typical El Niño leads to an equatorial Pacific sea-surface temperature rise of between 1 to 2°C, with 2°C being defined as a big event.
The Met Office’s long-range El Niño forecast (Kettleborough et al 2026) are showing record values of sea-surface temperature increases of more than 3°C in the coming months.
The influence of El Niño increases the chances of wetter, stormier conditions for Northwest Europe, including the UK, in the coming autumn and early winter.
The Met Office’s long-range forecast is a prediction of what may happen.
The Met Office is monitoring and continually running new forecasts as well as working with government departments to understand the wider implications of the 2026 El Niño and will provide further updates as winter approaches.
Behavioural factors are an important determinant of winter health outcomes and associated demand on health and care services.
Population-level behaviours, including:
- uptake of respiratory vaccinations
- healthcare-seeking decisions
- adherence to infection prevention measures
- social contact patterns
- actions relating to warmth, nutrition and self-care
can influence transmission, disease severity and service utilisation.
These behaviours are shaped by a range of interacting factors, including:
- risk perception
- trust
- social norms
- accessibility of services
- wider socioeconomic circumstances
Consequently, behavioural responses can amplify or mitigate winter pressures and represent an important source of uncertainty within winter planning assumptions.
Consideration of behavioural drivers, barriers and likely responses to public health interventions should therefore complement epidemiological and service capacity modelling when assessing potential winter impacts and identifying opportunities to reduce avoidable demand.
Using information from Australia to estimate what we may see in Wales, the flu season may see similar figures to 2025 although there could be increased proportion of influenza B and a potential shift in the dominant form of COVID-19.
The potential increase in influenza B reinforces the role in vaccines, in particular, the usefulness of school-age campaigns to reduce predicted winter demand on health services.
See the Annex for further information.
Last year’s modelling compared with actuals
The hospital admissions modelling scenarios for flu, RSV (ages 0 to 4 years), and COVID-19 provided in the 2025 to 2026 winter modelling report have been compared with the observed data (actuals) provided by Digital Health and Care Wales (DHCW) up to the end of 31 March 2026.
Overall, the analysis suggests the scenarios tracked closely with:
- the ‘High Season, VU = 60%’ scenarios for RSV (ages 0 to 4 years)
- the ‘Moderate’ scenarios for COVID-19
- the ‘Moderate’ scenarios for flu
The modelled peaks for these scenarios were extremely close to the observed admissions (actuals).
However, the observed flu season did begin earlier than expected.
Please see the Annex for further detail on last year’s 2025 to 2026 winter modelling compared to the actual number of hospital admissions which occurred.
Winter peaks
To convey winter pressures for different elements of the health care system (admissions, ED attendances and GP consultations), a heat map of the most likely scenarios (MLS) of 9 modelled indicators was created. (See Figure 1).
Most of the respiratory pressure across healthcare settings throughout the 2026 to 2027 winter is expected to occur towards late December and early January.
However, COVID-19 admissions are estimated to peak about 2 to 3 months ahead of this (See Figure 1).
COVID-19 is projected to be the earliest driver of hospital pressure during the winter of 2026 to 2027, with projected admissions peaking in week 40, well ahead of the main winter period.
The COVID-19 MLS then declines steadily and is estimated to remain low for the rest of the winter, contributing little to the peak-period pressure experienced around the end of 2026.
RSV admissions in children aged 0 to 4 years peak in week 51, while:
- flu admissions
- emergency department (ED) respiratory attendances
- adult GP acute respiratory infection (ARI) consultations
- other infections of interest
all peak in week 52.
This period represents the point of maximum system-wide pressure.
Critically, demand peaks are not staggered: primary care, emergency departments, and inpatient services all reach their respective maxima within the same week, limiting opportunities to redistribute capacity across care pathways.
This peak also coincides with the Christmas period, when staffing levels are typically at their lowest, further intensifying operational pressures.
RSV admissions in adults aged 75 years and above are estimated to peak in week 1 2027, alongside:
- 111 respiratory calls
- acute lower respiratory infections (not classified as being due to flu, RSV or COVID-19) referred to as ALRI from here on
ALRI, including pneumonia, acute bronchitis, and bronchiolitis (See Annex), do not show a sharp peak but sustain a high plateau from around week 48 through to week 2, providing a prolonged background burden that overlaps the influenza and RSV peaks rather than following them.
Pressure from seasonal illnesses (for example, flu, RSV) then eases gradually across weeks 3 to 13.
Figure 1: Most likely modelled scenario pressures due to admissions, ED attendances, GP consultations and respiratory calls between week 36 and 13 of Winter 2026 to 2027 [Note 1]
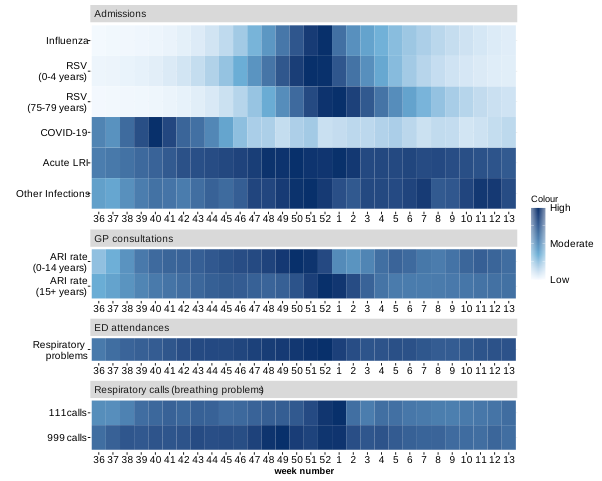
Description of figure 1: a heatmap comparing the likely winter pressure distribution across various infections and healthcare systems in Wales.
Sources: Science Research Evidence (SRE) analysis using data provided by Digital Health and Care Wales (DHCW) and Public Health Wales (PHW).
[Note 1]: The average value for each week was calculated from daily data from the modelled most likely scenarios. ‘High’, where the darkest blue is observed, refers to the estimated 2026 to 2027 winter peak. All other colours are relative to the estimated peaks.